BITCOINBITCOIN,,the structure of the market will never lie, its pure demand and supply, despite the massive selloff of bitcoin by whales the structure lean on bullish path.
but at the moment i see a correction into daily broken supply roof whose retest can be found on the 4hr chart.
if we retest the 4hr chart successfully the rally will begin into another higher roof .
trading is 100% probability
#bitcoin #btc
BTCUSDT.3S trade ideas

BTC Long/Buysbtc has been consolidating between 107,000-113,000 for a while now and i'm expecting it to break this channel soon. i'm in btc buys from level 95,000-100,000 but still i bought some at this level as according my analysis we will retest ath soon.
its a good buying area so if you've missed out previous pumps i will suggest to buy at this level and if one wants to play safe they should wait for close above resistance area. blue horizontal lines are the areas where u can book profits.
I have said it before and i keep saying it btc and gold the only way to make money with them is to buy and forget.
still be safe and risk wisely.

[BTCUSDT] is preparing for a potential reversalOn the daily chart, BTC is currently forming a pin bar candlestick, signaling the possibility of a trend reversal. If no new selling pressure emerges within the next 8 hours, I expect BTC to confirm the pin bar close and break above the downtrend line. In this scenario, the price could rebound toward the 117k area before establishing a new trend.
Before the daily candle closes, investors should carefully observe whether fresh selling pressure appears.
This analysis is for reference only and should not be considered as financial advice.

BTC 8H – EMA Reclaim, Testing $117K ResistanceBitcoin has reclaimed both the 50 EMA ($112,511) and 200 EMA ($112,643), bouncing strongly off the 0.5 Fib ($111,395) and holding its ascending trendline.
Upside:
Price is currently pressing into $117K resistance.
A breakout opens the path toward the liquidity level at $123.3K.
Downside:
Failure to hold above EMAs risks a retest of the Fib cluster, with the 0.618 Fib at $108,285 and 0.786 Fib at $103,856 as deeper support levels.
Stoch RSI is overbought, suggesting potential short-term cooling, but reclaiming EMAs and trendline support keeps structure bullish.
📊 Key focus: Does BTC break $117K resistance for continuation to $123K, or retrace into the Fib cluster first?

bitcoin -1h-longThis chart showcases a significant price movement on a 1-hour timeframe. The price has recently broken out of a well-defined descending channel, indicating a potential shift in momentum. The breakout is accompanied by a decisive break below the trendline, which had previously acted as dynamic support. This move suggests a bearish continuation, with the price testing lower levels. Traders should watch for confirmation through increased volume and potential retests of the broken trendline for support turned resistance. The chart also highlights key horizontal levels that may serve as future support or resistance zones.

Bitcoin trend reversal done ? It is quite evident from the previous plan that we have faced trend reversal for bitcoin. We had a classic breakout followd by retest , consolidation and pumps. Bitcoin had been dumping for a while now and it we were expecting something like this in the near time .
Bitcoin is currently targeting 117k2 followed by 119k4 and 123k resistance for now.
A candle close below 115k will invalidate the bullish bias.
We have also shared a lot of altcoins trade along with the Btc view on our app.
Dont forget to check out ........

BTCUSDT-LONG IDEABTCUSDT almost retracted to 0.618 fib level according to daily time frame on 1hour it has broken its trendline now forming a parallel channel and accumulating in this channel now if it retraces back to it previous higher high point buying would be a good option rest of the things are mentioned in the chart.

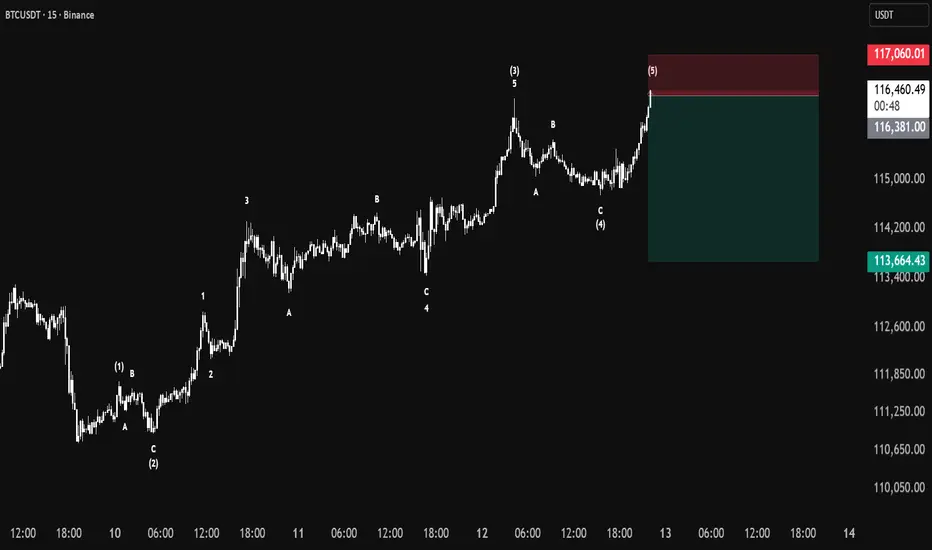
BTC/USDTI think wave five has completed for correction in the ABC, I will open a sell position with this setup.
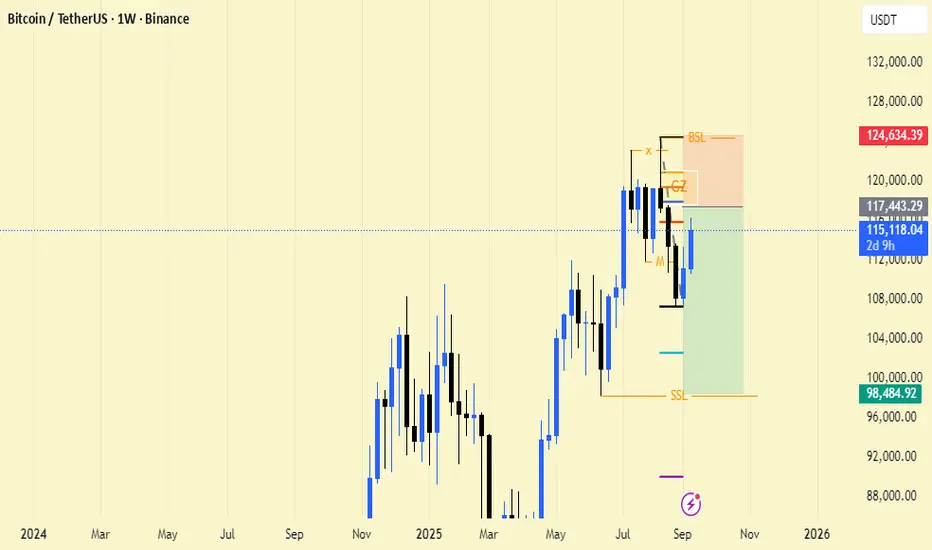
Weekly View on BTC ShortCREITERIA
1-Liquidity Sweep
2-Weekly Mss
3-Pullback to OTE levels
Take Short at OTE LEVEL
Target SSL
BTC(based on NEo wave)bitcoin is making a bow-tie diametric and finale wave is starting.
pay attention: do not buy bitcoin on this final correction,its a good time to buy altcoins like eth,doge,sol and others.
$BTC – Immediate Support BINANCE:BTCUSDT | 6h
The CME gap at 116.8k has now been filled, with price stalling at 115k
At the moment, the key area I’m watching is 114k. If we can find support and bounce here, there’s room for price to make another leg higher. The first target would be a retest of 116k, but momentum could extend toward 117.3k. That 117.5k level has been the major line in the sand for some time — it’s the level that needs to be reclaimed in order to shift market structure away from the current bearish bias.
On the flip side, if price pushes into the 116–117k zone and gets rejected again, I’d like to see 112k hold firm. A solid base at 112k would provide a higher-low structure and set the stage for continuation to the upside. Losing 112k would open the door for a retracement back to 109k.

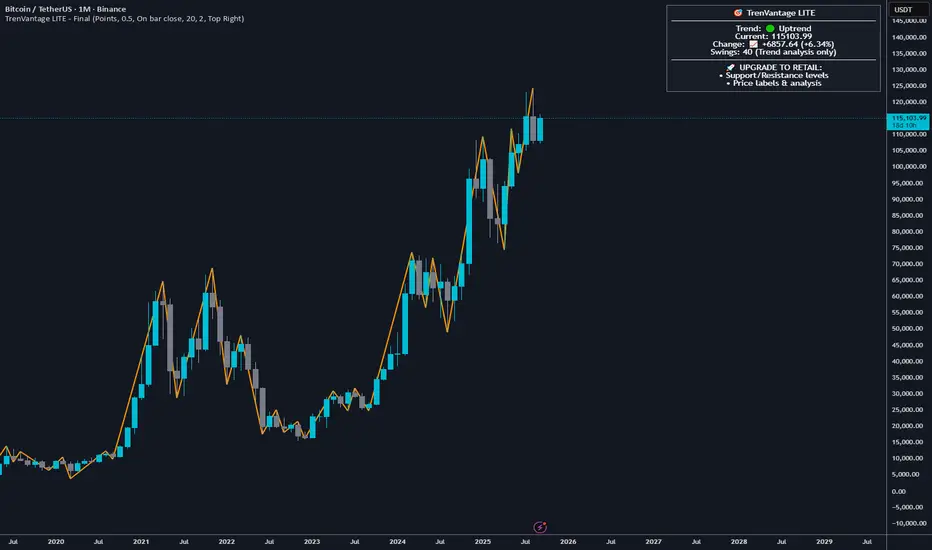
Bitcoin Monthly ChartA look at the trends on the monthly BTC chart. TrenVantage plotting trends automatically.
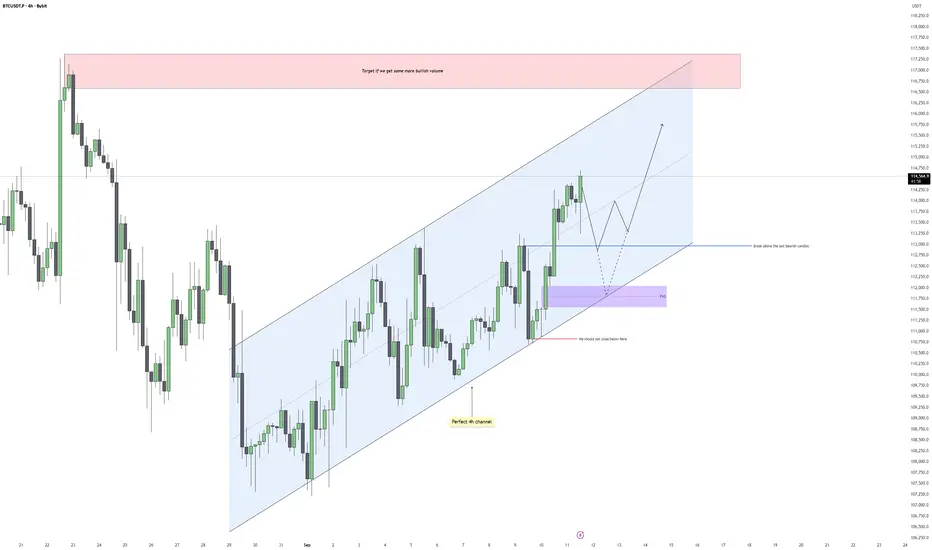
Bitcoin - Clearing the Gaps on the Way to 117kBitcoin continues to respect the ascending channel on the 4H chart, showing steady higher highs and higher lows with clean structure. Price has been climbing with solid bullish momentum, and each retracement so far has been contained within the channel. This gives us a clear framework to track both short-term pullbacks and the next potential leg higher.
Channel Dynamics
The channel is holding perfectly, with both the upper and lower bounds being respected almost to the point. As long as price trades within this structure, the bias remains bullish. A deep pullback into the lower side of the channel would not necessarily invalidate the setup, but we should avoid closing below the last key demand zone if we want to keep the bullish structure intact.
Fair Value Gaps Below
Before continuing higher, Bitcoin may dip back into inefficiencies left behind. A key fair value gap sits below around the 111,700–112,300 region, aligning with prior support. Price filling this gap would be healthy for the structure, giving bulls a better base to push from. If price respects that level, the probability of a continuation toward the channel highs increases significantly.
Bullish and Bearish Scenarios
On the bullish side, if we hold the demand zone and reclaim the blue structure line, price should attempt to sweep short-term highs and extend into the upper channel boundary. A clean break above would open the door to the red supply zone around 117,000–118,000. On the bearish side, any decisive close below the purple fair value gap would shift momentum and put pressure on the lower channel boundary, signaling weakness and invalidating the immediate bullish scenario.
Price Target and Expectations
If the structure continues to play out, I expect Bitcoin to first dip into the imbalance below, find support, then make another leg higher toward 116,500–118,000. This area is a logical liquidity pool where stops above recent highs are clustered, and also aligns with a major supply zone. That zone should be closely monitored for reactions and potential reversals.
Conclusion
Bitcoin remains in a constructive bullish channel, but gaps below need to be addressed before a push into higher liquidity levels. I will be looking for a retracement into the imbalance to set the stage for a continuation higher into the upper red supply zone. As long as we hold above the key demand region, the bullish play remains valid.
___________________________________
Thanks for your support!
If you found this idea helpful or learned something new, drop a like 👍 and leave a comment, I’d love to hear your thoughts! 🚀
Bitcoin pump back to $116700 areaRecently opened a long on bitcoin. Aiming for $116259 area and higher
Sl: 114,750 area
2.45-3.58 RR base on first entry. other Entry is roughly 1.82 to 2.73 RR
Time sensitive seems we getting a bit of push right now.

Bitcoin Short at $118,000— Bounce or Breakdown? Plan + InvalidaSnapshot (29 Aug 2025, 12:46 IST)
Technical View
– 4H Resistance- 118000
– Supports: $110k/$109.5k first, then $105k; major shelf at $101k.
– EMAs (20/50/200) bear-stacked; price below cloud → overhead pressure.
– Momentum rolled over (RSI mid-40s; MACD sub-zero); local rising wedge broke down.
Trade Plan
– Long above $113,500 → T1 $114,800, T2 $118,000; SL $111,800; timeframe swing.
– Short below $118,000 → T1 $108,300, T2 $105,000 (stretch $101,000 if momentum); SL $124574; timeframe swing.
Big Picture
Trend is down from mid-Aug highs; month-end data risk can force a break from the $111k pivot.

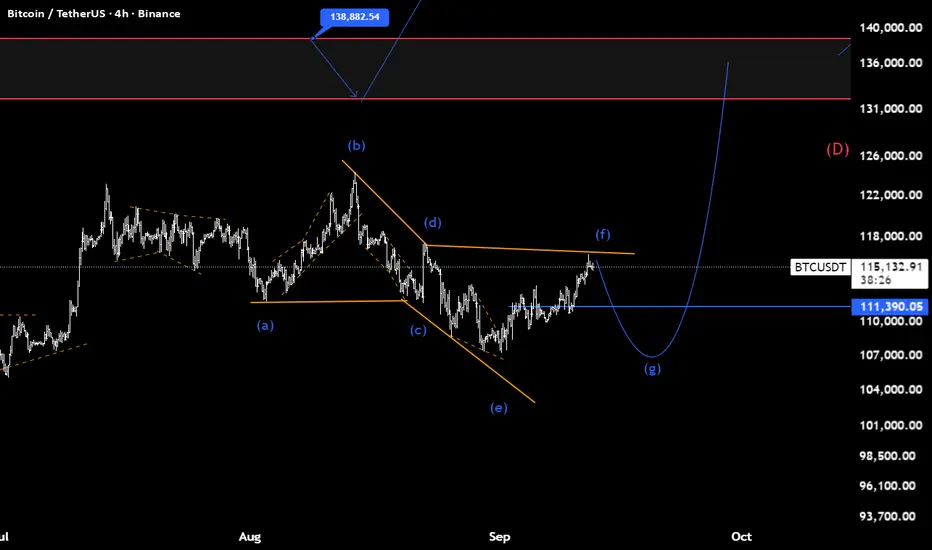
Bitcoin will reach resistance line of channel and then dropHello traders, I want share with you my opinion about Bitcoin. The current market structure for Bitcoin is defined by a well-established upward channel that was formed after the price broke out of a prior triangle consolidation. This bullish pattern has been guiding the price action of BTC higher through a clear sequence of higher highs and higher lows between its dynamic support and resistance lines. The market has just completed another full upward rotation within this structure and is now positioned at a critical inflection point. Currently, the price is directly testing the upper boundary of the channel, which forms a powerful confluence of resistance with the horizontal 113500 - 114000 seller zone. This area has historically been a strong barrier where price has reversed on previous occasions. The primary working hypothesis is a short, rotational scenario, based on the expectation that sellers will once again defend this significant resistance confluence. A confirmed rejection from this seller zone would validate the integrity of the upward channel and likely initiate a new corrective swing to the downside, which would first need to break the current support level at 113500. Therefore, the TP is logically placed at 112400 points, a target that aligns perfectly with the ascending support line of the channel. Please share this idea with your friends and click Boost 🚀

BTC Price Prediction and Elliott Wave AnalysisHello friends,
>> Thank you for joining me in my analysis.
- As I mentioned in my previous idea, we are still moving in this micro correction pink wave X.
- Also, we didn't get the confirmation of the finished wave A, as I mentioned the target of confirmation. So I extended it, and I am still monitoring this wave B. This is all Grey waves ABC is the formation of wave Blue C in this correction Pink X.
- We may return to retest 113k or nearest it for this Grey wave B in my Green Box. In this area, I will also monitor the confirmation of starting the Grey wave C to end this week.
- I will update you soon. Take care, my friends from this area of 117k. We may watch a sudden reversal to deep
>> Reminder:
* For the bigger imagination of the BTC path, we are still moving into the Orange wave A of the final White C for ABC from its beginning.
* For the smaller imagination of the BTC path, we are still moving into the Blue wave B of the final Green C for the upper Orange wave A.
* For the tighter imagination of the BTC path, I think we are still moving into the correction wave X for the upper Blue wave B.
Keep liking and supporting me to continue. See you soon!
Thanks, bros


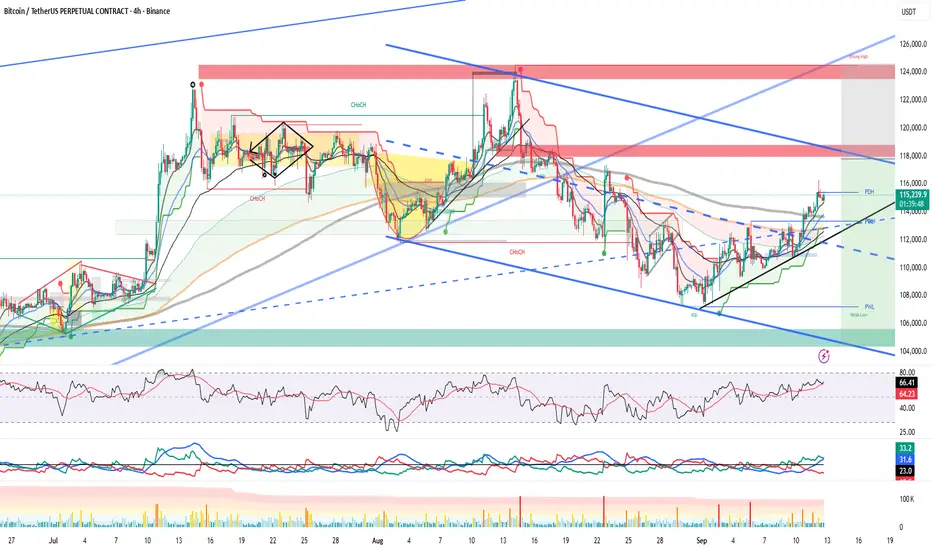
Bitcoin (BTC): Almost Filled CME Gap | Very BullishCRYPTOCAP:BTC continues to show strength after breaking above the 200EMA, with buyers holding momentum firmly in their favor. We are now very close to fully filling the bullish CME gap around $116K — the first key target in this move.
As long as buyers keep control of this zone, the structure points toward continuation. The major target remains the $120K+ region, which would confirm a new ATH in this cycle.
Swallow Academy

Bitcoin Update – 4H Chart
BTC holding above key trendline support around 114.5K – 113.6K.
Break & hold above 115.2K could push price toward 117K – 118.5K.
Losing 114.5K may trigger deeper pullback to 113.6K – 112K.
🎯 Key levels:
Long setup: 114.5K – 113.6K → Targets 115.2K / 117K / 118.5K.
Short setup: Only if rejection holds at 115.2K.
⚡Volatility is heating up – stay sharp!
#BTC #Bitcoin #Crypto #Scalping #TradingView #CryptoTrading

BTC Buy Zone Forming – Potential Bullish Breakout AheadAnalysis:
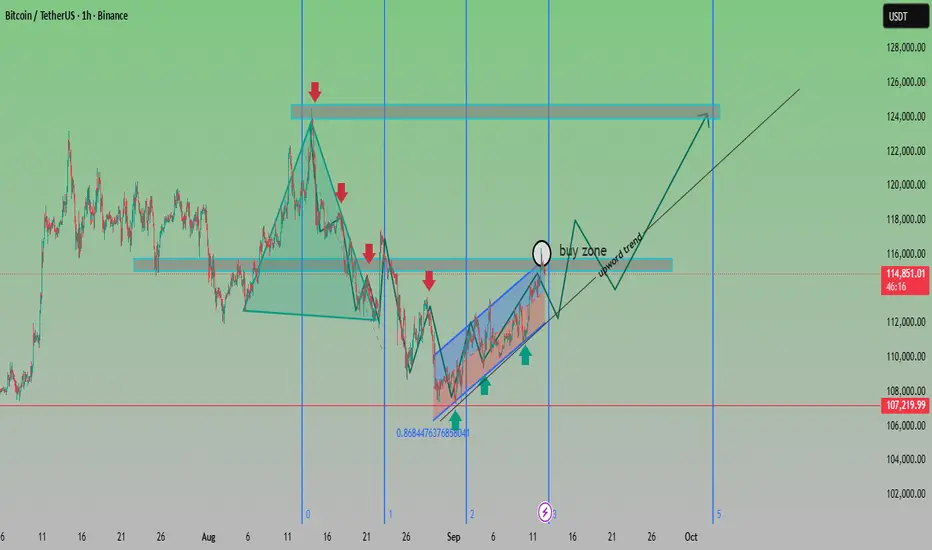
Trend Structure: After a corrective decline from the $124K resistance area, BTC has rebounded strongly, forming a rising channel (highlighted in blue).
Support Levels: Strong demand observed near $107,200, aligning with the 0.868 Fibonacci retracement, making it a crucial support zone.
Buy Zone: Chart highlights the $114K–$116K range as a buy zone before continuation of the upward trend.
Resistance Levels: Key resistance remains around $124K–$126K, which is the next major target if the bullish momentum sustains.
Outlook: As long as BTC stays above $114K support, the bias remains bullish, with a potential rally towards $120K–$124K. A breakdown below $112K would invalidate the bullish scenario.
✅ Bias: Bullish continuation
🎯 Targets: $120,000 → $124,000
🛑 Invalidation: Break below $112,000
BTC Breaks Resistance: Eyes on 123KBTC Breaks Resistance: Eyes on 123K
Bitcoin continues its upward momentum, hitting our first target as expected.
Following the release of U.S. PPI data yesterday, BTC broke through the key resistance zone at 113,200—opening the path for further gains.
If the price holds steady at current levels, we could see more upside ahead.
Next key targets: 📍 117K 📍 120K 📍 123K
You may find more details in the chart!
Thank you and Good Luck!
❤️PS: Please support with a like or comment if you find this analysis useful for your trading day❤️
