BTCUSDT.3S trade ideas

BTCUSDTThe Bitcoin trend remains bullish and is currently near the identified support level. If the price reaches the zone, it could present a good buying opportunity after confirmation.

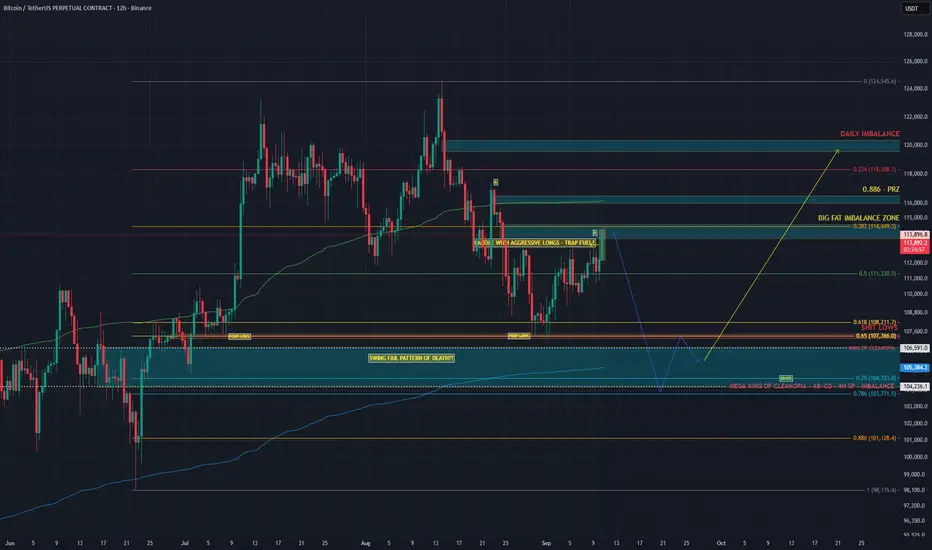
BITCOIN – EXPECT THE UNEXPECTED – SWING FAIL PATTERN OF DEATH ?“Euphoria is the silence before the storm.”
📰 Context
Bitcoin has been grinding slowly upwards since the start of September, reaching the 114,000 zone. On the surface, momentum looks positive — but the underlying data tells a different story.
Retail sentiment is overwhelmingly bullish, with many anticipating rate cuts at the September 16–17 Fed meeting.
However, BTC is currently trading inside a large imbalance zone, right as the market waits for today’s Core CPI release.
Ask most traders and they’ll say, “it goes up.” But when the majority leans one way, risk often lies in the opposite direction.
📉 Facts & Liquidity Landscape
Weekend lows remain unswept.
Weekend structures are weak (thin liquidity, low volume). Markets love to test and run them for stop fuel.
Early July lows still untouched.
These are classic “bad lows” → no excess, too much time spent there. Weak foundation = high probability of a sweep.
Late August / early September lows = same story.
Flat shelves and equal wicks act as magnets.
Markets don’t leave “poop” behind — they sweep it away before moving higher.
CPI risk.
The market is expecting good news. If CPI disappoints, the shock factor could trigger panic → perfect catalyst for a liquidity grab.
📊 CVD, OI & Orderflow Data
Spot CVD (all exchanges): trending down → no aggressive spot buyers, demand missing.
Futures CVD (Stablecoin-margined): building bearish divergences vs price on 1H–4H.
Futures CVD (Coin-margined): same divergence → futures driving the move, not spot.
Open Interest:
Yesterday during NY/CME we saw a cluster of aggressive longs pile in (marked yellow candle).
If price declines from here, those positions become squeeze fuel.
🎯 My Take
Expect a dump into the “Mega King of Cleanopia” zone → sweeping weekend lows + untouched July/Aug/Sept lows.
That grab creates a Swing Fail Pattern (SFP):
Retail shorts get trapped at the bottom.
Market absorbs liquidity.
Squeeze fuel builds for a reversal higher.
⚖️ Bias & Invalidation
Bias: Short-term (until FOMC) bearish liquidity sweep → medium-term bullish if SFP forms.
Upside invalidation: Sustained trade above 114,500.
Downside target for sweep: Lows of July + Aug/Sept cluster → liquidity magnet.
Higher PRZ at the 0.886 - which I marked.
✅ Summary:
BTC looks euphoric on the surface, but the data shows weakness.
No spot demand, perp-driven rally, unswept bad lows below.
CPI could be the trigger: if bad, expect panic → liquidity grab → potential SFP reversal.
Regional & Country-Specific Global Markets1. North America
United States
The U.S. is the world’s largest economy and the beating heart of global finance. It hosts the New York Stock Exchange (NYSE) and NASDAQ, two of the biggest stock exchanges globally. The U.S. dollar serves as the world’s reserve currency, making American financial markets a benchmark for global trade and investment.
Strengths:
Deep and liquid capital markets
Technological innovation hubs (Silicon Valley, Boston, Seattle)
Strong consumer demand and advanced services sector
Risks:
High national debt levels
Political polarization affecting policy stability
Trade tensions with China and other countries
Key industries include technology, healthcare, energy, defense, and finance. U.S. policies on interest rates (through the Federal Reserve) ripple across every global market.
Canada
Canada’s economy is resource-heavy, with strengths in energy (oil sands, natural gas), mining (nickel, copper, uranium), and forestry. Toronto hosts a vibrant financial sector, and Canada’s stable political environment attracts global investors.
Strengths: Natural resources, stable banking sector
Challenges: Heavy reliance on U.S. trade, vulnerability to oil price swings
Mexico
As a bridge between North and Latin America, Mexico has growing manufacturing and automotive industries, heavily integrated with U.S. supply chains (especially under USMCA trade agreement). However, crime, corruption, and political risks remain concerns.
2. Europe
Europe is home to some of the world’s oldest markets and remains a global hub for trade, technology, and finance.
European Union (EU)
The EU is the world’s largest single market, with free movement of goods, people, and capital across 27 member states. The euro is the second-most traded currency globally.
Strengths: High levels of economic integration, advanced infrastructure, strong institutions
Weaknesses: Aging population, energy dependency (especially after the Russia-Ukraine war)
Germany
Germany is the powerhouse of Europe, leading in automobiles, engineering, chemicals, and renewable energy. Frankfurt is a major financial hub.
Opportunities: Transition to green energy, high-tech industries
Risks: Export dependency, demographic challenges
France
France blends industrial strength with luxury, fashion, and tourism industries. Paris is also a growing fintech hub.
United Kingdom
Post-Brexit, the UK operates independently of the EU, but London remains a global financial center. Britain leads in finance, pharmaceuticals, and services.
Eastern Europe
Countries like Poland, Hungary, and Romania are emerging as manufacturing hubs due to lower labor costs, attracting supply chain relocations from Western Europe.
3. Asia-Pacific
Asia-Pacific is the fastest-growing region, driven by China, India, and Southeast Asia.
China
China is the world’s second-largest economy and a manufacturing superpower. It dominates global supply chains in electronics, textiles, and increasingly, electric vehicles and renewable energy.
Strengths: Huge domestic market, government-led industrial policy, global export strength
Challenges: Debt, slowing growth, geopolitical tensions with the U.S.
Markets: Shanghai Stock Exchange, Shenzhen Stock Exchange, and Hong Kong as a global financial hub
India
India is one of the fastest-growing major economies, with strong potential in IT services, pharmaceuticals, digital payments, manufacturing, and renewable energy.
Strengths: Young population, digital transformation, strong services sector
Challenges: Infrastructure gaps, unemployment, bureaucratic hurdles
Markets: NSE and BSE, with rising global investor participation
Japan
Japan has a mature economy with global leadership in automobiles, electronics, and robotics. The Tokyo Stock Exchange is one of the largest in the world.
Strengths: Advanced technology, innovation, strong corporate governance
Challenges: Aging population, deflationary pressures
South Korea
South Korea is a global leader in semiconductors (Samsung, SK Hynix), automobiles (Hyundai, Kia), and consumer electronics. The KOSPI index reflects its market vibrancy.
Southeast Asia
Countries like Vietnam, Thailand, Indonesia, and Malaysia are emerging as new growth centers, benefiting from supply chain shifts away from China.
Vietnam: Manufacturing hub for electronics and textiles
Indonesia: Rich in resources like nickel (critical for EV batteries)
Singapore: Leading global financial and logistics hub
4. Latin America
Latin America’s markets are resource-driven but often volatile due to political instability and inflation.
Brazil
The largest economy in Latin America, Brazil is a major exporter of soybeans, coffee, iron ore, and oil. It also has a growing fintech and digital economy sector.
Argentina
Argentina struggles with recurring debt crises and inflation, but it has strong potential in lithium reserves, agriculture, and energy.
Chile & Peru
Both are resource-rich, particularly in copper and lithium, making them crucial for the global clean energy transition.
Mexico
(Already covered under North America, but plays a dual role in Latin America too.)
5. Middle East
The Middle East’s economies are largely oil-driven, but diversification is underway.
Saudi Arabia
Through Vision 2030, Saudi Arabia is reducing reliance on oil by investing in tourism, renewable energy, and technology. The Tadawul exchange is gaining global importance.
United Arab Emirates (UAE)
Dubai and Abu Dhabi are major global hubs for trade, logistics, and finance. Dubai International Financial Centre (DIFC) attracts global capital.
Qatar & Kuwait
Strong in natural gas exports and sovereign wealth investments.
Israel
Israel is a “startup nation,” leading in cybersecurity, AI, fintech, and biotech. Tel Aviv has a vibrant capital market.
6. Africa
Africa is rich in natural resources but has underdeveloped capital markets. Still, its youthful population and growing middle class present opportunities.
South Africa
The most advanced African economy with a diversified market in mining, finance, and retail. The Johannesburg Stock Exchange (JSE) is the continent’s largest.
Nigeria
Africa’s largest economy, dependent on oil exports, but also growing in fintech (mobile payments, digital banking).
Kenya
A leader in mobile money innovation (M-Pesa) and a gateway to East Africa.
Egypt
Strategically located, with a mix of energy, tourism, and agriculture. Cairo plays an important role in the region’s finance.
Opportunities & Risks Across Regions
Opportunities
Emerging markets (India, Vietnam, Nigeria) offer high growth potential.
Green energy and digital transformation create cross-border investment avenues.
Regional trade blocs (EU, ASEAN, USMCA, AfCFTA) enhance integration.
Risks
Geopolitical conflicts (Russia-Ukraine, U.S.-China tensions)
Currency fluctuations and debt crises in emerging markets
Climate change disrupting agriculture and infrastructure
Inflation and interest rate volatility
Conclusion
Regional and country-specific global markets together form the backbone of the international economic system. While North America and Europe remain financial powerhouses, Asia-Pacific is the fastest-growing engine, the Middle East is transforming from oil dependency to diversification, Latin America is leveraging its resources, and Africa stands as the future growth frontier.
For investors and businesses, the key lies in understanding the unique strengths, weaknesses, and risks of each market while recognizing their global interconnectedness. The future will likely see more multipolarity—where not just the U.S. and Europe, but also China, India, and regional blocs shape the course of the global economy.

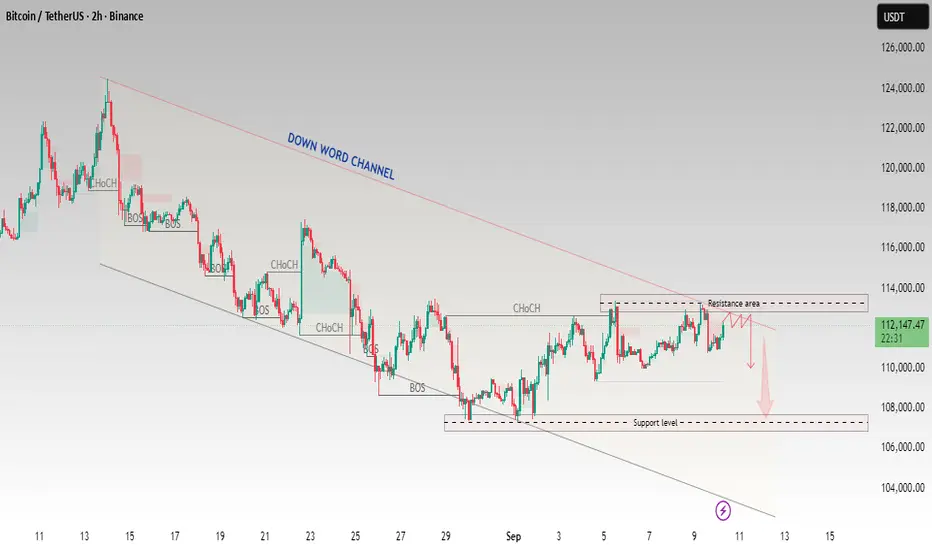
Bitcoin(BTCUSDT)–ResistanceRejection Setup|DownChannel structureBitcoin (BTCUSDT) is still respecting its downward channel structure, with multiple CHoCH (Change of Character) and BOS (Break of Structure) signals along the way.
Resistance Zone: 113,500 – 114,000
Support Zone: 107,500 – 108,000
Price is currently trading around 112,226, just below the resistance area. If sellers step in strongly, a rejection could drive price back down toward the support zone.
A sustained breakout above resistance would invalidate this short-term bearish outlook.
Watch for rejection patterns around resistance before taking entries.
Bearish continuation is valid only if the channel remains intact.
Always apply proper risk management and stop-loss levels.
This analysis is for educational purposes only. It is not financial advice. Please do your own research before making any trading decisions.
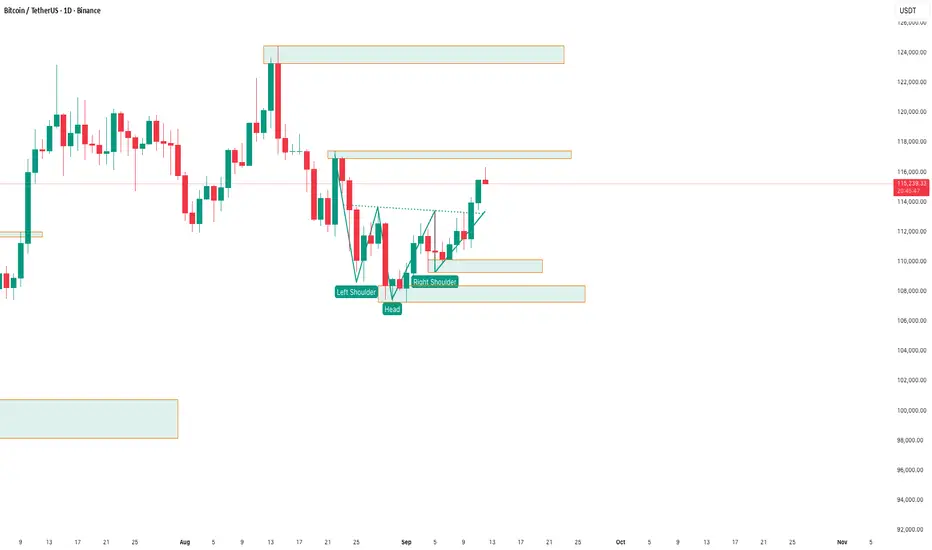
Bitcoin Daily- Inverse Head & Shoulders In Play ?BTC just formed a potential Inverse Head & Shoulders (H&S) on the daily chart 👀.
The neckline has been tested and bulls are trying to push above 🚀.
If this breakout holds, we could see momentum toward the $116K–118K zone 🔑. But if sellers step back in, it might turn into a fakeout ⚠️.
For now, price action looks like buyers are gaining confidence again 💪.
👉 Not financial advice, just sharing my view. What’s your take — breakout or fakeout? 🤔
BTC will hit 116500 , then fall to 100kElliott Wave analysis shows that Bitcoin has started its corrective wave 4. Usually, Elliott Wave 4 is a broad wave and records a lot of fluctuations in its path. My prediction is that Bitcoin can grow to the 116500 range and then continue its downward trend to 100k. I would be happy if you like it so that we can continue with more strength.

31-08-2025 BTCUSDTThe market is not always chaotic and disorderly, and there is a precise geometric beauty hidden in price fluctuations. The harmonic form long strategy is a powerful tool for accurately identifying potential market reversal points based on the Fibonacci ratio. When the form forms perfectly at the key support level, it often indicates the depletion of bearish momentum and the initiation of bullish trends.
As shown in the figure: 1D Bullish Cypher

Btcusdt Cme futures filled the gap perfectly at 16600 . Overbought now I think btc retraces from here until next week when fed lowers rates .

BITCOIN BITCOIN IS HEADING up this time gains could exceed 128k based on the free market structure .
the demand floor was correct and so will the supply roof .
my sell zone will be around 128k and 130k or more .daily break of supply roof after the retest we are going to the moon.
#bitcoin #btcusdt #btc #crypto

BTC/USDT Another Impulse-Shift?Here, price tapped the prior bearish FVG (red box).
Instead of breaking lower, it rejected → confirming that FVG as “consumed.”
Price then created a fresh bullish FVG (green box) on the move away.
This shift signals a potential change in order flow: bearish leg → bullish continuation.
As long as price respects the bottom of the new green FVG, bullish bias remains valid.
If it holds - on the new daily look on the 1HR time-frame for an entry: A respected 1HR FVG.
If the FVG closes This chart is void.

BITCOIN BITCOIN IS HEADING up this time gains could exceed 128k based on the free market structure .
the demand floor was correct and so will the supply roof .
my sell zone will be around 128k and 130k or more .daily break of supply roof after the retest we are going to the moon.
#bitcoin #btcusdt #btc #crypto

BTC/USDT Short Trade Setup📉 BTC/USDT Short Trade Setup 📉
🔹 Entry Price: $114,632
🔹 Targets:
TP1 → $113,900
TP2 → $113,250
TP3 → $112,400
🔹 Stop Loss (SL): $115,450
🔹 Leverage: 25x–50x (trade safe, don’t over-leverage)
📊 Analysis:
Bitcoin has hit a key resistance zone around $114,600–$114,800. Multiple rejections on the chart suggest a potential pullback is near. If the bearish momentum confirms, BTC could retrace toward the $112,400 support zone.
⚠️ Risk Management Tip: Always use SL to avoid liquidation. Remember, smart trading is about consistency, not chasing every move.
💬 What do you think — will BTC reject from here or surprise us with another breakout? Share your views below!
CRYPTOCAP:BTC
#BTC #Bitcoin #CryptoTrading #ShortTrade #TradingView #BinanceFutures

Is BTC at the end of its bullish cycle?As can be seen in Figure 1.1, BTC exhibits an extremely clear behavioral pattern, showing a mean reversion, specifically toward the trend line on the weekly chart.
On the other hand, a bearish divergence in the MACD reveals the weakness and lack of interest currently prevailing, which supports the hypothesis of a likely correction.
Figure 1.1
On the daily chart, I show how a modified Ichimoku indicator also reveals a behavioral pattern (Figure 1.2). I projected what I believe could happen: I think the price, as it has done before, could rise strongly, possibly even surpassing the previous high, before correcting to $100,000.
Figure 1.2
Is this the end of the bullish cycle?
USDT Dominance (USDT.D)
USDT dominance (USDT.D) is an indicator that measures the percentage of Tether’s market capitalization relative to the total capitalization of the entire cryptocurrency market. This indicator is fundamental because it provides a relative figure that, unlike absolute market capitalization, offers context for comparing USDT’s influence within the entire ecosystem.
The most conventional and widely accepted interpretation of USDT dominance is that it maintains an inverse correlation with the price of volatile crypto assets, particularly Bitcoin (BTC). When investors experience fear or uncertainty, they tend to sell their risky assets (such as BTC) to move their capital to a safe haven that retains its value. USDT, with its parity to the dollar, is the quintessential destination for this capital. Therefore, an increase in USDT dominance is commonly associated with a drop in BTC’s price and a bearish market sentiment. The USDT.D chart moves in the opposite direction to the price charts of major assets, acting as a barometer of risk aversion.
What does USDT dominance indicate?
As can be observed in Figure 1.3 on a weekly USDT.D chart, we are witnessing the formation of a triple bottom, a classic and highly effective pattern in the appropriate context.
If, as this reading suggests, dominance increases, there is no doubt that BTC will reach $100,000, in line with our previous analysis.
Figure 1.3
Will BTC consolidate and continue to rise?
It is highly likely that USDT dominance will result in a continued increase once the triple bottom formation is fully established, which would align with the end of BTC’s bullish cycle.
A significant correction could lead to BTC losing up to 50% of its value.

Bitcoin - The Whales are Selling at This Strong Resistance 115K$BTC Current Market Update
The coin is now facing a very strong resistance around $115K .
This presents a great short opportunity .
After carefully monitoring buy and sell orders on-chain, I noticed a strong confirmation for the short setup:
Whales and Market Makers sell orders are clustered heavily around the 115,000 resistance zone.
✅ My Personal Strategy:
Short Entry: 115,000
🎯 Target 1: 114,000
🎯 Target 2: 113,600
Please note:
This is not financial advice – I’m only sharing my personal trades.
Always do your own research before taking action.
👍 Don’t forget to like if you found this useful, and feel free to follow me for more analysis of this kind.
Best of luck 🌹

BTC - The Head and Shoulders of the Year?Bitcoin is shaping one of the most powerful reversal patterns traders could ask for: the inverse head and shoulders. After holding the ascending channel’s lower bound and bouncing from the key structure zone, BTC is signaling that bulls may soon take over.
Here’s what stands out on the chart:
🟢 Bullish Channel: Price continues to respect the rising channel, maintaining its long-term bullish outlook.
🛡️ Structure Zone: The $110,000 – $113,000 region is acting as a crucial pivot, flipping from support to resistance.
🔄 Inverse Head and Shoulders: A textbook reversal setup is forming, with the neckline aligning perfectly with structure.
🚀 Bullish Breakout: A confirmed break above this neckline could trigger the next major impulse move, putting BTC back on track toward higher channel targets.
Bulls need a clean daily close above the neckline for full confirmation — until then, the setup is in play but not yet validated.
📌 Will this become the pattern of the year that propels Bitcoin to new highs?
This is for educational purposes only, not financial advice. Always manage your risk before entering any trade.
📚 Stick to your trading plan regarding entries, risk management, and trade execution.
Good luck!
All Strategies Are Good; If Managed Properly!
~Richard Nasr

BTCUSDT Long-Term Swing Setup: Key Supports to WatchBitcoin is consolidating above the $114,000 level, showing resilience after its latest pullback. The broader structure remains bullish as long as higher lows and the ascending trendline hold. Key supports below will be critical in determining whether buyers can sustain momentum or whether a deeper correction unfolds.
🔍 Technical Analysis
Current price: $114,405 (Binance Perpetual).
Price has bounced from recent lows and is attempting to reestablish upside momentum.
The long-term ascending trendline continues to guide bullish structure.
Strong demand zones remain layered below price action.
🛡️ Support Zones (if pullback occurs):
🟢 $101,412 – 1H Support (Semi-Risky Trade)
First reaction level, suitable for intraday setups.
Stop-loss: Below $97,802
🟡 $85,210 – Daily Support
A major base of demand, critical for maintaining broader structure.
Stop-loss: Below $83,701
🟠 $69,887 – Last 4H Support (Protected by Daily)
Long-term structural support and high-conviction entry zone.
Stop-loss: Below $68,614
🔼 Resistance Levels:
Immediate resistance: $116,000
Break above → continuation toward $120,000 psychological level.
🧭 Outlook
Bullish Case: Price sustains above $114,000 and pushes past $116,000 → opens the door to retest $120,000+.
Bearish Case: Break below $101,412 → correction into $85,210. Losing this zone exposes $70,000.
Bias: Bullish while above $101,412 and long-term trendline holds.
🌍 Fundamental Insight
Bitcoin remains supported by expectations of rate cuts, weakening USD momentum, and continued institutional adoption. However, macro risks (global liquidity, regulation, or risk-off sentiment) could add volatility, especially if equities face broader pressure.
✅ Conclusion
BTCUSDT remains structurally bullish above $114,000, with demand stacked across multiple support zones. Bulls aim for a push toward $120,000, but a break below $101,412 could trigger a deeper correction toward $85,210.
⚠️ Disclaimer
This analysis is for educational purposes only and does not constitute financial, investment, or trading advice.

Bitcoin Correction or Trap? What’s Next for BTCBitcoin Correction or Trap? What’s Next for BTC
📊 Bitcoin Market Analysis (BTC/USDT)
🔹 Fundamental Outlook
Macro Environment
Global liquidity conditions remain a key driver for Bitcoin. With central banks signaling slower tightening and some economies leaning toward easing, risk assets like crypto gain renewed interest. This keeps institutional flows active, even amid volatility.
Investor Sentiment
Market confidence has been mixed—recent ETF inflows show strong long-term positioning, while short-term traders are exiting positions due to price uncertainty. This dual behavior creates volatility but underscores Bitcoin’s sustained appeal as a hedge against inflation and monetary instability.
Adoption & Regulation
Ongoing regulatory clarity in major regions (U.S., EU, Asia) adds both challenges and opportunities. While restrictions dampen speculative activity in some markets, clearer frameworks are encouraging institutional adoption.
🔹 Technical Outlook
Trend Observation
The chart shows a prior bullish impulse followed by a sustained corrective phase. Momentum has clearly shifted from strong upward pressure to a controlled decline, suggesting a cycle rotation is in play.
Market Structure
Recent price action highlights break-of-structure events on the downside, reflecting that sellers temporarily dominate. However, consolidation phases are appearing, often precursors to volatility expansion.
Momentum & Volume
Declining volume on the latest drops suggests that selling pressure may be losing strength. This opens the probability for accumulation at lower price zones before the next directional move.
Possible Scenarios
Short-term weakness: Further decline is possible as the market continues to seek liquidity.
Medium-term recovery: If macro tailwinds (liquidity injections, ETF demand, weaker USD) persist, Bitcoin may reattempt a bullish cycle once accumulation is complete.

BTC- WEEKLY OUTLOOK; ON POINT#BTC- Weekly Outlook
On point again with the levels! ✅
I'm closely watching the $115,700- $116,000 resistance zone for price reaction.
The next major move will likely be shaped here; bullish breakout or rejection.
Key levels to monitor:
$120,000 (Major resistance)
$116,000 (Current resistance zone)
$110,000
$107,000
$104,000
$100,000 - (Psychological key support)
$98,000
$94,000
Let’s see if bulls can push through or if a deeper correction is next! Stay sharp and always manage your risk.

#BTCUSDTBitcoin Technical Analysis:
The next target for Bitcoin is expected to be around $147,000 (the next channel ceiling).
Dynamic resistances and supports are drawn.
Static support is around $97,000.

BTC/USDT Analysis. Approaching Resistance
Hello everyone! This is a trader-analyst from CryptoRobotics, and here’s the daily analysis.
Yesterday, Bitcoin tested the pushing volumes zone at $113,700–$113,000, showed a reaction, and then fully reached the resistance area at $114,400–$115,500 (volume zone).
The first wave of selling was rather weak. Trading volumes increased at the moment, with buyers holding the upper hand. The newly formed volume zone at $114,300–$113,700 was absorbed by market buyers, which locally suggests the potential for further upward movement.
However, the fact that price is currently within a sell zone, combined with weak updates of local highs, points to a high probability of a notable correction. Thus, even this absorption could turn out to be another bull trap.
Buy Zones:
$114,300–$113,700 (market sell absorption)
$111,600–$110,500 (accumulated volumes)
~$108,400 (cluster anomalies)
$108,000–$102,500 (accumulated volumes)
Sell Zones:
$114,400–$115,500 (volume zone)
~$116,500 (volume anomaly)
$117,200–$119,000 (accumulated volumes)
$121,200–$122,200 (buy absorption)
This publication does not constitute financial advice.

#BTC/USDT Bullish Divergence on 1H, Low Risk Trade#BTC
The price is moving within a descending channel on the 1-hour frame, adhering well to it, and is heading for a strong breakout and retest.
We have a bearish trend on the RSI indicator that is about to be broken and retested, which supports the upward breakout.
There is a major support area in green at 0.0, representing a strong support point.
For inquiries, please leave a comment.
We are in a consolidation trend above the 100 Moving Average.
Entry price: 112090
First target: 112177
Second target: 113111
Third target: 113963
Don't forget a simple matter: capital management.
When you reach the first target, save some money and then change your stop-loss order to an entry order.
For inquiries, please leave a comment.
Thank you.

$BTC retesting support.CRYPTOCAP:BTC will be retesting support which was resistance previously will be looking by sitting outside of market and analyzing the trade if a good long will exist along with volume coming in i will post again over my CMC and X.
This is the current scenerio.
