BTCUSDT 4HBTC Update – Inverse Head & Shoulders in focus
On the 4H chart, a clear Inverse Head & Shoulders pattern has formed.
The neckline has already been tested and broken to the upside – a classic bullish signal.
📊 Key Levels:
Support zone: $111,193 – $110,500 (right shoulder area)
First realistic target: 200 EMA at $112,744
Next level: Break above $113,500 → potential to close the CME Gap at $116,887
Target zone based on iH&S: around $117,000 → Premium target in the yellow box: $117,841 – $119,900
⚠️ Risk:
If BTC falls below the right shoulder (~$109,200), the pattern becomes invalid, increasing the likelihood of another dip towards 107k – 105k.
✅ My View:
As long as BTC holds above 110–111k, the setup remains strongly bullish. A retest of the neckline would even be healthy before the next push upward."
BTCUSDT.3S trade ideas

Bitcoin (BTC): Eyes on Middle Line of Bollinger Bands | BounceSeptember has started pretty bullish, with buyers managing to secure the bullish weekly candle last week, when we bounced from the middle line of the Bollinger Bands.
The game plan remains the same for us here; we are treating each dip like a fire sale and a better entry for the upcoming bullish movement that we are expecting!
Swallow Academy

Analytics: Market outlook and forecasts
📈 WHAT HAPPENED?
Last week, Bitcoin reached the first sell zone at $112,400-$113,300 (local volume zone), from which we’ve already received a reaction twice.
During the last test of this zone, a large volume was formed, which was positioned in short. This indicates the potential for a decline to the level of $108,000. On the other hand, the untested liquidity beyond the $113,500 level suggests the opposite and acts as a "magnet" for the price.
Currently, we’re trading within a local range where market sales are being absorbed.
💼 WHAT WILL HAPPEN: OR NOT?
We anticipate a move towards the new zone of $112,200-$113,200 (volume zone), from which a short-term movement is likely to develop if there is a reaction.
The opposite scenario is a strong breakout of this zone during buyer activity. In this case, a test of the $114,400-$115,500 zone (volume zone) and the ~$116,500 level (volume anomaly) is likely.
In this scenario, the $112,200-$113,200 marks will become a mirror volume support zone, and the global long trend will resume.
Buy Zones:
$108,000–$102,500 (accumulated volumes)
Sell Zones:
$112,200–$113,200 (volume zone)
$114,400–$115,500 (volume zone)
~$116,500 (volume anomaly)
$117,200–$119,000 (accumulated volumes)
$121,200–$122,200 (buy absorption)
📰 IMPORTANT DATES
Macroeconomic events this week:
• September 10, Wednesday, 12:30 (UTC) - publication of the US Producer Price Index (PPI) for August;
• September 11, Thursday, 12:15 (UTC) - announcement of the Eurozone deposit rate for September and the Eurozone interest rate decision;
• September 11, Thursday, 12:30 (UTC) — publication of the US basic consumer price index and the number of initial jobless claims for August;
• September 11, Thursday, 12:45 (UTC) — press conference of the European Central Bank (ECB);
• September 12, Friday, 6:00 (UTC) — publication of the UK GDP for July and the German consumer price index for August.
*This post is not a financial recommendation. Make decisions based on your own experience.
#analytics

#BITCOIN - Weekly Price outlook #BITCOIN - Weekly Price outlook
Following my previous weekly outlook perfectly! 🔥
🔸Weekly/Daily: Neutral
🔸Monthly: Bullish trend
⚡️ Likely just a pause before a new ATH breakout!
Bullish as long as we hold $109,500–$110,000.#Alts market did exactly what we expected!
Key Levels:
🟢 Bullish above: $109,500–$110,000
🟡 Neutral zones: $110,000–$116,000 & $110,000–$107,000
🔴 Bearish: D1 close below $107,000 = open gap to $100,000 and possibly $94,000
Next targets:
$115,600–$116,000 resistance 🎯
A clean breakout above $116,000/$120,000 could fuel further gains (medium term).
⚠️ Bearish scenario:
Strong rejection at $116,000 or D1 close under $107,000.
(I don’t share all charts here.)

08/09/25 Weekly OutlookIt's CPI week is here once again, which means we're one week before FOMC and a likely interest rate cut by the FED, maybe the last week of choppy sideways action before the next leg up in Q4?
Last week BTC stopped just shy of the weekly high before settling around midpoint. Bullish structure throughout the week from start to finish reclaiming much of the losses from the week previous to that. As I have pointed out in the past late August & early September have historically poor returns and so far this year has followed the trend, down -13.6% from the highs of mid August.
All of this is to say the stars seem to be aligning once again for a repeat of previous cycles, a slow and negative August into September, print a local bottom and the next leg up/continuation higher in Q4 boosted by cheaper borrowing. There is even a growing chance of a 50bps cut on September 17th which would really fuel a risk-on surge going into the end of the year.
For this week I'm not overly concerned about CPI just because I believe the focus is on FOMC the week after. A reclaim of $113,500 before this weeks close may kickstart an earlier push by the bulls as currently that is the level keeping BTC down.
$104,500 is the 1D 200 EMA, a level untested since April, A retest as support before FOMC would be a great place to go long from IMO. Until either of those scenarios play out it's just noise and chop.
Good luck this week everybody!

Bitcoin BTC Trend Shift: Watching for a Break (BoS) Confirmation🚀 Bitcoin (BTC) Update 🚀
Bitcoin has made a bullish move 🟢📈, showing a clear structural shift to the upside 🔄 on the 4H chart ⏰. My bias remains bullish ✅, but with a degree of caution ⚠️.
What I want to see next is a decisive break above the previous swing high 📍📊 — this would confirm a true break of structure (BOS) 🔓 versus the current stage, which is only a structural shift 🔄.
⚠️ This analysis is educational only and not financial advice. 📚

#BTCUSDT 2H ChartPrice was ranging between the 100MA and the 200MA which it is currently breaking through. MACD is bullish, RSI is bought and EMAs are turning bullish as well. As a short-term target, price is expected to tap and trade into the minor supply zone at around $112.5k, but overall, it is expected to reach the next supply zone at around $114.4k.

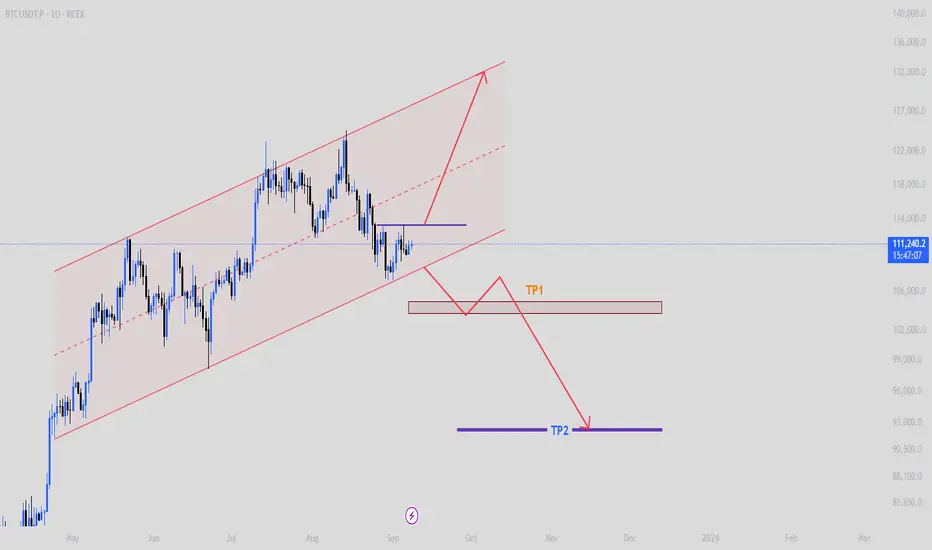
BTCUSDTThe chart is in a situation where it is impossible to decide, but two cases occur: if the channel breaks through the bottom, the targets are TP1 and TP2. Otherwise, we enter in the direction of price growth after breaking through the top.
Buy SETUPBTC just made a retracement to a weekly flipzone, respected the zone and about to bounce back and make a higher high to make Another all time high

Bitcoin Go 27000Bitcoin is in a bullish corner and if it breaks, it will move towards 27000
Only sell market sellllll

Lingrid | BTCUSDT Bottom Pattern Complete - Long Opportunity?BINANCE:BTCUSDT broke above a corrective channel after multiple rejections near the support zone. The chart shows a descending structure with repeated lower highs and lows, guided by the downward trendline. However price broke and closed above it. the market potentially bottomed around $108,000 support level. As long as price holds this support, a rebound toward $117,300 becomes the next potential move. The broader picture suggests a retest of resistance if momentum shifts upward from the current zone.
📉 Key Levels
Buy trigger: Hold above $110,000 support
Buy zone: $108,000–$110,000 accumulation area
Target: $117,300 resistance zone
Invalidation: Breakdown below $108,000
💡 Risks
Failure to hold $108,000 support could trigger deeper losses.
Macroeconomic factors (Fed rate decisions, inflation data) may pressure sentiment.
Sustained strength in the dollar index could cap bullish continuation.
If this idea resonates with you or you have your own opinion, traders, hit the comments. I’m excited to read your thoughts!

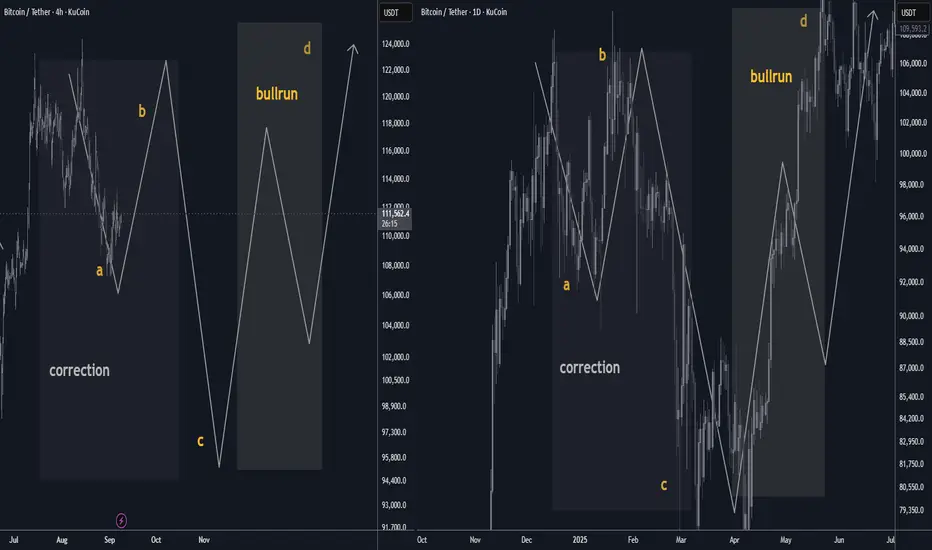
Bitcoin September 2025 Outlook: a/b/c price fractal structureBTC enters September post-ATH with a seasonal headwind. Base case: a ~10% A-leg dip toward $108k, a B-bounce into ~$122k, then a C-flush near ~$94k—echoing April’s ABC rhythm. Once complete, the uptrend should re-assert into year-end. 📉🔁📈 #Bitcoin #Seasonality #Crypto
🟠 Bitcoin September Outlook: Seasonality vs. Structure
After a fresh ATH, September’s historical bias skews mildly red. Base case is a ~10% A-leg dip that develops into an A/B/C correction before trend continuation. Think controlled pullback → consolidation → next markup. 📉➡️🔁➡️📈
________________________________________
🗓️ Seasonality Snapshot (2015–2024)
• Mean (10-yr): −2.55% · Median: −4.52%
• Red months: 6/10
• Worst September: 2019 (−13.88%)
• Best September: 2024 (+7.39%)
• Last 3 yrs avg: +2.8% (2024 +7.39%, 2023 +3.99%, 2022 −3.09%)
• Last 5 yrs avg (2020–2024): −1.3%
Read: September has tended to be weak, but the last two years printed green. Seasonality is a headwind—not a handbrake. 🌬️
________________________________________
🧩 Structure Thesis (Fractal Analog)
You’re looking for a repeat of April 2025’s A/B/C rhythm—scaled up:
• April 2025 reference: A ≈ $92k → B ≈ $106k → C ≈ $80k
• Now (projected):
o A ≈ $108k (≈ 10% pullback from recent highs) 📉
o B ≈ $122k (relief rally / lower high) 🔁
o C ≈ $94k (final flush into demand, completing the correction) 🧱
Interpretation: A measured September fade aligns with the A-leg. A reflexive B-bounce can follow as funding resets and late longs get cleaned up, with a C-leg completing the pattern before the next expansion. 🚀
________________________________________
📊 How Seasonality Supports the Call
• Typical drag: Median −4.5% and multiple red Septembers justify a down-bias.
• Volatility window: The historical 21-point spread (best +7.39% vs worst −13.88%) means a 10% dip sits well within normal bounds.
• Cycle context: With a new ATH just printed, a shallow corrective phase is constructive—not bearish regime change.
________________________________________
🧭 Levels & Triggers
• Bias line: Momentum cools into $108k → watch for seller absorption and open interest reset.
• Relief cap: $122k acts as B-rally resistance; sustained closes above $122k would invalidate the ABC idea and argue for immediate continuation. ✅
• Completion zone: $94k (C) is the buy-the-dip completion area; clean breaks below raise risk of a deeper time correction rather than a swift V-reversal. ⚠️
________________________________________
🧪 What to Monitor (Confirmation/Invalidation)
• Liquidity & OI: De-leveraging into A, controlled OI rebuild into B, washout into C.
• Spot-ETF flows / stablecoin issuance: Weakening into A, stabilizing by late month supports B→C rhythm.
• Funding/basis: Overheated → normalize during A; negative spikes near C often mark capitulation.
• Breadth (alts): Underperform into A/C; broad risk-on breadth usually returns post-C.
________________________________________
📝 Base Case Path (Textbook)
September: drift to $108k (A) → bounce toward $122k (B) → final tag of ~$94k (C) → reset + markup into Q4.
(If price reclaims and holds above $122k early, treat that as trend continuation—not a correction.)
________________________________________
🔒 Risk Notes
• Seasonality is a tendency, not a rule. Macro catalysts (CPI, policy, liquidity) can dominate calendar effects.
• This is market commentary, not financial advice. Manage risk and invalidation levels. 🛡️
Bitcoin Targets $116K or $104K Post-CPIMy main bias is to the upside, expecting more upward movement, contingent on holding $104,770. The upcoming CPI data is the key catalyst. On the 4-hour chart, a break above $111,721 targets $116,722, while a break below $109,464 targets the key support zone at $104,777.

Bitcoin Is Hiding Something BIG (Target Revealed)In Episode 17 of my Bitcoin daily analysis , we just hit a +2.3% gain from the last long trigger, and now BTC is pressing against a critical resistance. If this level breaks with volume, the next +2.7% move could be right around the corner.
In this video, I’ll break Bitcoin down across weekly, daily, and 4H timeframes to show you:
Why this resistance is so important 🔑
How I set my next upside target step by step
The role of volume, BTC dominance, and TOTAL2/TOTAL3 in confirming moves
Whether altcoins (like ETH and SOL) are about to outperform Bitcoin
❌ Don’t FOMO.
✅ Stick to risk management.
✅ Trade your plan, not your emotions.
If you found this analysis helpful, share it with your trading friends and let’s grow smarter together.

BTC/USDT 4hour chart update !! BTC/USDT
Downtrend Channel Broken
Bitcoin was moving inside a descending channel (highlighted).
The price has now broken above the channel, indicating a potential trend reversal from bearish to bullish.
Support Zone
The green area around $107,000 – $108,000 acted as strong demand/support.
BTC bounced sharply from this zone, confirming that buyers stepped in.
50 Red MA (short-term) → Recently crossed above price, but BTC reclaimed it, turning it into support.
200 Green MA (long-term) → Sitting around $114,000, which may act as the next resistance.
Trendline Support
An ascending trendline (black) is holding current price action.
As long as BTC respects this line, the short-term outlook remains bullish.
Resistance: $114,000 (200 MA zone) → first big hurdle.
Higher target: $118,000 – $120,000 if momentum continues.
Support: $110,000 (trendline) and $108,000 (demand zone).
📈 Outlook
Bullish bias as long as BTC holds above $110,000 support/trendline.
A break above $114,000 could trigger a push towards $118K – $120K.
If BTC loses $110K, risk of retesting $107K – $108K support zone.
DYOR | NFA

Global Hard Commodity Trading1. Understanding Hard Commodities
Hard commodities are natural resources that must be mined, extracted, or produced through industrial processes. They are different from soft commodities, which include agricultural products like wheat, coffee, or cotton.
Examples of Hard Commodities:
Energy Commodities
Crude Oil (Brent, WTI)
Natural Gas
Coal
Uranium
Metals
Precious Metals: Gold, Silver, Platinum, Palladium
Base Metals: Copper, Aluminum, Zinc, Nickel, Lead, Tin
Rare Earth Elements (used in electronics, EVs, clean tech)
Characteristics of Hard Commodities:
Limited in supply, extracted from earth.
Prices are volatile, influenced by global demand and supply shocks.
Traded both physically and financially.
Often priced in US dollars, making them linked to global currency fluctuations.
Hard commodities are critical for energy, manufacturing, construction, defense, and technology sectors, making them a barometer of global economic health.
2. Evolution of Global Hard Commodity Trading
Commodity trading is not new—it dates back thousands of years when civilizations bartered metals, salt, and oil. However, the modern commodity trading system began in the 19th and 20th centuries with the rise of commodity exchanges like the Chicago Mercantile Exchange (CME) and the London Metal Exchange (LME).
Historical Milestones:
19th century: Industrial revolution created huge demand for coal, iron, and copper.
1900s: Oil became the world’s most important energy commodity.
1970s oil shocks: Highlighted the geopolitical importance of commodities.
2000s commodity super-cycle: Rapid demand from China and India fueled a massive rise in metal and energy prices.
Today: Hard commodities are not just traded physically but also heavily speculated on global futures markets.
3. Key Players in Hard Commodity Trading
Trading hard commodities involves a diverse range of participants:
Producers:
Oil companies (ExxonMobil, Saudi Aramco, BP)
Mining giants (Rio Tinto, BHP, Glencore)
Consumers:
Manufacturing companies, refineries, power plants, automakers, construction firms.
Traders & Intermediaries:
Global commodity trading houses like Vitol, Trafigura, Glencore, Gunvor.
These firms buy commodities from producers and sell them to consumers worldwide, often handling logistics, shipping, and financing.
Financial Institutions:
Investment banks (Goldman Sachs, JPMorgan, Morgan Stanley) actively trade in commodity derivatives.
Speculators & Investors:
Hedge funds, mutual funds, and retail traders participate in futures and ETFs for profit.
Governments & Regulators:
OPEC, IEA, WTO, and national regulators influence prices and rules.
4. Major Hard Commodity Markets
4.1 Energy Commodities
Crude Oil: Most traded commodity globally. Benchmarks: Brent (North Sea), WTI (US), Dubai/Oman.
Natural Gas: Key for heating, power generation, and industrial use. LNG (liquefied natural gas) has made gas a global trade.
Coal: Despite clean energy trends, coal still accounts for a major share of electricity generation in Asia.
Uranium: Fuels nuclear energy.
4.2 Metals
Gold & Silver: Precious metals for investment and jewelry. Also safe-haven assets during crises.
Copper: Known as “Dr. Copper” because it signals global economic health—widely used in construction and electronics.
Aluminum, Nickel, Zinc: Critical for cars, infrastructure, and batteries.
Rare Earths: Essential for EVs, wind turbines, semiconductors.
5. How Hard Commodities are Traded
5.1 Physical Trading
This involves the actual movement of goods—oil tankers, copper shipments, coal cargoes. Large trading houses dominate this space, dealing with storage, shipping, and financing.
5.2 Financial Trading
Financial markets allow traders to speculate, hedge, or invest without handling physical goods.
Futures Contracts (CME, LME, ICE)
Options & Swaps
Exchange-Traded Funds (ETFs) linked to commodities
Over-the-Counter (OTC) Derivatives
For example, an airline may hedge jet fuel prices through futures to lock in costs.
6. Price Drivers in Hard Commodity Trading
Hard commodity prices are influenced by a mix of economic, political, and natural factors:
Supply & Demand:
Strong global growth → higher demand for oil, metals.
Supply disruptions (strikes, wars, sanctions) → price spikes.
Geopolitics:
Middle East tensions → oil shocks.
Trade wars → disrupt commodity flows.
Currency Movements:
Most commodities priced in USD. A strong dollar makes them expensive for other countries.
Speculation & Investor Flows:
Hedge funds and ETFs influence short-term price swings.
Technological & Environmental Factors:
EV demand boosts lithium, cobalt, nickel.
Green energy transition reducing coal demand.
Natural Events:
Hurricanes disrupting oil production.
Mining accidents reducing metal supply.
7. Risks in Hard Commodity Trading
Price Volatility: Sharp swings make profits uncertain.
Political Risk: Sanctions, wars, and nationalization.
Credit Risk: Default by counterparties.
Logistics Risk: Shipping delays, storage costs.
Regulatory Risk: Changing government rules.
Environmental Risk: Climate policies reducing fossil fuel demand.
Traders use hedging strategies and risk management tools to minimize exposure.
8. Global Trade Hubs & Exchanges
London Metal Exchange (LME): Key center for base metals.
New York Mercantile Exchange (NYMEX): Crude oil, natural gas.
Intercontinental Exchange (ICE): Brent crude, energy futures.
Shanghai Futures Exchange (SHFE): China’s growing influence.
Dubai Mercantile Exchange (DME): Oil contracts for Middle East & Asia.
Physical hubs include Rotterdam (oil), Singapore (oil & LNG), Shanghai (metals), Dubai (gold).
9. Role of Technology in Hard Commodity Trading
Technology is transforming commodity trading:
AI & Algorithms for price forecasting.
Blockchain for trade finance and supply chain transparency.
Big Data & IoT to track shipments and consumption trends.
Digital platforms replacing traditional paper-based contracts.
10. Future of Hard Commodity Trading
Energy Transition:
Demand for oil may peak in coming decades.
Growth in renewables and metals like lithium, cobalt, nickel.
Green Commodities:
Carbon credits becoming tradable assets.
ESG (Environmental, Social, Governance) shaping investment choices.
China & India’s Role:
Asia will remain the biggest consumer of hard commodities.
Geopolitical Fragmentation:
Sanctions, supply chain shifts, and regional alliances may create “commodity blocs.”
Digitalization:
More algorithm-driven and blockchain-powered commodity trading.
Conclusion
Global hard commodity trading is more than just an economic activity—it is the heartbeat of the world economy. Energy, metals, and minerals not only determine industrial growth but also shape geopolitics, financial markets, and future technologies.
While the industry faces challenges of volatility, climate change, and regulatory shifts, it is also evolving rapidly with digitalization, green energy, and new demand sources.
For traders, investors, and policymakers alike, understanding hard commodity markets is essential—not just to profit, but also to anticipate global economic and political shifts.

As expected, the resistance at 112,000 is very strongThese bears have become so powerful that it is hard to believe that this resistance of 112,000 could be the beginning of a price barrier and an upward move... If the bears can really push the bulls back one step in this race, where do you think that next step will be?

Bitcoin long to $12500 right nowJust now opened a long position on bitcoin.
Tp is : $112500
Sl: 110565
3 RR potential trade

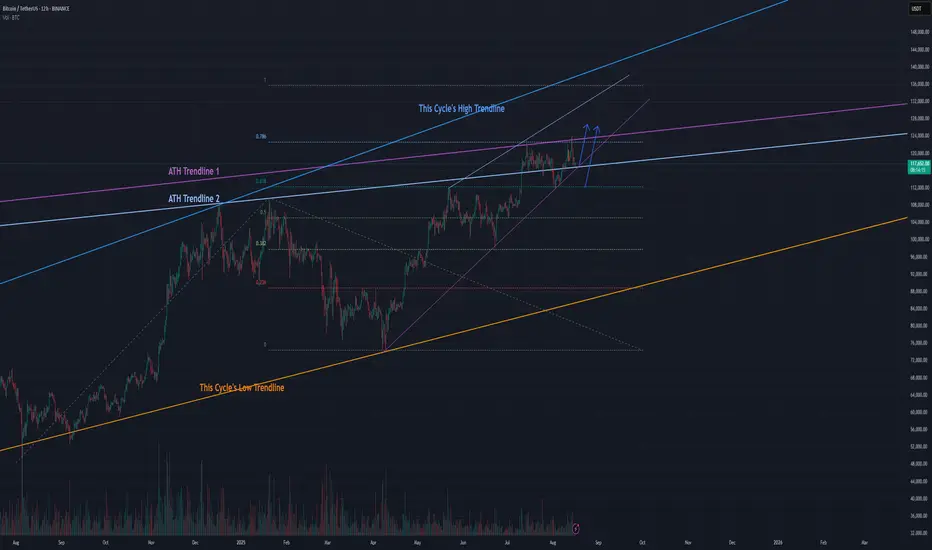
ATH Trendline - Next BITCOIN Levels to WatchThere was a CME Futures gap at just under $117k which Bitcoin came back down to fill. To explain future, the CME Futures market is only open during typical wall street trading hours, so if the Bitcoin price moves outside of that timeframe, there will be a gap in the CME Futures price chart. The gaps almost always get filled and that is what happened this week.
While it hurts to have such a strong pullback just after a new ATH, it is a good thing to have the gap filled now rather than have that waiting to be filled after the price is much higher.
The long term, ATH Trendlines are causing some resistance as well. We'd like to see a monthly candle close above these levels flipping them from resistance into support ("S-R flip") and securing $120k as the new bottom for Bitcoin.
I think price should continue up from here based on the momentum of the new ATH and many other indicators. If price goes lower, I'm still bullish as long as bitcoin can maintain a higher low above $112k.
BTCUSD: Correction is over with high probability...The daily timeframe is flashing a buy signal, likely signifying that the correction in crypto is over with 60%+ chance.
Best of luck!
Cheers,
Ivan Labrie.

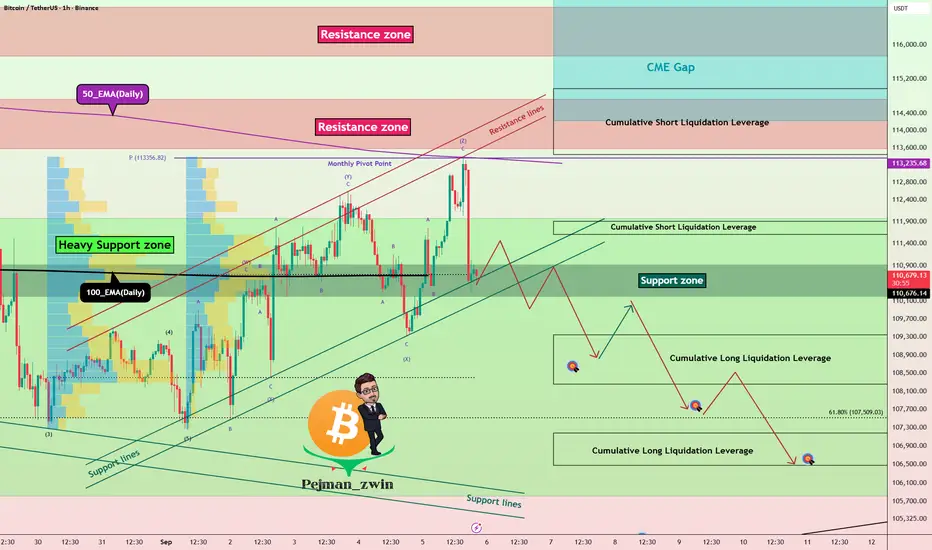
Bitcoin Roadmap – Breakdown Toward $107K or Bounce?Bitcoin ( BINANCE:BTCUSDT ) has been moving with high momentum this week , with the US indexes and Gold ( OANDA:XAUUSD ) bullish .
Bitcoin is currently trying to break the Support lines , Support zone($110,920-$110,200) and 100_EMA(Daily) .
In terms of Elliott Wave theory , it seems that the waves that Bitcoin has made this week have been in the form of a Triple Three Correction(WXYXZ) .
I expect Bitcoin to decline to at least $109,133(First Target) AFTER the Supports are broken.
Second Target: $107,740
Third Target: $106,660
Stop Loss(SL): $114,108(Worst)
Note: As I said at the beginning of this analysis, the financial markets have been a bit emotional and sudden with their movements this week, so always be prepared for any scenario and pay more attention to capital management.
Note: Generally, trading volume is low on Saturdays and Sundays. Perhaps it is a bit far-fetched to expect a break of the Heavy Support zone($111,980-$105,820) during the weekend. What do you think?
Cumulative Short Liquidation Leverage: $114,976-$113,440
Cumulative Short Liquidation Leverage: $111,907-$111,607
Cumulative Long Liquidation Leverage: $109,346-$108,259
Cumulative Long Liquidation Leverage: $107,181-$106,479
CME Gap: $117,235-$113,800
Please respect each other's ideas and express them politely if you agree or disagree.
Bitcoin Analysis (BTCUSDT), 1-hour time frame.
Be sure to follow the updated ideas.
Do not forget to put a Stop loss for your positions (For every position you want to open).
Please follow your strategy and updates; this is just my Idea, and I will gladly see your ideas in this post.
Please do not forget the ✅' like '✅ button 🙏😊 & Share it with your friends; thanks, and Trade safe.
I wonder how it's going to go |BTCUSDTthis analysis reflects only my personal views and is not financial advice. Any profit or loss from actions taken based on this content is solely your own responsibility.

