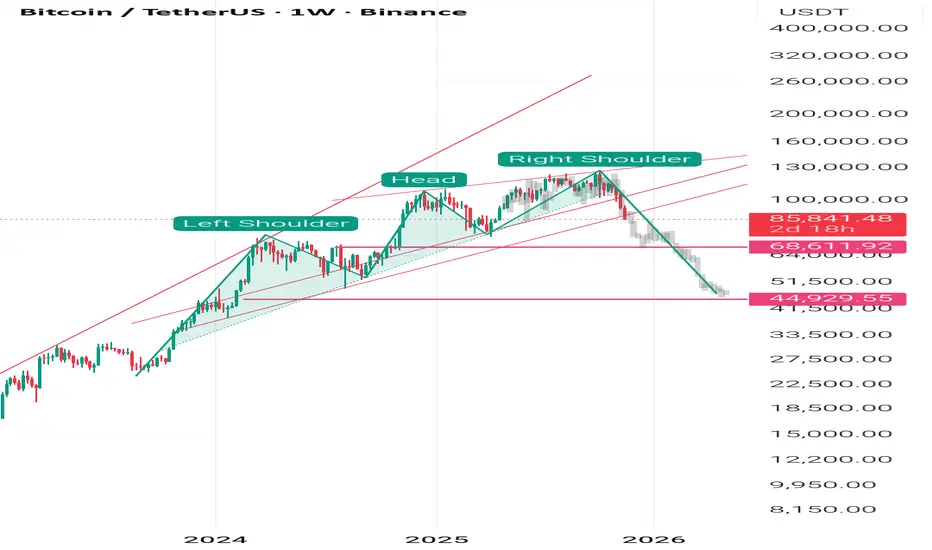
Bitcoin's Potential Head & Shoulders: Critical $75K Support# Bitcoin's Potential Head & Shoulders: Critical $75K Support Could Trigger Drop to $30K
## 📊 Current Market Structure
### The Setup
- **Current Price**: ~$84,000
- **Left Shoulder**: ~$109,000 (previous peak)
- **Head**: ~$126,000 (all-time high)
- **Critical Neckline**: $75,000
- **Potential Target on Breakdown**: $30,000
## 🎯 The Head & Shoulders Pattern Explained
### Pattern Components
**Left Shoulder (Completed)**:
- Peak at ~$109,000
- First major top in the cycle
- Followed by correction to neckline
**Head (Completed)**:
- Peak at ~$126,000 (ATH)
- Highest point of the pattern
- Currently correcting from this level
**Right Shoulder (Potential)**:
- **IF** we bounce from $75,000 support
- Could form another peak around $100K-$115K
- Would complete the bearish pattern
- Lower than the head, creating the classic formation
**Neckline (Critical Level)**:
- **$75,000** is the make-or-break level
- Acts as support for both the head and potential right shoulder
- **This level CANNOT be lost** for the pattern to remain valid
## ⚠️ Why $75K Is Absolutely Critical
### This Level Represents:
1. **Pattern Validity**:
- The foundation of the entire H&S structure
- Breaking it invalidates the bullish case
- Confirms distribution phase
2. **Technical Significance**:
- Previous resistance turned support
- High volume node from consolidation
- Psychological round number
3. **Market Structure**:
- Separates bull market from bear market
- Defines the range for right shoulder formation
- Last line of defense for bulls
## 📉 Two Scenarios From Here
### Scenario A: Bounce at $75K → Right Shoulder Formation (50% Probability)
**What Happens:**
- Price holds $75,000 support
- Rally begins toward $100K-$115K
- Forms the right shoulder (lower than $126K head)
- Creates selling opportunity for smart money
- **Then**: Breakdown occurs
**Timeline**:
- Bounce: Q1 2025
- Right shoulder formation: Q2-Q3 2025
- Breakdown: Late 2025/Early 2026
**Trading Implications**:
- Short-term bullish (75K to 100K+ = 33% gain)
- Medium-term bearish (setup for major drop)
- **Exit strategy needed** at right shoulder peak
### Scenario B: Direct Breakdown Below $75K (50% Probability)
**What Happens:**
- No bounce, direct break of $75,000
- Pattern completes immediately (no right shoulder needed)
- Accelerated selling pressure
- Target: $30,000
**Why This Could Happen:**
- Weak market structure
- Lack of buying support
- Macro headwinds (Fed policy, liquidity)
- Panic selling cascade
## 🎲 The $30K Target Explained
### How We Get There:
**Measured Move Calculation**:
- Head to Neckline distance: $126K - $75K = $51K
- Projected from breakdown point: $75K - $51K = **$24K**
- Conservative target considering support: **$30K-$35K**
**Why $30K Makes Sense:**
1. **Technical Confluence**:
- 200-week moving average (~$30K-$35K)
- Previous cycle high (2021 pre-ATH level)
- 76.4% retracement from ATH
- Typical Bitcoin bear market correction
2. **Historical Precedent**:
- 2018: 84% drop from ATH ($20K → $3K)
- 2022: 77% drop from ATH ($69K → $16K)
- 2025/26: 76% drop from ATH ($126K → $30K) would be consistent
3. **Market Cycle Logic**:
- Euphoria at $126K → Panic at $30K
- Washes out leverage and weak hands
- Creates foundation for next cycle
- Resets sentiment completely
## 📊 What Makes This Pattern Dangerous
### Red Flags to Watch:
**Distribution Signs at Right Shoulder:**
- 📉 Declining volume on rallies
- 📉 RSI bearish divergence (lower highs)
- 📉 Whale wallets distributing
- 📉 Funding rates extremely positive (over-leveraged longs)
- 📉 Retail FOMO peaks
- 📉 Media euphoria ("Bitcoin to $1M" headlines)
**Breakdown Confirmation Signals:**
- ❌ Daily close below $75K
- ❌ High volume on breakdown
- ❌ Failed retest of $75K (becomes resistance)
- ❌ Break of ascending trendline
- ❌ Death cross (50 MA crosses below 200 MA)
## 🔮 Probability Assessment
### My Analysis:
| Scenario | Probability | Timeline | Key Levels |
|----------|------------|----------|------------|
| **Bounce → Right Shoulder → Drop** | 40% | 6-12 months | $75K hold, rally to $100K-$115K, then drop to $30K |
| **Direct Breakdown to $30K** | 30% | 3-6 months | Break $75K, accelerate to $30K |
| **Pattern Fails → New ATH** | 20% | 3-6 months | Break above $126K, continue to $150K+ |
| **Extended Consolidation** | 10% | 12+ months | Range between $70K-$100K |
## 💡 Strategic Implications
### For Traders:
**Current Position ($84K)**:
- ⚠️ **High risk zone** - caught between hope and fear
- Wait for clarity at $75K level
- Don't chase moves in either direction
**If $75K Holds**:
- ✅ Long opportunity with tight stop below $75K
- Target: $100K-$115K (right shoulder)
- **Exit before right shoulder completes**
- Risk/Reward: Excellent (12-37% upside, tight stop)
**If $75K Breaks**:
- 🔴 Short opportunity or exit all longs
- First target: $60K
- Second target: $45K
- Final target: $30K-$35K
- Trail stops as it drops
### For Long-Term Investors:
**Current Strategy**:
- 🎯 **Do NOT buy here** ($84K) - wait for clarity
- 🎯 **If bounce to $100K+**: Take profits, reduce exposure
- 🎯 **If drop to $75K**: Small position (10-20% of capital)
- 🎯 **If drop to $50K-$60K**: Medium position (30-40%)
- 🎯 **If drop to $30K-$35K**: Aggressive accumulation (remaining capital)
**Dollar-Cost Averaging Zones**:
- ❌ $84K-$100K: **NO BUYING** (distribution zone)
- ⚠️ $70K-$80K: **Minimal** (5-10% of capital)
- ✅ $50K-$70K: **Moderate** (20-30% of capital)
- ✅✅ $30K-$50K: **Aggressive** (50-70% of capital)
## 🎯 Key Levels to Monitor
### Critical Support Levels (In Order):
1. **$75,000** - THE LINE IN THE SAND
- Pattern neckline
- Must hold for any bullish case
- Break = bearish confirmation
2. **$60,000-$65,000**
- Secondary support
- 50% retracement zone
- Potential dead cat bounce area
3. **$48,000-$52,000**
- Previous cycle resistance
- Strong psychological level
- Potential accumulation zone
4. **$30,000-$35,000**
- 200-week MA
- Pattern target
- Maximum pain level
- **Best buying opportunity**
### Resistance Levels (For Right Shoulder Scenario):
1. **$90,000-$95,000** - Initial resistance
2. **$100,000-$105,000** - Psychological barrier
3. **$110,000-$115,000** - Right shoulder peak zone
4. **$126,000** - Head level (unlikely to break)
## ⚡ What Could Invalidate This Bearish Setup?
### Pattern Failure Scenarios:
**Bullish Invalidation**:
- ✅ Break and close above $126K (new ATH)
- ✅ Strong volume accumulation at $75K
- ✅ Fundamental catalyst (major adoption news)
- ✅ Macro shift (Fed pivot, liquidity injection)
**Signs Pattern Won't Complete**:
- Institutional buying increases significantly
- ETF inflows accelerate
- On-chain metrics show strong accumulation
- Whale addresses growing, not distributing
- Long-term holder supply increasing
## 📰 Current Market Context
Based on your chart's news feed:
- "Bitcoin plunges below $86,000 as US jobs data dampens rate cut hopes"
- Strong jobs data = Fed stays hawkish
- Less liquidity = bearish for risk assets
- This supports the H&S breakdown thesis
## ✅ Bottom Line
### The Critical Message:
**$75,000 is the most important level in Bitcoin right now.**
- ✅ **Hold $75K** = Potential bounce to $100K-$115K (right shoulder)
- ❌ **Break $75K** = High probability of drop to $30K-$35K
- ⚠️ **Current price $84K** = No man's land, wait for clarity
### Action Plan:
**Short Term (Next 2-4 weeks)**:
- Watch $75K like a hawk
- Reduce risk exposure
- Prepare for volatility in either direction
**Medium Term (3-6 months)**:
- If bounce: Trade the right shoulder, but EXIT before completion
- If breakdown: Wait for $30K-$50K to accumulate
- Don't fight the trend
**Long Term (1-2 years)**:
- This pattern, if it completes, sets up the NEXT bull cycle
- $30K would be generational buying opportunity
- Bitcoin's long-term thesis remains intact
- Think in cycles, not in days
---
**Final Thought**: This is a textbook Head & Shoulders pattern forming on a macro scale. The $75K neckline is the key. Lose it, and we're heading much lower. Hold it, and we get one more rally before the inevitable correction. Either way, **patience and discipline will be rewarded** more than trying to catch falling knives or FOMO into pumps. 🎯
Trade ideas

Whats your thoughts on this bitcoin idea back to highs? In my opinion BTC is pulling back very nicely and i do think it could have a bounce from this area, if it does not bounce from this area i would risk an absolute mortgage at 60 to 65 thousand. What's your analysts?
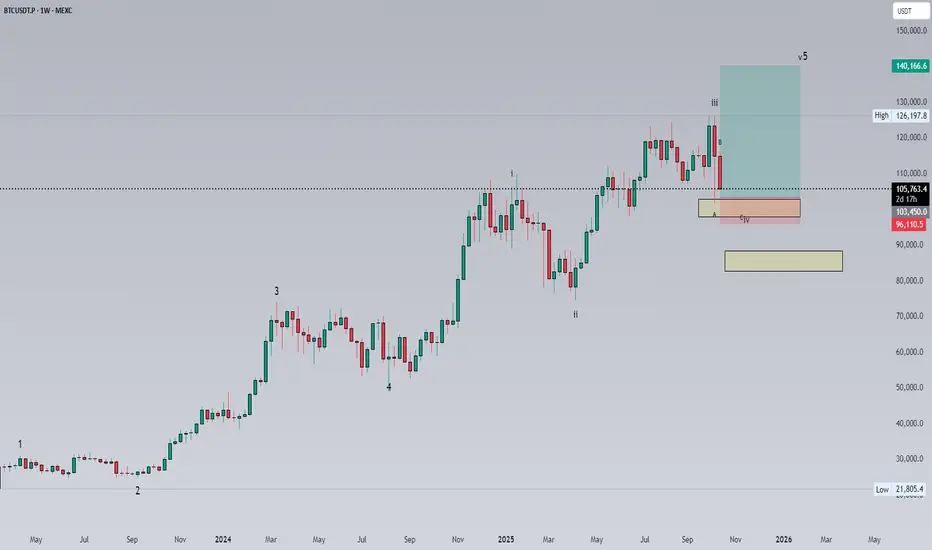
BITCOIN Next Weve Hello everyone, I hope you are all well
Today I will share with you my prediction for the next price movement of Bitcoin. I predict that the price has reached its all-time high. I previously shared an idea illustrating this; please review it below. I predict that we will see a final price rebound, as shown in the analysis, followed by a sharp drop to the targets outlined above.
This is not investment advice; please take full responsibility for your buying and selling decisions.
Warning: Be careful not to use this idea with leverage, as you could lose all your money

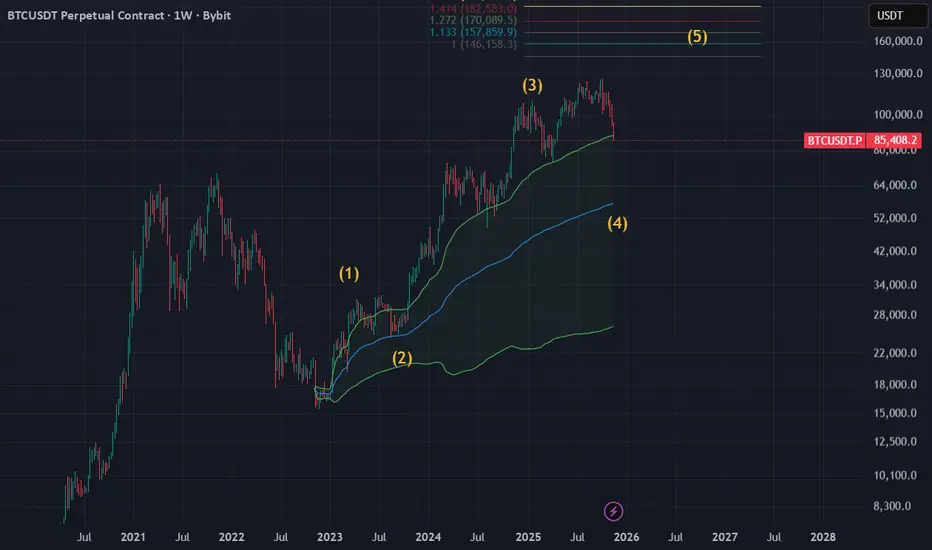
Don't be fearful.We are at Wave 3 correction.150k-200k at Wave 5As we can see on the MACRO LOG scale of this asset, subwaves for each big waves are clearly seen. We look at this dump as a blessing; not something to be feared of. We stay patient for where this dump goes and simply trade it.
Simply looking at the chart, vwap says 50k-ish is a very good zone to look into. Much much happy to come in if we visit below 50k with a failed auction to jump in.
Ofcourse, this is a very much big swing idea that does not mean too much for trading levels.
This approach is for investors who simply see bitcoin as an asset.
For a trader like us on this website, we must look on intermediate levels.
Goodluck traders!
Btcusd update ooooopMany of you may be surprised, but unfortunately this decline will continue, at least to $74,000. But I will expect a temporary high. If you have seen the previous analysis, you will understand what I expect from the price.

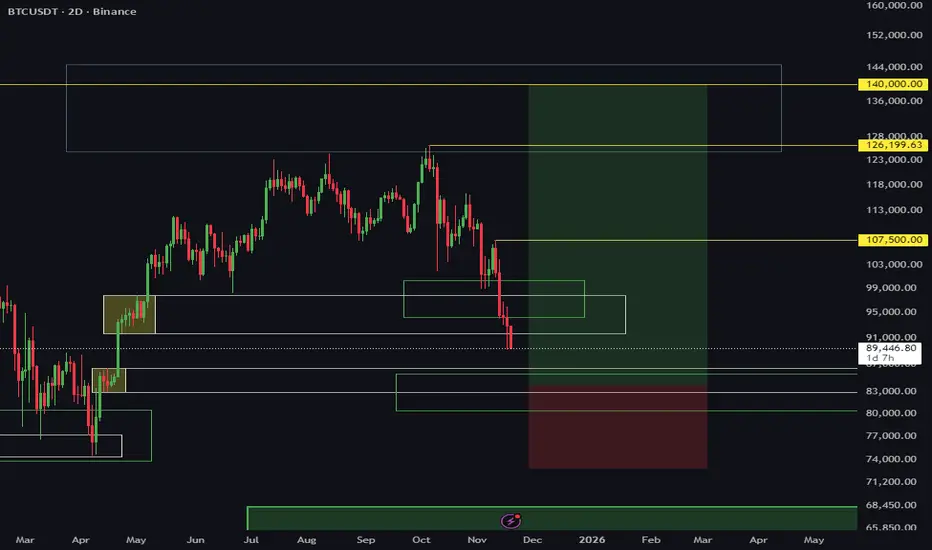
Final 2025 Forecast for BTCUSDT 21st November 2025 (Updated)1. Friday session dip to around ~$84k
2. Pump to around ~$92k over the weekend and early next week
3. Final dump down to ~$80k
4. Final pump to ~$128k to end the cycle
This idea does not indicate a massively new ATH but a topping out at the multi-cycle trend line from 2017.

SELL NOW TO 83K ON BTCUSD!!!!BTCUSD completed my last recent post analysis with 10,000pips today we have price rejecting off the inside bar supply region with a bearish rectangular pattern formed am in on another sell here holding till 83k is completed......

Bitcoin’s Head and Shoulders Pattern Signals a Possible Drop to Bitcoin’s current price action is far from healthy, and it could easily complete a Head and Shoulders pattern, leading to a correction down to the $40,000 range. While many may find this hard to accept, it’s time to face the reality: Bitcoin and other cryptocurrencies are no longer what they used to be, and altcoins are unlikely to experience another true altseason.
In 2025, the crypto bubble finally burst, revealing that digital currencies have far fewer real-world applications than promised, and public interest has faded. I’m saying goodbye to cryptocurrencies and shifting my focus to the Forex market. I will never “HODL” again, as this market has proven itself to be one of the dirtiest in the world.
Just about four weeks ago, the crypto market crashed in a way no other market does a clear sign of the disastrous manipulation by entities like Binance, which create extreme price traps to liquidate traders.
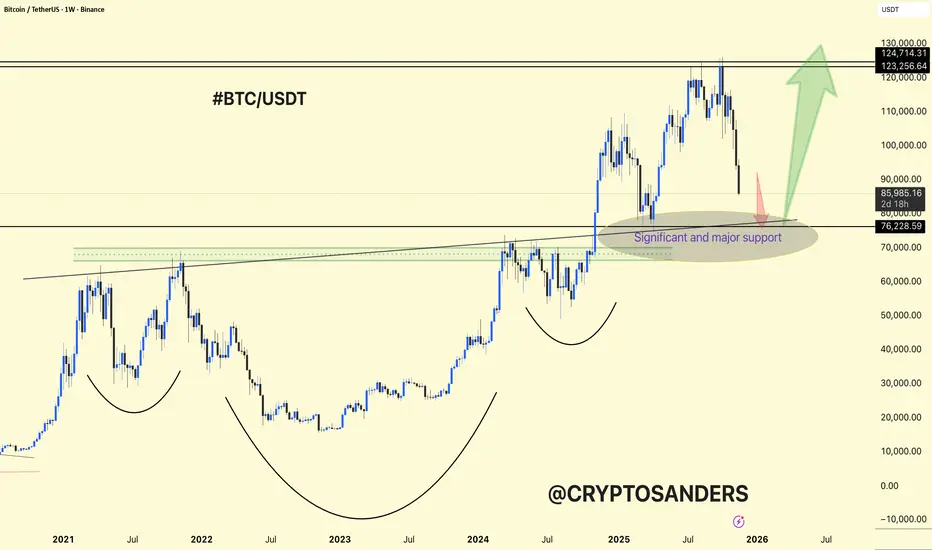
BTCUSDT Weekly Chart Analysis. BTCUSDT Weekly Chart Analysis
Major Structure: Bitcoin is experiencing a significant correction, now testing the most important multi-year support zone around $80,000–$82,000.
Patterns: The chart shows multiple rounded bottoms and a massive base structure, indicating repeated accumulation phases since 2021.
Support Zone: This highlighted area is not only a former breakout region but also converges with major horizontal and trendline support levels, making it highly significant for bulls.
If buyers defend this zone, a swift rebound toward $123,000–$130,000 is likely, maintaining the long-term uptrend.
Failure to hold here increases risk for deeper corrective moves, and the next support would be much lower.
Momentum Shift: The steepness and sharp drop into support reflect panic or forced selling, often associated with extreme sentiment lows.
DYOR | NFA
BTC Absolute Bottom is 76,500 SHORT THEN LONG to new ATH's30- 40% correction is usually a good pullback historically speaking. The last pullback similar to this one was January 2025 - April 2025 totalling a 32% retracement . thereafter taking off from $74,500 to ATH's.

BTC, OH BTC...Where Art Thou Going? - The Next Target = 77K-80KThis is part 2 of my analysis on BTC since we had the initial All Time High and the Break of Structure that led to all of this downfall. Please see the previously posted analysis on BTC and the analysis on ETH to see how the market structure has been playing out.
As mentioned in my previous post, don't follow the hype of Tariffs, Flash Crashes, and other non-sense reasons as to why BTC is dumping to these levels. This is a clear technical breakdown that is following how I "Read" market structure.
After the ATH of ~ 125K, we had a Break of Structure on the H4, that pulled back to what I call the "source" and then gave a strong rejection. This was followed by a Daily Break of Structure, and then a Weekly Break of Structure as well. This almost always leads to a continued rejection, and the target is the Daily "Source Zone" and then the Weekly Demand Source Zone.
As of today, we have fallen down through the Daily Source and are just inside of the large Weekly Source Zone (~77K - 88.5K). We will now have to dive down into this zone and look for the Daily Source to see more precisely where BTC is going. The daily range is between 77K - 80K, so that is the most likely target. Being a daily source within a weekly source, there should be a strong volume of buyers at this level, and we should see BTC spring back up from there.

BTCUSDT Weekly – Long SetupRumors swirl that Trump’s prepping a market-saving maneuver—just in time to protect his family's crypto bags before the next bear market. Whether it’s fiscal fireworks or just good ol’ wave theory, the chart’s pointing north.
Let’s see if the Trump pump delivers before the bears regroup. 🐂🇺s
[LONG] BTCUSDT - BUY OPPORTUNITY1. Buy Phase 1 around $90 - 91k
2. If BTC go down under $90k, we will plan for another buy Phase for Long

Bitcoin Faces Renewed Pressure as 91,900 Support WeakensHello everyone, looking at BTC on the 4H timeframe, I can clearly see the market leaning decisively to the downside after failing to break through the 93,160 USD zone. The current rebound is quite weak — small candles, thin buying pressure — indicating that the market is simply taking a “technical breath” rather than preparing for any meaningful push upward.
The 91,900 USD level is acting as the nearest support, but the chart reflects clear hesitation from buyers. The expanding red FVGs above show that selling pressure continues to dominate. If BTC slips below 91,500 USD, the bearish structure will extend and price could quickly retreat toward 90,000 – 89,500 USD, where a significant amount of liquidity is waiting.
The news backdrop isn’t helping buyers either: the Fed maintains a hawkish tone, the USD is strengthening, market sentiment has turned cautious, and capital is favouring the sidelines instead of stepping in to support price.

BTCUSD ShortAs you see in the chart, I see many reasons that we can see BTC to the level of 85,000$ by end of the year. So the reasons are:
Head&Shoulder pattern
Started the downtrend channel
The bold blue trendline is what the price is expected to touch.

#BTCUSD #Bitcoin Buy Setup🔼#BTCUSD #Bitcoin #Crypto Buy Setup
Currently Trading At 88564 , Buy On Dip Around 85916 And More Only At 83571 If Comes for The Target 95380—-104400

Rare Global Long Liquidity Imbalance (Order Book Signal)Over the last few days, the Long Zigg indicator has printed a rare extreme reading of 100 at the 10% order book depth — and this level appeared twice in just three days . Other monitored depths are also trading near their recent highs.
The last time we saw similar readings was around March 7, 2025 . After a brief correction, the market moved into a strong growth phase:
• BTC ≈ +70%
• ETH ≈ +225%
• SOL ≈ +166%
Many altcoins extended even further over the following months.
Long Zigg tracks the liquidity imbalance toward longs across the entire market using aggregated order books rather than price alone. It highlights moments when buy-side interest clearly dominates available sell liquidity.
Right now, this signal again shows a notable skew in liquidity to the buy side. I’m watching to see whether the market will react in a similar way to the previous extreme, or if this time will be different.
This is not financial advice and not a trade recommendation — just an observation based on my order book analytics.

BTC END OF A LEGENDARY ERA.BTC — End of a Legendary Era
A decisive break of long-term support signals a major shift in Bitcoin’s market structure. Momentum has shifted, confidence is waning, and the chart suggests the end of an era that has defined the crypto market for years.
THE END.

Bitcoin levels and overlay of previous bear market. This is a long-term Bitcoin price chart (BTC/USDT) on a monthly timeframe from TradingView, spanning from mid-2021 to early 2028 (with the current date being November 21, 2025).
Key elements:
Price action:
Bitcoin peaked around November 2021 at roughly ~$69,000 (all-time high at the time).
It then entered a prolonged bear market throughout 2022, bottoming near ~$15,500–$16,000 in November 2022.
From 2023 onward it has been in a slow, steady recovery and new bull market.
As of November 2025, the price is trading around $88,000–$92,000 and has just broken above the previous all-time high from 2021.
Horizontal lines and Fibonacci retracement/ extension levels:
The chart is overlaid with multiple Fibonacci tools (likely drawn from the 2021 ATH to the 2022 low) showing classic retracement and extension levels:
0.382 (green)
0.5 (orange)
0.618 (golden ratio, blue) – heavily emphasized
0.65, 0.786, 1.0, etc.
Higher extensions: 1.618, 2.0, etc.
The price has repeatedly respected these levels over the years:
Found support near the 0.618 (~$30k–$35k area) multiple times in 2022–2023.
Broke above the previous ATH (1.0 level) in 2024–2025.
Currently trading around the 1.618 extension (~$90k–$100k zone), with some levels drawn slightly differently by the author (e.g., 0.65 instead of standard 0.65/0.786).
Overall structure:
The chart shows a classic post-bear-market expansion where Bitcoin is now targeting common Fibonacci extension levels that many analysts use for bull-market price targets (1.618 × the prior bear-move often gives ~$100k–$140k depending on exact swing points used).

BTC DECODED ANALYSIS REMINDER UPDATES BTC decoded analysis next support, Monthly support is noted at $68,021.7 before BTC tests the quarterly support at $62,772.02.
These supports were updated on Binance on May 27th, 2025, with a brief detailed reminder updated again on October 29th, 2025.
These decoded analysis details are also mentioned in my pinned post.
All my analysis is based on actual fact based skip supports with no predictions.
This message is for educational purposes only, Always DYOR.

BITCOIN — THE SUPPORT LINEBitcoin’s ultimate support for bulls lies between the two black lines shown above.

IM BUYING THE DIP ON BITCOINIM BUYING THIS DIP ON #BITCOIN 📈
Following my plan, level by level!
Later Shorter are gonna be REKT in my opinion! 🔴
That 0.786 fib level daily, will likely act as bottom for tonight! 📈
#BTC price is also on key dem support + highly oversell (H1) & ichimoku.
I wont be surprise to see a bull trap & fake test of the previous levels.
89,000 - 90,000$ next 📈🎯 , Then dump toward 84k- ?
A retest of the 100k previous key support before to see another crash could also be a possibility!? 👀

BTC - Next Bottom in October 2026?This is my second scenario: as long as the previous weekly higher low holds, I remain bullish. However, if any candle closes below 74,500, it signals further downside ahead.”
“This represents my secondary scenario. Bullish bias remains valid while the previous weekly higher low is intact. A candle close below 74,500 would invalidate this structure and suggest additional downside.”
“Bullish while the weekly higher low holds. A close below 74,500 indicates more downside.”
