BTCUSD Technical Analysis (30m)This post provides an analytical breakdown of BTCUSD using the 30-minute timeframe (30m), leveraging our proprietary technical indicator: the Trend Break Target (TBT) Indicator.
Market Structure Shift and Indicator Activation
The current analysis focuses on a significant change in the market structure observed on the 30m chart. The TBT indicator was programmed to detect and react to specific conditions that signify a high-probability continuation or reversal.
Activation Signal: The indicator was activated and the price targets were subsequently generated following the closing of the specific candle indicated by the arrow on the chart. This close confirmed the necessary structural change (e.g., a break of resistance/support, or a specific pattern completion) required by the TBT's underlying logic. This market structure shift (MSS) provides the foundation for the calculated price objectives.
Calculated Price Targets (TBT Forecast)
Based on the activation of the Trend Break Target Indicator, the following potential price objectives have been calculated. These targets represent areas where price action is statistically likely to find resistance, profit-taking activity, or a high-probability exhaustion point for the current move.
🎯 Target 1 (T1): $90,400
Significance: This is the immediate and most probable objective, often representing a minimum measured move following the structure break.
🎯 Target 2 (T2): $91,450
Significance: A secondary, extended target that comes into play if bullish momentum persists and T1 is cleanly surpassed and held.
🎯 Target 3 (T3): $92,709
Significance: The final, ambitious target representing the full potential move calculated by the TBT model based on the initial structure shift. It acts as the high-end projection for the current impulsive wave.
Disclaimer
Note: This analysis is based on a proprietary indicator and should be used for informational and educational purposes only. Always manage your risk effectively, use appropriate stop-loss orders, and conduct your own due diligence before making any trading decisions. The crypto market is highly volatile, and actual price action may deviate from projected targets.
Trade ideas

BTCUSDT.P - December 6, 2025Price remains in a short-term downtrend, respecting a descending trendline while failing to establish any higher swing highs. The current rebound shows weak momentum, suggesting a potential retest of the 87.5k–86.9k support region before any meaningful reversal attempt. A sustained break above 91.2k resistance would be required to confirm bullish structure, while a drop below 85.7k would likely extend the bearish leg. Overall, the market is consolidating within a corrective structure, awaiting a decisive breakout.

BITCOIN - BULLISH OUTLOOK CRYPTOCAP:BTC - I see an ascending consolidation 📈
No reason to be bearish on this dip yet, as we haven't revisited the previous key support that was broken earlier.
As I said, I anticipate a bullish reaction in the #alts market soon. #BTC is likely going to lead the way 📈
Key resistance levels I'm watching:
$ 93,500 📈
$ 98,500 🎯
$ 100,000 (weak)
101,000 − 101,500 🎯
$ 103,450 (weekly 50% fib)
If bulls manage to close a weekly candle above $ 103,000, that would mean we are likely going to see another price expansion to complete a new wave upward toward ATH & beyond 📈 (macro insight).
I'm 95% sure that late shorts are going to get liquidated here. Be cautious! 🔴
Let's keep building and share good vibes 🚀
Level by level team🎯- Not financial advice.

BTC BRRRTime to go up, price wait so long to go up, liqudity is ready to move price, fed also support price to bull push, price still cheap. time to gooooooooooo

How to Make 18% in a Week: RSS3 Reversal Trading Across 4 MarketHow to Make 18% in a Week: RSS3 Reversal Trading Across 4 Markets
On November 27, Bitcoin was trading at $91,400. Classic overbought indicators were flashing red, but timing the entry was the million-dollar question. When exactly to short? And more importantly—when to exit?
Four days later, price crashed to $83,800 (-8.3%). Then two days after that, it rallied to $93,600 (+10.1% from the bottom). Full cycle result: +18.4% in one week . Both entries and both exits were marked by a single indicator.
This article demonstrates real trades across four different markets—crypto, US stocks, forex, and index futures—with exact dates, prices, and percentages. All examples from November 2025, all data-verified.
🔗 Free indicator: RSS3 - Reversal Score System v3
═════════════════════════════════════════════════════════════
THE DIVERGENCE PROBLEM
You've likely experienced this:
• RSI shows divergence, you enter—price moves against you another 5%
• MACD signals "perfect" setup—you hit stop-loss two hours later
• Counter-trend divergence works 1 out of 5 times
Three critical issues:
1. All divergences look identical —but one leads to 10% reversal, another to 1%
2. No trend filter —divergences against strong momentum often fail
3. Subjectivity —which pivot to use? What lookback period?
RSS3 (Reversal Score System v3) solves these by adding numerical strength scoring from -1 to +1 and multi-timeframe filtering .
═════════════════════════════════════════════════════════════
HOW RSS3 WORKS—SIMPLIFIED
No formulas. Three key concepts:
1. Final Score shows reversal strength:
• Score < -0.5 → bullish zone (potential upside)
• Score > +0.5 → bearish zone (potential downside)
• Closer to ±1.0 = stronger signal
2. Automatic divergences marked with triangles:
• Green below price = bullish
• Red above price = bearish
• Lime/Maroon = double confirmation (both VPI+TDFI)
3. MTF filter protects against counter-trend entries:
• Gray triangles = filtered signals
• "Reduce" mode—weakens counter-trend divergences
• "Block" mode—hides them completely
Now let's see it in action.
═════════════════════════════════════════════════════════════
CASE 1: CRYPTO SWING—BITCOIN FULL CYCLE
Asset: BTC/USDT (Binance)
Timeframe: 2 hours
Period: November 27 - December 3, 2025
Double Bearish Divergence—Short Entry
November 27 brought two bearish divergences within 10 hours on BTC:
Divergence 1: Nov 27, 09:00
Price: $91,408
Score: 0.537 (above 0.5 threshold = extreme)
Entry: $91,372 (+2 bars delay)
Divergence 2: Nov 27, 19:00
Price: $91,479
Score: 0.188
Entry: $91,417
Double divergence = amplified signal. Both pointed to bearish reversal. Price dropped to $83,823 by December 1.
Short Result: 8.26-8.31% profit (~8.3% average) in 4.5 days
─────────────────────────────────────────────────────────────
Extreme Bullish Signal—Long Entry
December 1, 17:00—at the same $83,823 low, a bullish divergence appeared with Score -0.885 :
Signal: Dec 1, 17:00
Price: $84,678
Score: -0.885 (near theoretical minimum -1.0!)
This is an exceptionally strong bullish signal —Score in the bottom 5% of all values for the period. After entry at $85,025, price rallied to bearish divergence on Dec 3:
Entry: $85,025 (Dec 1, 21:00)
Exit: $93,643 (Dec 3, 07:00, bearish divergence)
Score: 0.592 (bearish zone)
Profit: 10.14%
─────────────────────────────────────────────────────────────
BTC Statistics:
Period: Nov 27 - Dec 3 (7 days)
Price range: $83,823 - $93,959
Score range: -1.000 to +0.647
Total divergences: 6 (1 bullish, 5 bearish)
Short: ~8.3%
Long: +10.1%
════════════════
TOTAL: ~18.4% 🚀
Key insight: Score -0.885 on bullish divergence was the lowest value for the entire analysis period, confirming reversal strength.
═════════════════════════════════════════════════════════════
CASE 2: TECH STOCKS—NVIDIA EXTREME SCORE ENTRY
Asset: NVDA (NASDAQ)
Timeframe: 15 minutes
Period: November 20-21, 2025
Score-Based Entry WITHOUT Divergence
Unlike traditional setups, this trade demonstrates entering on extreme Score alone —no divergence required.
Nov 20, 17:30—Score hits 1.000 (theoretical maximum bearish pressure):
Entry signal: Score = 1.000
Entry price: $194.23
Date: Nov 20, 17:30
This showcases RSS3's dual functionality: divergence-based reversals AND pure momentum exhaustion signals.
─────────────────────────────────────────────────────────────
Two Exit Strategies
Option A: Divergence Signal (Conservative)
Exit: Bullish divergence same day
Time: Nov 20, 22:00 (4.5 hours later)
Price: $181.73
Score: -0.177
Profit: 6.44%
Option B: Opposite Extreme Score (Aggressive)
Exit: Strong bullish Score next day
Time: Nov 21, 18:30 (25 hours later)
Price: $175.14
Score: -0.873 (strong bullish signal)
Profit: 9.83%
Maximum potential: $169.56 reached on Nov 25 (12.70%)
─────────────────────────────────────────────────────────────
Key Takeaway:
Entry on Score = 1.000 demonstrates that RSS3 works as both:
1. Divergence detector (traditional)
2. Overbought/oversold extremes indicator (alternative)
No need to wait for pivot confirmation when Score hits absolute limits.
═════════════════════════════════════════════════════════════
CASE 3: FOREX PRECISION—GBP/USD SWING
Asset: GBP/USD
Timeframe: 30 minutes
Period: November 17-19, 2025
Classic Divergence Setup
Nov 17, 15:00—Bearish divergence with solid Score:
Signal: Nov 17, 15:00
Price: 1.31870
Score: 0.663 (strong bearish zone)
Entry: 1.31845 (+2 bars, 16:00)
Nov 19, 22:30—Bullish divergence signals exit:
Exit: 1.30458
Score: -0.900 (extreme bullish signal, near -1.0!)
Profit: 1.05%
Pips: 139
Duration: 54.5 hours (~2.3 days)
─────────────────────────────────────────────────────────────
Forex-Specific Advantages:
1️⃣ Conservative but Consistent
- 1% in 2 days = ~180% annualized (if repeatable)
- Low risk, steady returns
2️⃣ Perfect Entry/Exit Symmetry
- Entry Score: +0.663 (bearish extreme)
- Exit Score: -0.900 (bullish extreme)
- Mirror-image reversal pattern
3️⃣ Double Divergence Confirmation
- Entry: Bearish divergence
- Exit: Bullish divergence
- No guesswork
4️⃣ Ideal Timeframe for Part-Time Trading
- 30M filters noise but stays responsive
- Suitable for traders with day jobs
Exit Score of -0.900 was near the period's minimum, providing high-confidence reversal confirmation.
═════════════════════════════════════════════════════════════
CASE 4: INDEX FUTURES—E-MINI S&P 500 WITH LEVERAGE
Asset: E-mini S&P 500 (ES)
Timeframe: 4 hours
Period: November 20-26, 2025
Institutional-Grade Swing Trade
Nov 20, 22:00—Bullish divergence on higher timeframe:
Signal: Nov 20, 22:00
Price: 6552.00 points
Score: -0.761 (strong bullish)
Entry: 6577.00 (+2 bars / 8 hours, Nov 21 06:00)
Nov 26, 18:00—Bearish divergence signals exit:
Exit: 6833.00 points
Score: 0.385 (bearish zone)
Points: 256.00
Profit: 3.89%
Duration: 132 hours (~5.5 days)
─────────────────────────────────────────────────────────────
Leverage Advantage:
E-mini S&P 500 contract specifications:
• Multiplier: $50 per point
• Typical margin: ~$14,000 per contract
• Contract value: ~$328,850
Profit Calculation:
Spot profit: 3.89%
Points gained: 256.00
Per contract: 256 × $50 = $12,800
ROI on margin: $12,800 / $14,000 = 91.4%!
With 2 contracts: $25,600
With 5 contracts: $64,000
⚠️ Risk Note: Leverage amplifies both gains AND losses. Always use proper position sizing and risk management!
─────────────────────────────────────────────────────────────
4H Timeframe Benefits:
1️⃣ Institutional-Quality Signals
- Filters intraday noise
- Perfect for swing traders and fund managers
2️⃣ Work-Life Balance
- Only 6 bars per day
- Can be monitored part-time
3️⃣ Capital Efficiency
- 3.89% spot → 91.4% ROI on margin
- Professional-grade risk/reward
4️⃣ Tax Advantages
- 60/40 tax treatment in US
- Lower spreads vs cash index
═════════════════════════════════════════════════════════════
COMPARATIVE ANALYSIS
All four trades shared common patterns while demonstrating versatility:
1. Double Divergences Increase Reliability
BTC showed two bearish divergences within 10 hours—both delivered.
2. Extreme Scores Predict Strong Moves
• BTC Score -0.885 → +10.1% rally
• NVDA Score 1.000 → 6-10% drop
• GBP Score -0.900 → reversal confirmation
3. Reversal Divergences = Perfect Pivot Points
All exits occurred at opposite divergences, capturing full swings.
4. Works Across All Market Types
From 15M daytrading (NVDA) to 4H swing (ES), signals remained consistent.
─────────────────────────────────────────────────────────────
Performance Summary:
Asset Market TF Strategy Profit Duration Special
BTC/USDT Crypto 2H Double Div ~18.4% 7d Full cycle
NVDA Stocks 15M Score 1.0 6.4-9.8% 4-25h No div entry
GBP/USD Forex 30M Divergence 1.05% 2.3d Conservative
E-mini S&P 500 Futures 4H Divergence 3.89% 5.5d 91% ROI leverage
Win Rate: 100% (5 out of 5 trades)
═════════════════════════════════════════════════════════════
PRACTICAL TRADING GUIDE
Basic Reversal Strategy:
Entry:
1. Wait for divergence (green/red triangle on chart)
2. Check Score: |Score| > 0.5 strengthens signal
3. Score near ±1.0 = extreme reversal zone
4. Enter +2 bars after divergence (accounts for pivot delay)
Exit:
• Conservative: opposite divergence
• Aggressive: Score crosses opposite threshold (±0.5)
• Stop-loss: ATR × 2-3 from entry
─────────────────────────────────────────────────────────────
Settings for Different Styles:
Scalping/Intraday (5-15M):
Pivot Lookback: 2 (aggressive)
Cloud Mode: Gradient
MTF: off or 1H
Swing Trading (1H-4H):
Pivot Lookback: 3 (balanced)
Cloud Mode: Threshold
MTF: on, 4H-D, Reduce mode
Position Trading (Daily):
Pivot Lookback: 5 (conservative)
MTF: on, Weekly, Block mode
─────────────────────────────────────────────────────────────
When NOT to Trade Divergences:
• Tight range: Score oscillates within ±0.2
• Low volatility: clouds don't form or are very weak
• Against strong trend without MTF: gray triangles = filtered signals
─────────────────────────────────────────────────────────────
Combining with Other Tools:
RSS3 is a confirmation tool , not a standalone system:
• Use support/resistance levels for targets
• Confirm with volume (OBV, CVD) for reversal strength
• Consider fundamentals during news events
• Apply risk management: max 2-3% capital per trade
═════════════════════════════════════════════════════════════
CONCLUSIONS
Analysis of four different assets during November 2025 demonstrated RSS3's effectiveness across markets and timeframes:
✅ High Returns: 18.4% on BTC in one week via full cycle
✅ Consistency: 100% win rate across all four trades
✅ Versatility: 15M to 4H timeframes, all asset classes
✅ Leverage Efficiency: 91.4% ROI on E-mini futures margin
Key advantages over classic divergences:
1. Quantitative strength scoring: Score -1 to +1 vs binary yes/no
2. Automation: no manual pivot hunting
3. MTF context: filters counter-trend signals
4. Adaptive clouds: visualizes pressure accumulation zones
Alternative entry methods demonstrated:
• Traditional: divergence-based (BTC, GBP, ES)
• Modern: pure Score extremes (NVDA)
• Both work with appropriate risk management
The indicator is free and can serve as either a complementary filter to your existing system or the foundation for a complete reversal trading strategy.
🔗 Download RSS3: Get it on TradingView
═════════════════════════════════════════════════════════════
DISCLAIMER
This article is provided for informational and educational purposes only and does not constitute financial, investment, or trading advice. All trading involves risk, and past performance does not guarantee future results. Users are solely responsible for their own trading decisions and should conduct independent research or consult with a qualified financial advisor before making any investment decisions. The author assumes no liability for any losses incurred through the use of this information.
$BTC Alhamdulillah Catching Every Move! Hello CRYPTOCAP:BTC traders! Alhamdulillah I hope my CRYPTOCAP:BTC updates are proving really helpful for you all.
Feels like I’ve got blueprint of #Bitcoin right in my hands 😎💎🚀

Bitcoin Analysis — Pre–New York Session SetupFear & Greed Index: 22 — still in Fear.
👋 Hello Traders! Let’s dive into today’s Bitcoin analysis.
Today’s outlook isn’t very different from yesterday —
we simply have more structure, more clarity, and the market has moved deeper into our expected zones.
And since I wanted you to have this before the New York session, here we go:
📰 Weekly Outlook — No Clear Signal Yet
On the weekly chart, we’re printing something close to a Doji candle.
❓ Does this weekly candle tell us anything significant?
➡️ Not really.
The market had a sharp drop, and now it’s simply resting — completely normal.
I’ve mentioned in previous weekly scenarios that we might range until the end of the year,
and so far the market is following that exact script.
But does ranging mean no long or short positions?
❌ Absolutely not.
It simply means:
Take profits earlier
Avoid holding trades for too long
Do NOT treat mid-range setups as long-term positions
🎯 Key Higher-Timeframe Levels
Two extremely important levels remain:
$78,000
$100,000
These are the levels that can confirm a long-term trend shift (up or down).
They’re also the “heavyweight” breakout levels —
meaning:
When you’ve captured several good R/R trades,
one of them is worth leaving open in case these levels break.
Because if either level breaks, the move could be so sharp that entering afterward becomes nearly impossible.
📉 Lower Timeframe Structure
Now let’s zoom in:
Sellers are attempting to push price toward $84,000.
Two scenarios from here:
Scenario A — Strong Sell Continuation
If sellers manage to reach $84k,
the next short setup becomes straightforward:
📌 Short continuation toward $78,000
(ONLY if momentum remains strong after $84k touches or breaks).
⚠️ Scenario B — Sellers Fail
If sellers show weakness and fail to push price to $84k,
Bitcoin will likely form a range between $84k – $92k.
Inside that box,
only short-term trades make sense — no swing positions.
🚀 Bullish Scenario
If price returns upward toward $92,000,
I will personally open a long position.
🔍 4H Compression Zone — Important!
Bitcoin has created a compression structure between:
$89,000 and
$89,700
This zone is crucial.
Break upwards → I will long altcoins with bullish correlation to BTC.
Break downwards → I will short BTC or altcoins with bearish correlation to BTC.
⚠️ But only AFTER real volume enters the market.
Always track volume — it’s everything in this phase.
✔️ Final Words
Thanks for reading today’s analysis!
I hope you have a great day full of focus and profits.
And remember:
💛 Risk management isn’t optional — it’s your survival tool.
Stay safe, stay sharp, and see you in the next update! 🚀📊

Bitcoin Compresses Near FVG, Pullback Likely Before BreakOn the H4 chart, Bitcoin is clearly entering a compression phase: volatility is shrinking, volume is fading, and price is tightly squeezed between overhead supply and underlying demand. This type of structure typically reflects a “hidden energy” phase before a decisive expansion.
At the moment, BTC is ranging between 90,000 and 92,000, gravitating around the 91,500–92,500 FVG where price is repeatedly rejected. On the downside, the Ichimoku cloud aligns with the 89,500–90,000 FVG and continues to hold firm, signalling equilibrium rather than aggressive selling. Sellers are unable to push price lower, while buyers are not yet committing enough capital to force a breakout.
Two Fair Value Gaps define the battlefield. The 91,500–92,500 zone acts as a strong supply pocket; only a clean H4 close above 92,500 would confirm a bullish continuation. Conversely, the 88,500–89,500 FVG represents the key demand area — a break below it would reintroduce short-term bearish structure.
Given the current compression and the fact that the lower FVG remains partially unfilled, I continue to favour a final liquidity sweep to the downside before a stronger upside move. If clear buying pressure emerges from the lower FVG, the subsequent breakout is far more likely to be decisive and sustainable.

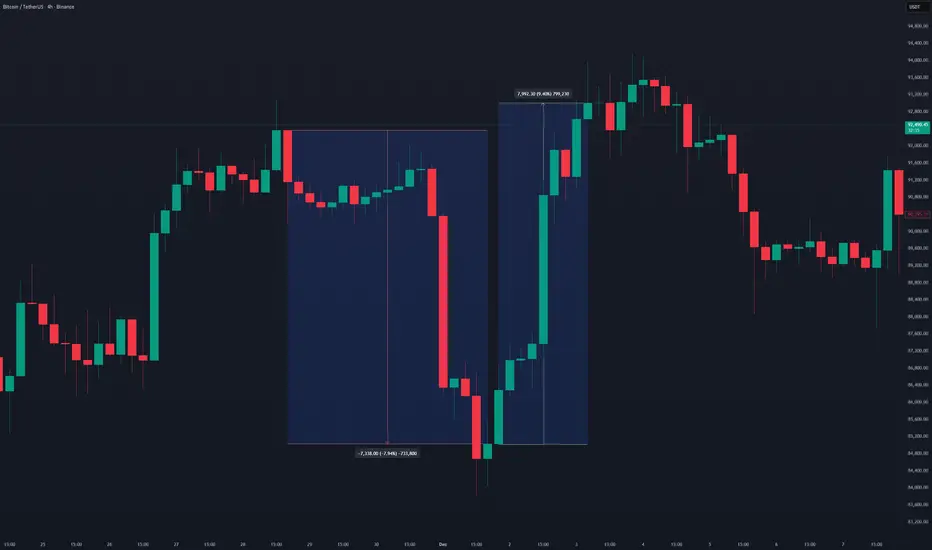
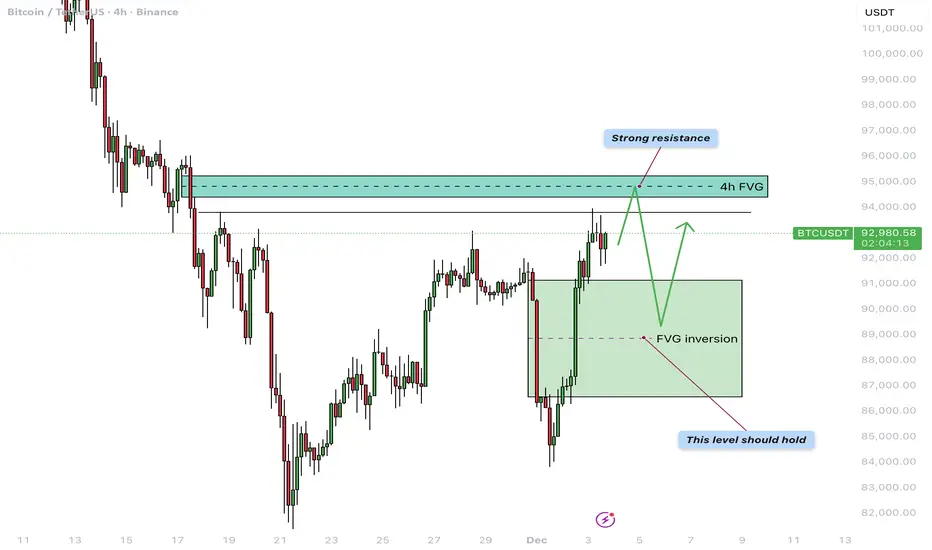
Bitcoin - $95.000 before a correction?Bitcoin finds itself at an important turning point once again after a sharp decline followed by a strong recovery. In this update, we will cover the reaction to the previous 4H bearish FVG, the newly formed 4H FVG inversion acting as support, the next resistance level around 95,000 dollars, and the recent liquidity sweep.
4H Bearish FVG Inversion
Two days ago, BTC made a strong downward move that reversed a large part of the earlier rally and collected deep liquidity beneath local lows. During this drop, a clear 4H bearish FVG was formed, acting as a supply zone. Yesterday, however, BTC reclaimed this entire FVG with conviction: the price broke through it and closed multiple candles above the zone. This shift flips the area from supply into demand, meaning the former bearish FVG has now transformed into a 4H FVG inversion. The green box on the chart now represents the primary support zone, ideally holding during any pullback.
4H Bearish FVG Around $95,000
Above the current price lies the next 4H bearish FVG around roughly 95,000 dollars, aligning with a previous consolidation and distribution phase. This region acts as strong resistance and is the next logical magnet for the ongoing recovery move. As long as the FVG inversion beneath price holds, it is reasonable to expect BTC to gradually move toward the 95k area. A clear reaction is likely once this zone is reached—ranging from a brief rejection and sideways consolidation to a potentially larger reversal if sellers become aggressive again.
Liquidity Sweep
Recently, BTC briefly pushed above a local high and pulled back immediately afterward, creating a clear liquidity sweep on the chart. This move wiped out the stops of late shorts as well as breakout longs but did not yet lead to immediate continuation to the upside. After such a sweep, the question becomes whether the market can gather enough buyers to fuel the next impulse toward the higher FVG, or whether price will first drop back toward the inversion support to gather liquidity there. The reaction at current levels will therefore provide important insight into short-term direction.
Conclusion
Because of today’s liquidity sweep, a direct correction from the current price is very possible, especially if short-term traders take profit after the strong bounce. However, the base scenario remains that BTC could still make one more push upward toward the 4H bearish FVG around 95,000 dollars, where a more significant reaction is expected. Such a move would fit perfectly within a structure where resistance is tested first, followed by a pullback to retest the new inversion support—confirming whether the recent reversal has real strength behind it.
-------------------------
Thanks for your support. If you enjoyed this analysis, make sure to follow me so you don't miss the next one. And if you found it helpful, feel free to drop a like 👍 and leave a comment 💬, I’d love to hear your thoughts!
Consistency: The Real Market Hack!Every trader wants consistency.
But very few understand what consistency actually means.
Consistency is not:
❌ winning every trade
❌ predicting the market
❌ avoiding losses
❌ being perfect
Consistency is built long before you press the buy (or sell) button.
Here’s what consistent traders all have in common:
1️⃣ They Repeat the Same Process Every Day!
Consistency comes from repetition; not randomness.
The best traders don’t have a different plan for every chart.
They use the same routine, the same checklist, the same rules.
Clarity replaces guesswork.
2️⃣ They Trade Only When Their System Shows Up!
Consistency is not about taking more trades.
It’s about taking only the trades that match your edge.
No signal = no trade.
No confluence = no risk.
No clarity = no entry.
Most inconsistency comes from forcing trades that never belonged in the plan.
3️⃣ They Accept Losses Without Breaking Structure!
A consistent trader still loses, they just don’t fall apart when it happens.
❌They don’t double their risk.
❌ They don’t chase entries.
❌ They don’t change strategy mid-trade.
They take the loss the same way they take the win:
within the system.
4️⃣ They Focus on Long-Term Data, Not Single Trades!
You can’t judge a strategy by one day, one week, or even one month.
Consistency is measured across:
✔ dozens of trades
✔ multiple cycles
✔ all market conditions
Professionals think in probabilities.
Beginners think in outcomes.
The Real Secret?
Consistency is not an ability.
It’s a decision you make every day:
➡️ Follow your rules
➡️ Manage your risk
➡️ Trade your edge
➡️ Ignore the noise
When your habits become consistent, your results eventually follow.
⚠️ Disclaimer: This is not financial advice. Always do your own research and manage risk properly.
📚 Stick to your trading plan regarding entries, risk, and management.
Good luck! 🍀
All Strategies Are Good; If Managed Properly!
~Richard Nasr

symmetrical triangle pattern forming in BTC✅ 1. Measure the triangle height
A symmetrical triangle target =
Height of the widest part of the triangle → projected from breakout point
From your chart:
Top of triangle: ≈ 96,600 USDT
Bottom of triangle: ≈ 80,600 USDT
Height = 96,600 – 80,600 ≈ 16,000
So the measured move is ~$16,000.
📈 2. Bullish breakout target
Breakout area looks around 92,000–94,000 depending on how you anchor it.
Using 93,000 as midpoint breakout zone:
Bullish target = 93,000 + 16,000 = 109,000 USDT
Bullish target range:
➡️ 108,000 – 110,000 USDT
This lines up with the psychological 110K zone, which would likely create resistance.
📉 3. Bearish breakdown target
Breakdown would occur near 88,000–90,000 depending on exact slope.
Using ~89,000 as average:
Bearish target = 89,000 − 16,000 = 73,000 USDT
Bearish target range:
➡️ 72,000 – 74,000 USDT
This also lines up with the major liquidity zone around 72K–74K.
🎯 Final breakout targets
Bullish breakout target:
⭐ 108,000 – 110,000
Bearish breakdown target:
⭐ 72,000 – 74,000

BTC Technical analysis 4H time frame📊 BTCUSDT 4H Analysis
Trend Analysis
BTC is still in a medium-term downtrend because price remains under the 4H EMA ribbon, especially the heavy red EMAs (bearish control).
But short-term trend has flipped bullish, as BTC is reclaiming the lower EMAs and pushing into the resistance cluster at $92,000 – $94,000.
Key Support & Resistance Levels
Resistance
4H R1: $92,200
4H R2: $93,000
4H R3 / Major Resistance Zone: $93,500 – $94,000 ← very strong supply
Support:
Major Support: $89,800 – $90,300
Critical Support: $86,000 – $87,000
Local ascending trendline support also aligns with the critical zone — strong confluence.
Candlestick Interpretation
Current candlestick structure shows a series of strong green-bodied candles approaching resistance. No reversal pattern yet.
BTC is attempting a controlled bullish continuation sequence, but confirmation requires a close above $92,300 to validate a trend reversal attempt.
Indicators & Oscillators
MACD crossed bullish
Histogram is increasing
Momentum is rising but still below the zero line → trend reversal not confirmed yet
EMA Ribbon- BTC is fighting the mid-band. A breakout above $93k would flip the ribbon bullish on 4H
Indicators show early bullish strength, not yet full trend reversal.
Volume Analysis
Volume increased on the bounce from $89k, but buying volume approaching resistance is not strong enough yet. For a breakout above $94k, we need volume expansion + long candle body closure
Wave Analysis (Simplified Elliott Structure)
Current move looks like a Wave B upward correction unless $94k breaks. A break above $94k activates Wave 3, targeting $98.2k–$100k. Failure below $92.3k leads into Wave C downward to $88.5k then $86k
Intraday Trading (4H)
Long after confirmed 4H close above $92,300
SL: $91,200
TP1: $93,000
TP2: $93,500–$94,000
OR
Short rejection at $93,500–$94,000
SL: $94,450
TP: $92,200 then $91,500
Swing Trading (Multi-day)
Swing long only after daily close above $94k
SL: $91,800
TP1: $97,500
TP2: $100,000
Swing short if price loses $89,800
SL: $91,300
TP: $87,000 → $85,500
***NOT Fianacial advice, just a technical ananlysis***

BTC TO 61K Keep Eyes on Bitcoin 👀👀🤑
BINANCE:BTCUSDT BTC Making a bearish flag on 1D frame
Just keep your Eyes on it
====================================
we will entry (short) After breakout the flag
Entry Level : 88k
Target 1 : 80K
Target 2 : 74k
Target 3 : 61K
SL: 98.25K
===================================
I think Bitcoin will be very bearish in 2026, and we will see prices below 60k! It looked like sci-fi a few weeks ago, but this idea of 60k Bitcoin seems to be real.
Make sure you Follow me to see the market from another angle ❤️🕊️👌

88K IncomingA liquidity sweep under 88K is imminent. A lot of buy orders currently are likely to trigger a manipulation and a downtrend seeking the 88K region.


BTCUSDT // We cannot see regular closings above the Kaufman indicator in the area I have indicated with a circle. For an increase, we must look for at least 3 closings above the Kaufman indicator.

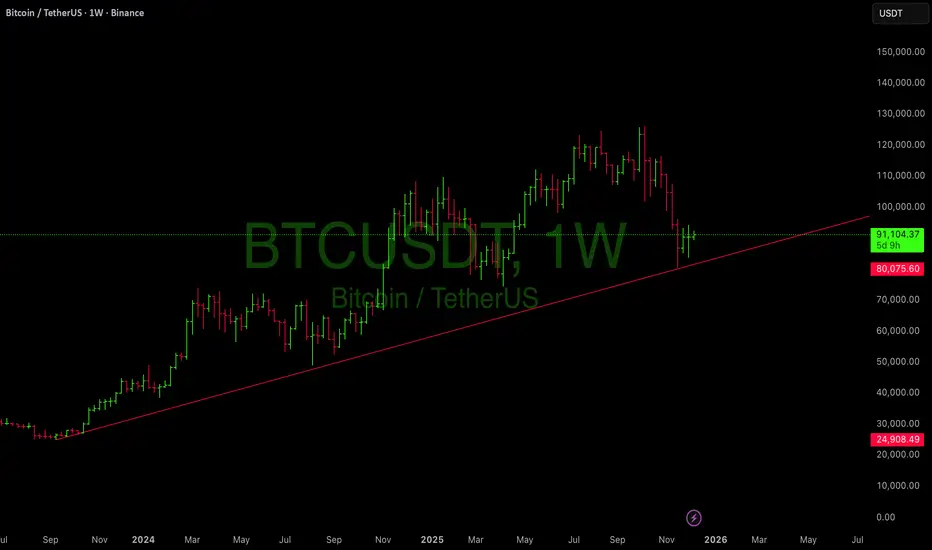
Bitcoin Monthly Analysis. Major Uptrend 2 Still HoldingBitcoin Monthly Chart.
Long-Term Structure Update
This chart highlights Bitcoin’s macro structure using major trendlines and key support levels.
Price is currently still trading above Major Uptrend 2, which has acted as long-term dynamic support since 2020. As long as Bitcoin remains above this line, the macro bullish structure remains intact.
The next critical level on the downside is the ~74,700 area, which aligns with the breakout-retest zone and long-term support. Losing this level on a monthly closing basis would shift the structure into a deeper correction.
As long as Major Uptrend 2 holds, monthly structure stays positive, even with current pullbacks.
This analysis focuses on long-term trend integrity rather than short-term volatility.

BTCUSD : Technical analysis Mini Demand Zone After Bearish Comes📊 BTCUSD 30-Minute Analysis — Reversal Zone + Volume Burst Setup
1. Market Structure Overview
On the 30M timeframe, BTCUSD is currently trading inside a corrective phase after rejecting the upper resistance area around $91,000 – $92,000. The price formed a rounded-top structure, indicating a gradual weakening of bullish momentum.
The market has been moving sideways with decreasing volatility, suggesting accumulation or preparation for the next move.
2. Major Drop & Formation of Fresh Reversal Zone
A major bearish move pushed BTC down into a strong Reversal Zone (RZ) positioned around:
**🔽 Key Reversal Zone (Demand Area):
$88,000 – $87,000**
This zone is significant because:
It aligns with previous reaction level from Dec 2
Strong buy-side volume burst previously originated here
Price has already shown a wick rejection, signaling buyer interest
This is a high-probability demand area where institutions previously entered the market.
3. Volume Burst Confirmation
Inside the Reversal Zone, the chart highlights a Volume Burst area.
Why Volume Burst Matters:
Shows strong buying pressure
Indicates absorption of sell orders
Confirms demand is active at this region
If BTC revisits this zone, buyers may aggressively defend it again.
4. Expected Short-Term Movement
Your chart shows two potential scenarios:
Scenario A – Bullish Reversal (Most Likely)
Price may dip slightly into the Reversal Zone
Strong buyers react at the volume burst area
Market forms a bullish reaction candle
Break above minor consolidation leads to upward continuation
Target Levels After Reversal:
$89,800 – Pattern Completion
$90,500 – Short-Term Resistance
$91,000 – Structural High Retest
Scenario B – Bearish Breakdown (Less Likely but Possible)
If the Reversal Zone fails:
BTC may slide toward $86,500 – $85,800
This would confirm a deeper correction phase
But current PA suggests buyers are preparing a move upward.
5. Pattern Must – Confirmation Zone
A label on the chart shows "Pattern Must" around $89,500–$89,800.
This is the confirmation level where:
Break and retest = bullish continuation
Rejection = temporary sideways / deeper pullback
This acts as the neckline for a potential reversal pattern.
6. Technical Summary
Bias: Bullish from Reversal Zone
Main Support: $88,000 – $87,000 (Strong Demand)
Immediate Resistance: $89,800
Trend Outlook: Accumulation → Possible Upside Reversal
BTCUSD is currently forming a technical base, and a move upward is expected once price reacts strongly inside the Reversal Zone.
🎯 Conclusion
BTC is approaching a high-probability buying zone backed by:
Reversal Zone
Previous demand
Strong volume burst
Rounded-top breakdown structure
Market preparation for pattern completion
A bullish reversal remains the primary expectation, with targets toward $89,800 – $91,000.

BTC: Awaiting Target HitI’ve been consistently advising to buy BTC below the 90K mark. Market rallies take time — keep a close eye on the 94K-96K resistance zone for now. The price will eventually surge past 100K. Sit tight for the breakout and stick to the long position strategy.
All signals have been 100% accurate for two consecutive weeks. I’ll keep delivering precise signals — act fast to get yours now.

Bitcoin Analysis – Market in a Fog of DoubtAlright traders, let’s jump into today’s analysis and see what the market is telling us 👇
As you can see, we’re still in that same area I told you about before —
we’re inside the secondary trend on the daily timeframe, meaning we’re simply correcting the larger downtrend we already had.
On the 4H timeframe, we still can’t call this an uptrend.
Why?
Because even though we are forming higher lows, buyers still don’t have enough strength to print higher highs — they keep creating equal highs instead.
So for now, the 4H trend is unclear ❗️
🎯 Key Levels That Define Everything
There are two major levels that will break this indecision:
93,500
89,100 – 89,800 zone
Whichever side breaks first — that’s where I’ll take a position with momentum.
Especially the 89,100 level, because that one matches my higher-timeframe bias.
📉 Risky Short Setup
I’ve also set a risky short trigger at 92,000.
This one needs another clean reaction before entering —
but if we get that reaction, it gives us a decent short setup.
⏳ Why Lower Timeframes Matter Right Now?
Because on higher timeframes we’ve just reached a support area,
and the market needs time to show a proper reaction.
That usually takes a while.
So right now:
✔️ Most confirmations come from lower timeframes
✔️ We secure profits quickly
✔️ We avoid holding long trades with no clear trend
That’s it for today’s analysis ❤️🔥
Make sure to listen to Powell’s speech tonight,
and never forget your risk management.
Stay profitable and stay sharp! 💰🔥

BTC – Trendline Retest Success | Momentum Reloading for Next LegBitcoin just completed a clean retest of its multi-year rising trendline, a structural level that has guided institutional accumulation since 2023. Price wicked below, tagged liquidity, and closed back above a classic bullish deviation → reclaim.
This type of structure historically marks the end of corrective phases and the beginning of new expansions.
📌 Key Bullish Factors
1. Long-Term Trendline Respect
Your chart shows a trendline starting from late 2023.
Price tapped it perfectly and is now holding above $80,000–$82,000, confirming:
Buyers stepped in where they were supposed to
Smart money defended the bullish structure
Heavy liquidation likely cleared weak longs
2. Weekly Candle Structure Turning
The last 2–3 weekly candles show:
Downward momentum slowing
Smaller bodies
Long wicks → buying from lower levels
A potential swing low forming at the trendline
Bitcoin is showing the early signs of seller exhaustion you typically see before a weekly reversal.
---
👉 The move tends to trap sellers before a strong leg up.
---
📈 Upside Targets (Weekly)
If BTC continues holding above trendline:
1. $98,000 – $102,000
→ First major liquidity pocket / inefficiency
2. $112,000 – $120,000
→ Prior breakdown zone + weekly imbalance
3. $135,000 – $150,000
→ Trend extension target / potential new ATH expansion
These are not promises they are structural destinations based on the weekly map.
---
## **🔻 Downside Invalidation**
The bullish thesis remains valid as long as Bitcoin doesn’t close a weekly candle below $80,000.
Break + close below would open deeper retracement into mid-70Ks.
But right now? The trendline holds strong.
---
🧠 Holistic Trader Insight
Institutional players accumulate on weakness, not strength.
When retail panics, smart money buys structure.
This entire move fits the textbook rules:
Trend intact
Liquidity swept
Structural level reclaimed
Momentum slowing into support
This is what early expansion phases look like.
#BTCUSDT.P 2H ChartPrice previously bounced off a discounted area of demand and left a freshly printed demand zone on its way up. In addition, it recently got rejected off a minor area of supply and it is consolidating showing no major movements. Price is expected to tap into our demand zone where we have placed our limits aiming to break the previous swing high at $94,185.

BTCUSDT — Correction Ending? Potential Bullish ContinuationAccording to signals from my custom indicator, the recent correction appears to be approaching its end.
Although the indicator itself is not shown on the chart, the analysis here is based on the same reversal conditions that it typically detects.
The market is currently holding above a key local support area, forming a potential higher low — a structure that often precedes bullish continuation. Price reacted similarly in previous cycles, where a series of higher lows led to upward momentum.
Key points of my analysis:
My custom indicator suggests that the corrective phase is weakening.
Price is stabilizing near support, showing reduced selling pressure.
Previous market swings formed similar patterns before moving higher.
A breakout above the nearest resistance zone could confirm the continuation of the uptrend.
This scenario reflects one possible outcome based on indicator-derived signals and market structure.
I will update the idea if conditions change.
