Overtrading - The Trap of 'One More Trade'....NOTE – This is a post on Mindset and emotion. It is NOT a Trade idea or strategy designed to make you money. If anything, I’m taking the time here to post as an effort to help you preserve your capital, energy and will so that you are able to execute your own trading system as best you can from a place of calm, patience and confidence.
Here’s a scenario:
You’ve had a good trade. Maybe two.
The system is working. The market is flowing.
But instead of stopping… you keep clicking.
You chase another setup. And another.
Soon the edge is gone and so is the self control!
Overtrading is one of the fastest ways to drain not just your account, but your energy and confidence too. I’ve been there (especially as I've dropped down to lower timeframes). I know how quickly it can creep in.
So here are some thoughts for you. Please take what resonates and ignore what doesn’t.
How overtrading shows up:
– You take trades outside your plan just to stay in the action.
– You increase size because you feel “in the zone.”
– You keep trading after losses to “win it back.”
– You tell yourself the market is full of opportunity and you don’t want to miss out.
– Your screen time becomes endless, even when setups are poor.
Emotional side:
Overtrading often hides a deeper need: For excitement, for control, for certainty. Your body feels restless, your mind convinces you there’s always another trade and your emotions swing between euphoria and regret. It’s not lack of knowledge that fuels this. It’s the inner pressure to do something.
So how can we get hold of this before it sabotages our intentions?
Shift your mindset
See discipline not as restriction, but as protection. Every trade you don’t take is just as important as the ones you do. Passing on noise preserves your edge for the moments that really count.
Practical tips … the How:
When you notice the urge to keep trading:
– Ask yourself: Would I take this trade if it were my first of the day?
– Set a daily trade limit and respect it.
Remind yourself: Staying in cash is a position too.
I hope this helps. Interested in hearing how do you recognise and manage overtrading when it creeps in?
BTCUSDT.3S trade ideas

BTC/USD) Ready for drop Read The captionSMC Trading point update
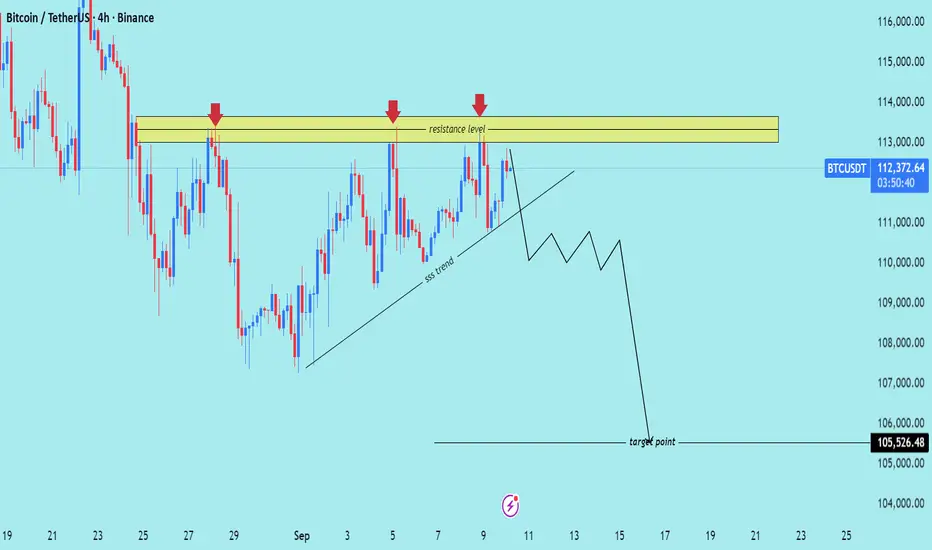
Technical analysis of Bitcoin (BTC/USDT) on the 4H timeframe.
---
Technical Breakdown – Bitcoin (4H)
1. Resistance Zone
Strong resistance level between $113,000 – $114,000 (highlighted yellow).
Price has tested this zone three times (red arrows), showing clear seller strength and liquidity rejection.
2. Structure Trendline
Market is following a short-term ascending support trendline.
Current projection suggests this trendline may break, which would signal a shift in momentum to bearish.
3. Bearish Outlook
If resistance continues to hold, a trendline breakdown could trigger strong downside momentum.
Target Point: $105,526.48 – a major demand zone where liquidity sits.
4. Trading Plan Idea
Entry: On rejection at $113K–$114K zone or confirmation of trendline break.
Stop Loss: Above $114,500 (to protect from false breakouts).
Take Profit: $105,526.48
---
Summary
Bias: Bearish
Reason: Multiple resistance rejections + trendline vulnerability.
Setup: Look for shorts from resistance or after trendline break → Target $105.5K zone.
Mr SMC Trading point
---
This setup is a classic SMC bearish scenario: liquidity trapped at resistance → trendline break → expansion down to collect liquidity at lower demand.
Please support boost 🚀 this analysis
BTC - Are the bulls looking for a liquidity grab?Market Context
Bitcoin is holding strong after bouncing from a higher support zone and is now pressing into an area packed with liquidity. The recent bullish price action has carved out multiple fair value gaps on the way up, each serving as confirmation of demand and strengthening the bullish structure. Above current price lies a major cluster of buy-side liquidity — a magnet for price.
Fair Value Gaps & Confirmations
On the way up, price created several bullish fair value gaps that have each been respected as support. The first, second, and now third retests into these imbalances show that demand continues to step in, absorbing supply and building pressure upward. Adding to that, a bullish inversion fair value gap (IFVG) has formed, giving extra confirmation that buyers are in control.
Liquidity Target Above
The most obvious draw for price is the heavy buy-side liquidity resting above recent highs. With so many stops positioned there, the market is incentivized to push higher and sweep that zone. The path toward it could involve another retest into one of the fair value gaps below before expansion takes place, or a direct continuation straight into the liquidity pocket.
Final Thoughts
This structure is showing textbook bullish strength: stacked fair value gaps, IFVG confirmation, and a clear liquidity pool overhead. Unless the market breaks back below the deeper support zone, the expectation remains a run into buy-side liquidity.
If this breakdown sharpened your view, a like is appreciated — and I’d love to hear from you: do you expect a retest first, or do we shoot straight into liquidity?

BTCUSDT 2Hour Time frameBTC/USDT 2-Hour Snapshot
Current Price: $112,349.00
Change: -0.29% from the previous close
Intraday High: $112,891.00
Intraday Low: $110,812.00
🔎 Technical Indicators
Relative Strength Index (RSI): Neutral
Moving Averages:
7-period MA: $112,376 (short-term support)
25-period MA: $111,484 (medium-term support)
99-period MA: $113,049 (short-term resistance)
📈 Market Sentiment
Pivot Points:
Resistance: $113,650
Support: $108,666
📅 Outlook
Bullish Scenario: A breakout above $113,650 could signal a move toward $120,000.
Bearish Scenario: A drop below $108,666 may lead to further downside.
Overall Bias: Neutral, with mixed signals from moving averages and momentum indicators.

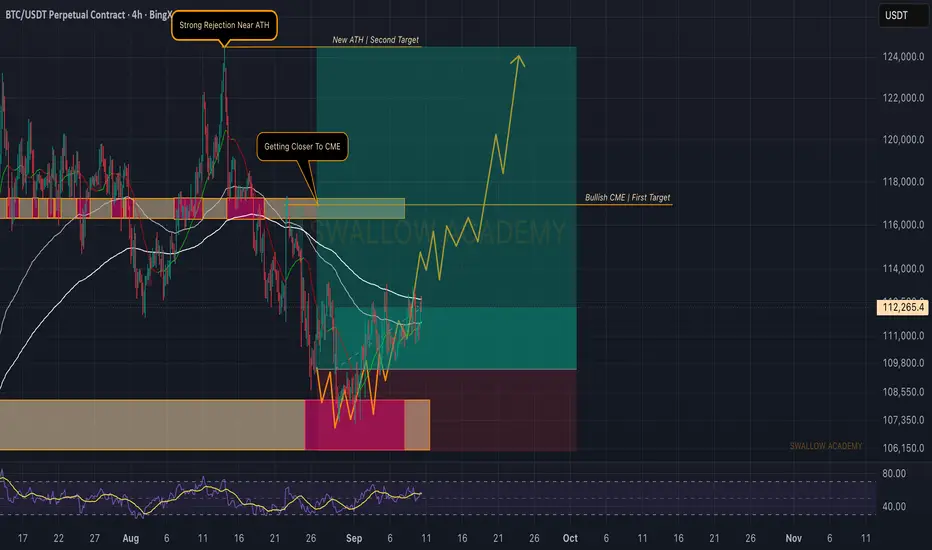
Bitcoin (BTC): Waiting For That Breakout of 200EMABTC still remains below the 200EMA, where we’ve now seen the third touch of that zone. Buyers continue to keep the pressure.
We keep waiting for the breakout — major target stays the same at the bullish CME gap near $116K–117K.
Swallow Academy
BTC 4H Analysis - Key Triggers Ahead | Day 38😃 Hey , how's it going ? Come over here — Satoshi got something for you!
⏰ We’re analyzing BTC on the 1-Hour timeframe.
👀 On the 4-hour timeframe of Bitcoin we can see that Bitcoin was under a descending trendline, and each time it touched this trendline it faced selling pressure. Bitcoin broke this trendline at the end of August, and since the beginning of September until now it has been ranging below the $113,000 resistance, where it has touched this level 3 times and then got rejected downward. Usually, these kinds of zones don’t break easily, and if they do, it is together with major global economic news.
⚙️ The key RSI zone of Bitcoin in the 4-hour timeframe is at 65. A swing scenario is considered for Bitcoin after the news, and if this news comes in favor of the risky market (crypto), it can move above the 65 range and even enter overbought territory.
🕯 The size, volume, and number of green candles have almost increased, while red candles are still accompanied by selling pressure. There is a taker-seller zone above, at the $113,000 resistance, that has kept the price down. With the release of news, a good wave of capital can enter or exit the market.
📊 On the 4-hour timeframe of USDT.D we can see that Tether dominance is in a very important support zone, and losing this support can bring good volume into the market. I think this support break can also happen with today’s PPI news. Tether dominance, like Bitcoin, was above a continuation ascending trendline, but now it has broken the trendline and is ranging below it. This shows us the importance of the news!
📊 On the 4-hour timeframe of BTC.D we can see that Bitcoin dominance is in a support zone, and with a 4-hour candle that looks like multiple profit-taking it got supported and moved upward. Although the move is small, we should pay attention. The resistance zone of Bitcoin dominance is at 58.36%, and the support zone is at 58.06%. Losing these zones can give altcoins very strong moves.
🔔 Bitcoin is now under an important resistance at $113,000. If this zone is broken, it can move upward again. A very strong support zone is also built by maker buyers at $107,627, which is quite far from the current price. For a long position, wait until the taker-seller zone is taken out with a whale candle and then enter on the pullback. Also pay attention that altcoins can give us the most profit during this period when both Bitcoin dominance and Tether dominance are dropping.
❤️ Disclaimer : This analysis is purely based on my personal opinion and I only trade if the stated triggers are activated .


BITCOIN Quick Buy Trade with the whalesBased on my analysis of on-chain data and liquidity flow, here is what I am seeing:
I've noticed a large buy order in the green zone between 110,600 and 110,500, which may push the price higher.
Additionally, there are large whale buy orders at the strong support of 110,000, with options contracts clustered there.
This will also contribute significantly to pushing the price up.
My Strategy:
✅ I will be taking a buy position if the price drops to the green zone between 110,600 and 110,500.
I will also take another buy position if the price drops to 110,000.
Targets
🎯 TP1: 112,600
🎯 TP2: 113,400
Disclaimer
This is not investment advice. I am only sharing my personal trade setups. Please always do your own research before trading.
Regards 🌹

BTCUSDT 1D Time frame 📊 BTC/USDT Daily Snapshot
Current Price: $112,493
Change: −0.37% from the previous close
Intraday Range: $110,812 – $113,029
Market Cap: Approximately $2.2 trillion
P/E Ratio: Not applicable (Bitcoin is not a stock)
Beta: Not applicable (Bitcoin is not a stock)
🔎 Key Levels
Resistance:
R1: $113,000 (recent high)
R2: $116,000 (next resistance zone)
Support:
S1: $110,800 (immediate support)
S2: $107,000 (next support level)
S3: $102,000 (longer-term support)
📈 Technical Indicators
RSI (14): 43 — Neutral, indicating balanced buying and selling pressure
MACD: Bullish crossover observed, suggesting upward momentum
Moving Averages:
5-day SMA: $111,500 — Buy signal
50-day SMA: $112,830 — Resistance level
200-day SMA: $101,000 — Long-term support
Stochastic Oscillator: Oversold, indicating potential for a bounce
📌 Market Sentiment
Catalysts: Positive momentum following recent gains and analyst upgrades.
Sector Performance: Cryptocurrency market showing strength, with Bitcoin leading gains among peers.
Options Activity: Significant trading in call options at $113,000 strike price, indicating bullish sentiment.
📅 Outlook
Bullish Scenario: A breakout above $113,000 could lead to a push toward $116,000 and higher.
Bearish Scenario: A drop below $110,800 may test support around $107,000.
Overall Bias: Moderately bullish, with positive momentum but facing near-term resistance.

BTC just confirmed a Double Bottom in 1hBitcoin is currently respecting the Double Bottom pattern.
After forming the first and second lows, price broke above the neckline with strong momentum, signaling a potential bullish reversal. If this breakout sustains, the pattern projects further upside continuation, aligning with classic technical analysis strategy.

BTCUSDT 4Hour Time frame📊 BTC/USDT Snapshot
Current Price: ~$112,419
Range (Intraday): $110,812 – $113,138
Change: Around –0.5% from the last close
🔎 Key Levels (4-Hour Focus)
Support Zone: ~$106,000 (recent double-bottom area)
Current Pivot: ~$112,000 (key resistance and decision zone)
Next Resistance: ~$117,000 (if breakout holds)
📉 Technical Indicators (4-Hour Context)
RSI: In the mid-50s → showing moderate strength after bounce
MACD: Slightly positive → early bullish signal
Momentum: Neutral to bullish; recovery attempt underway
📌 4-Hour Outlook
Bullish Case: If BTC closes firmly above $112,000, it could push toward $117,000.
Bearish Case: If rejection happens at $112,000, price may slip back toward $110,000 → $106,000 support.
Bias: Consolidation with bullish potential, but resistance needs to be cleared.
✅ Conclusion: On the 4-hour chart, BTC/USDT is in a neutral-to-bullish phase, holding above its recent bottom. $112K is the key battleground — breakout could fuel upside momentum, while rejection risks another retest lower.
BTC target 145 before crashingBTC is moving in a rising channel my target is 145k area in next month, where I expect the end of bullish cycle started in 2020 and a massive crash of bitcon to 40k-50k range

BTC Analysis 8/9-Psychological ResistanceFundamental Analysis:
Gold was supported to rise strongly to 3600 at the end of last week when the Nonfarm payrolls were released weaker than expected ==> Making the FED certain to cut interest rates by at least 0.25% on September 17. Even the expectation of the FED cutting interest rates by a strong 0.5% has increased - If the CPI data released next Thursday is weaker than expected, the expectation of a 0.5% cut in September will continue to increase and support the price of gold to increase.

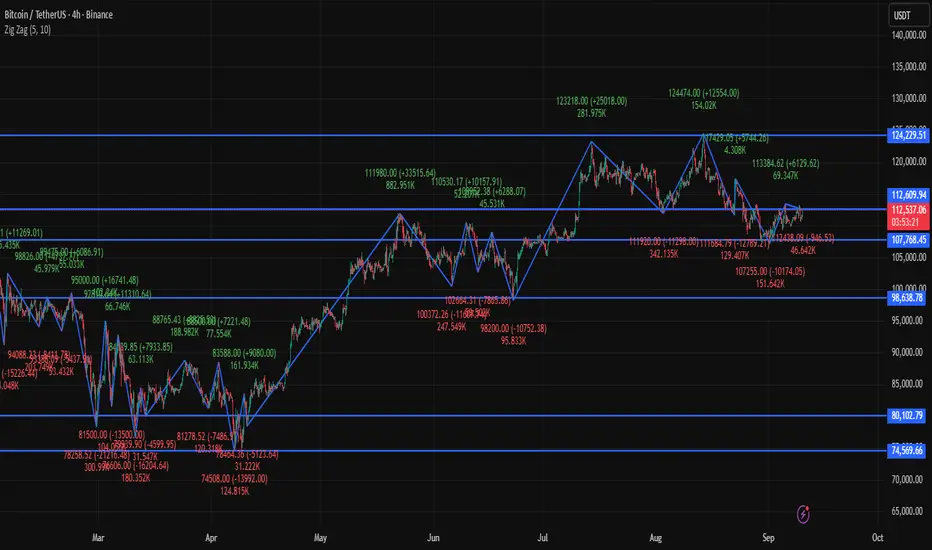
Bitcoin Faces Bearish Reversal With Potential Dip Toward $98K !!Bitcoin (BTC) Market Analysis – Current Outlook
Bitcoin has stepped out of its primary bullish trend, after two successful resistance touches around $112K and $124K. This movement has established a potential double-top pattern, which historically signals a bearish reversal.
Currently, BTC is trading within a mini bearish trend, consolidating at a confluence zone that aligns with past market reactions. Price action is at a decision point:
Bullish scenario: A rebound from current levels and reclaim of momentum above $113K to $124K could negate the bearish setup, confirming that the recent move is only a corrective pullback.
Bearish scenario: Failure to hold this zone may trigger further downside, with potential continuation toward the $98K support area, which serves as the next major demand level.
BTC is now at a critical junction, and traders should watch for confirmation signals before positioning.

BTCUSDT – What’s the Next Trend?👋Hello everyone, what are your thoughts on BINANCE:BTCUSDT ?
Although the price weakened at times following U.S. economic reports, buyers managed to defend the 110,000 USD support, which is considered a positive signal. However, overall momentum has been limited since the last strong rally. Sideways movements have continued up to now, with Bitcoin currently trading around 111,100 USD.
On the H1 chart, BTC is moving inside a box, forming an accumulation pattern. The preferred strategy is to look for buy and sell opportunities around support and resistance levels. In case of a breakout, it’s safer to wait for a pullback before entering.
And you—what do you think about BTCUSDT’s trend? Share your thoughts in the comments or leave a like if you agree with my view.

Just a idea about BTC BTC/USDT (2h) – Overall still bullish short term ✅
Price is holding support and forming a breakout pattern. As long as support holds, bias remains bullish with potential upside targets around 112,800+. A break below 110,900 would invalidate this setup. Still learning, so feedback is welcome 🙏📈

BTCUSDT 2H – Price Compression Near Breakout | WAITING FOR CONFBINANCE:BTCUSDT
Structure | Trend | Key Reaction Zones
BTC is consolidating in a compression zone between support 110,940 and resistance 113,292, with a clear downtrend line rejecting multiple times. Current structure suggests a breakout is approaching.
Market Overview
Price has respected demand zones but remains capped by the descending trendline. Bulls must defend 110,940 support to sustain momentum. A breakout above 113,292 could accelerate bullish momentum toward 117,400 supply zone. Failure to hold support may trigger strong downside continuation.
Key Scenarios
✅ Bullish Case 🚀 → Break and hold above 113,292 → Price targets 114,500 – 117,400.
❌ Bearish Case 📉 → Break below 110,940 → Downside opens to 108,000 – 107,442 liquidity zone.
Current Levels to Watch
Resistance 🔴: 113,292 – 114,500 – 117,400
Support 🟢: 110,940 – 108,000 – 107,442
Trade Setup (Short-Term)
🎯 Target 1: 113,292
🎯 Target 2: 114,500
🎯 Target 3: 117,400
⛔ Stoploss: 110,940
⚠️ Disclaimer: For educational purposes only. Not financial advice.

Volume Profile Explained with Application BTC Forecast09/09/2025Price isn’t held up by your tweets — it’s held up by volume. And volume says lower.
By walking through the profile step by step, I explain how:
The thick high-volume nodes act as magnets for price.
The thin low-volume zones provide little support and often get filled quickly.
Bitcoin’s current setup suggests price is more likely to retrace lower to retest the areas where most of the trading volume occurred.
If you’ve ever wondered how to connect the dots between the volume profile and the order book, or why market structure points down when everyone else says up

BTC 1D – Retesting Fair Value Gap, Break Lower or Bounce?BTC is consolidating after breaking its trendline, with price now hovering above a daily fair value gap between $104K–106K. This zone aligns closely with the EMA 200, making it a critical area to watch.
If this FVG holds, bulls could see a push back toward $112K and potentially $123K resistance. A breakdown, however, exposes the next liquidity and FVG region near $92K, with major support further down at $76.5K.
The Stoch RSI sits mid-range, leaving room for volatility either way.
📊 Key focus: does BTC fill and hold the $104K–106K FVG, or break lower into the next imbalance?

$100K Remains the Critical Psychological Level for BTCCRYPTOCAP:BTC just broke below a key trendline, showing weakness in momentum. The zone that once acted as support has now flipped into resistance, which explains why price is struggling to push higher.
At the same time, there’s a strong demand zone and a big psychological level sitting around $100K. If price pulls back deeper, that’s where buyers are most likely to step in aggressively.
Right now, BTC is consolidating inside a small upward channel. A breakout from this channel will decide the next move, either reclaiming resistance or retesting that $100K demand area.
DYOR, NFA
Stay tuned for more updates

BTC Price Prediction and Elliott Wave AnalysisHello friends,
>> Thank you for joining me in my analysis.
- As I mentioned in my previous idea, we are still moving in this micro correction wave X likely the pink color here.
- Now we have these movements for the white wave B, it will be a harder wave to analysis, So I have now two scenarios for it
1st: if it will break 110K, I will extend this white wave B to be as the Blue WXY waves.
2nd: if it will back to break 113.3K, I will monitor 1D TF, and I think we will watch an irregular flat pattern for this white wave B to be as the yellow WXY waves .
>> Reminder:
* For the bigger imagination of the BTC path, we are still moving into the Orange wave A of the final White C for ABC from its beginning.
* For the smaller imagination of the BTC path, we are still moving into the Blue wave B of the final Green C for the upper Orange wave A.
* For the tighter imagination of the BTC path, I think we are still moving into the correction wave A for the upper Blue wave B.
Keep liking and supporting me to continue. See you soon!
Thanks, bros

short btcI expect... why? Because it's the month of ghosts and we haven't even broken through the $112,000 barrier... resistance rejected and we're going down, simple as that.

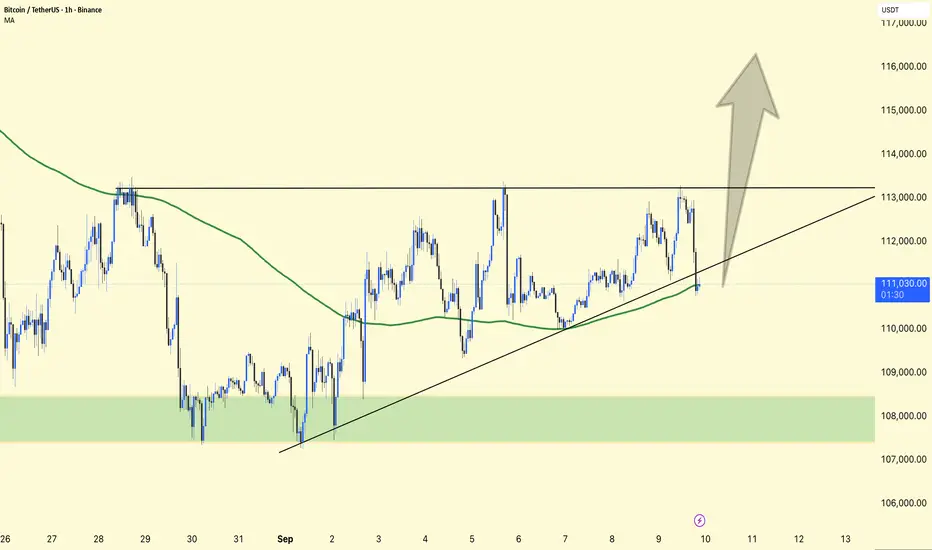
BTCUSDT 1H Chart Analysis !!BTCUSDT 1H Chart Analysis
Current Price
BTC is trading near $111,000, sitting right on top of the trendline support.
The 111K MA (Moving Average) is also aligned here, adding extra strength to this support zone.
Resistance Zone
The most important level above is $113,000.
This has acted as a ceiling multiple times; a clean breakout with volume could send BTC quickly higher.
Bullish Scenario 🚀
If BTC breaks $113K with strength, the next upside targets are:
$115,000 (psychological resistance)
$117,000 (measured move from the ascending structure).
Strong breakout here may trigger short squeezes, fueling momentum.
Bearish Scenario ⚠️
If BTC fails to hold the trendline + MA support, price could drop back into the $109K–108K demand zone (highlighted green box).
Below $108K, downside risk increases sharply.
Market Context
Structure is higher-lows, showing buyers still defending dips.
But BTC is stuck in a range between support ($111K) and resistance ($113K).
BTC is at a decision point.
✅ Break above $113K = bullish continuation toward $115–117K.
❌ Rejection and break below support = pullback into $109–108K demand zone.