EcoByG Bitcoin Daily Analysis #4 — Daily BTC Market UpdateWelcome to My Analysis.
Now, let’s break down today’s Bitcoin structure.
On the daily timeframe, the structure remains clearly bearish.
Price is still trading below broken structures and under several major resistance levels.
After the strong drop, Bitcoin is now in a corrective phase within a downtrend.
Price is currently ranging between the two key levels:
83,900 – 93,700
From a price-action perspective:
Candles have formed a Lower High
Price still does not have the strength to create a Higher High
→ This confirms ongoing weakness.
A Demand Zone (red box) has formed around 83–84K, which caused the previous strong recovery.
For now, price is trapped between the descending dynamic trendline and the 84K support.
Volume — the most important factor for me
Low volume at the bottom → indicates uncertainty and lack of decision-making
No strong reversal volume yet
→ Buyers are not showing real commitment.
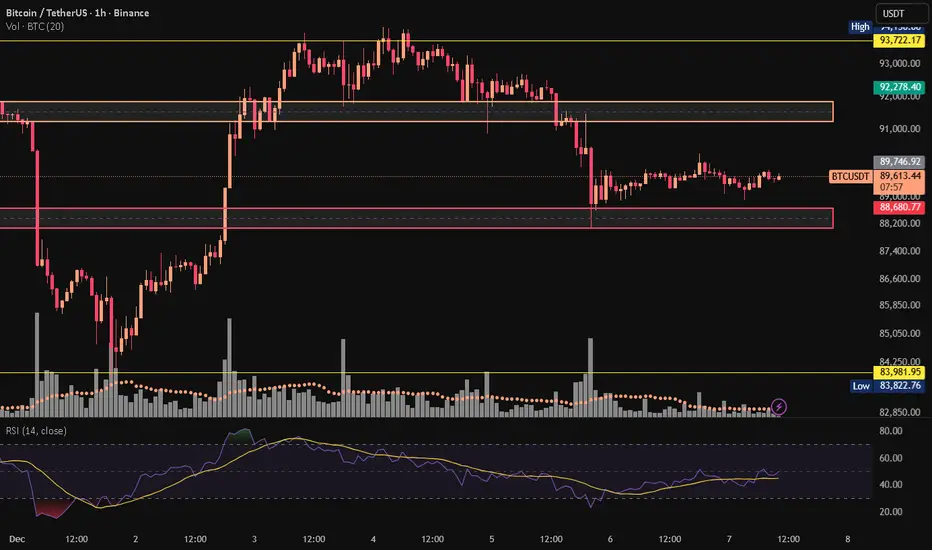
What’s happening on the 1H timeframe?
There are two major zones:
🔴 Supply Zone — 91,800 to 92,300
This is the top of the previous range
Price entered it multiple times but got rejected
Last entry → sellers immediately took control → drop to the low
Key signal:
Each time price enters this box, we see many upper wicks and rejections
Volume does not increase → meaning no strong buyers attempting a breakout
Result: Range and rejection
🟢 Demand Zone — 88,250 to 88,700
This zone has been extremely clean on the 1H:
First touch → strong reaction + fast rebound
Volume spiked exactly at the touch → showing real buyers
Candles have strong lower wicks
Price has revisited the zone several times without breaking it
Key signal:
As long as this zone holds,
the short-term trend = bearish range with strong support.
What does volume tell us?
🔸 Volume on the drops → high
→ Sellers were serious, intentional.
🔸 Volume during pullbacks → low
→ This confirms the move is corrective, buyer strength is weak,
and continuation of the downtrend is more likely.
🔸 Volume increased inside the demand zone
This is the most important signal of the entire chart:
When price touched 88,300–88,700,
a candle printed with above-average volume.
→ This confirms the demand zone has real buyer interest.
👈 So for now, this bottom is defendable.
Current Market Structure Summary
🔵 Higher TF (Daily): Bearish
🟠 Mid TF (4H–1H): Bearish range
🟢 Low TF (1H): Range with slight bearish bias
Meaning:
Primary trend → Bearish
Current structure → Range-bound
Entry triggers → Breakout of the range
Key Levels That Determine the Next Move
If 88,250 breaks:
Bearish continuation
Target → 83,900
If 92,300 breaks:
Range ends
Structure shifts bullish on higher timeframes
Targets :
93,700
100,565
⚠️ Risk Alert ⚠️
Futures are not beginner-friendly. These triggers require solid experience.
Before using them, study risk management and practice with the learning content here.
Trade ideas
BTC Down Soon?Bitcoin is currently testing a critical zone around $92-96K. Looking at the price action, we've seen multiple rejections from higher levels and price is now approaching an important support area.
Key Observations:
Price forming lower highs since reaching $126K
Multiple horizontal support levels below current price ($85K, $80K, $74K)
Rising trendline support from April lows being tested
Potential breakdown scenario marked with orange arrow targeting $74-75K area
Possible Scenarios:
1️⃣ Bearish scenario (orange arrow): If current support fails, we could see a move down to test the $74-75K zone, which was the previous low
2️⃣ Bullish scenario: Price holds above $90K and bounces back toward $100K+ resistance levels
The upcoming days will be crucial. Watch for volume confirmation on any breakdown or bounce.
What's your take? Bounce or breakdown? 📉📈
⚠️ DISCLAIMER: This is not financial advice. This analysis is for educational purposes only. Always do your own research and consult with a financial advisor before making any investment decisions. Trading cryptocurrencies carries significant risk.

BTCUSD Analysis - Major Supply Zone + Reversal1. Higher-Timeframe Context
BTC is currently trading inside a broad consolidation range after a strong impulsive leg to the upside followed by an equally sharp corrective decline. The market has created clear liquidity pockets both at the top and bottom of the range, suggesting price is hunting for inefficiencies rather than trending cleanly.
The current structure shows that BTC is in the middle of a retracement phase after rejecting the lower boundary of the range.
2. Impulse Move & Liquidity Grab
A significant vertical bullish impulse can be seen near the left side of the chart, creating a sharp displacement candle. This move broke short-term structure and left behind a clean imbalance.
After the rally, price failed to maintain directional continuation and rotated back lower, indicating the move acted more like a liquidity sweep rather than genuine trend continuation.
This is important because markets typically return to revisit these inefficient zones before deciding the next major direction.
3. Reversal Zone (Key Supply Area)
The highlighted green zone represents a high-probability supply area where:
Volume Burst: Indicates aggressive buy-side activity that may have come from late buyers or trapped longs.
Reversal Zone: This is the last major bearish origin block that caused the breakdown. Price re-entering this area signals a likely reaction.
A reaction here is expected because this zone contains both:
Unmitigated supply
Liquidity engineered above recent swing highs
This combination often creates a magnet for price and a turning point afterward.
4. Expected Price Behavior
Price is currently climbing back toward the Reversal Zone.
The chart suggests two possible scenarios:
Scenario A – Pattern Confirmation Before Short
Price taps the reversal zone, forms a bearish confirmation pattern (e.g., bearish engulfing, 2-candle reversal, break of intraday low), and begins trending downward.
This aligns with the diagram arrows showing rejection and continuation down.
Scenario B – Liquidity Grab Then Rejection
Price may wick slightly above the zone to collect liquidity, then sharply drop.
This is common behavior in areas with heavy wick rejections on history.
A clear message noted on the chart: “Need Pattern Here” – meaning that entries should only be attempted once the market shows clear reversal structure, not by blindly shorting the zone.
5. Short-Term Targets if Rejection Happens
If rejection confirms, potential downside targets include:
Return to mid-range
Retest of intraday support around recent consolidation
Lows near 90,800–91,200
Possible extension toward the range bottom if momentum increases
These levels are visible on the chart where previous structural lows were formed.
6. Market Psychology at This Zone
This area is important because:
Buyers who bought late in the impulse are trapped
Short sellers are waiting for optimal entries
Liquidity accumulates above swing highs
Institutions often push price into such zones to fill large orders
This creates a high-probability reversal environment, but confirmation is essential.

Bitcoin Analysis No Man s Land ! Alright, let’s get into today’s BTC analysis.
First thing I want to point out is that the Fear & Greed Index is sitting at 29!
Honestly, it’s surprising.
We’re basically at the same price we were 15 days ago, so what changed?
Did we just get used to this price?
Did sentiment shift without price moving?
It’s weird — but interesting.
📉 About the 4H Trend
Right now, we can’t really talk about a “4H trend” because the market isn’t moving cleanly in 4H or even 1H.
How long will this indecision last?
Until we either break below 89,000
or break above 93,500.
Until then, the only logical timeframe to trade is 15 minutes,
or we just stick to the daily timeframe until the market shows its true direction.
But PLEASE set alerts on 89,000 and 93,500,
because neither of these levels should be passed without a position.
📊 Bitcoin Dominance Talk
Now, about BTC dominance:
If your strategy — like mine — is momentum-based,
I honestly recommend stepping a bit away from Bitcoin trades for now
and focusing on altcoins that actually have a clean daily trend.
Examples: BAT, AVAX, and similar trending setups.
Why?
Because if a coin has a trend, risking in the direction of that trend is way easier and more logical
than forcing trades on Bitcoin when BTC currently has no real trend.
And of course, if Bitcoin’s momentum aligns with your altcoin direction,
even better — take the trade with full confidence.
🔚 Final Note
Market still hasn’t decided what it wants to do,
so my main recommendation remains the same:
👉 Risk management first. Always.
Stay sharp and stay profitable 🚀🔥

BTCUSDT - Signal#BTCUSDT - Signal
H4 - Formation of a triangle line retest + ABC structure on H1. Stop behind the low of the 2nd wave. When a fractal appears on H4, move the stop beyond the fractal.
Entry: 92137.62
TP: 97069.86 - 102633.68 - 107836.60 - 116236.75
Stop: 89430.90 - *91297.27

$BTC: Red Box Breakout Awaited! CRYPTOCAP:BTC is still following our plan with no changes. As expected bounced from marked demand area and is still trading within the range. I hope that once red box breaks out, we’ll finally see some good movement in both #alts and $BTC.
BTC SHORTBTCUSDT – Short Position Still Valid
Price continues to respect the bearish structure after the reversal.
We rejected the mitigation zone and stayed below the Alligator EMAs, confirming continuation.
• Short remains active
• Invalidation: Any 2H close above 89,632 – 89,892
• Structure: Lower highs + compression under resistance
• Expectation: Continuation lower after wedge breakdown
Targets:
1. 88,900
2. 87,700
3. 82,160 (main objective)
Still watching for a possible stop-hunt into the red zone, but bias remains bearish unless invalidated.

Short-term Trend Change After October Cascade(5:1-8.7:1RR)
Description
As recent FOMC meeting implied uncertainty of future rate cuts(on January) and multiple warnings got published from US investment banks it is true that BTC(or any other cryptocurrencies) got dried out of liqudity at the moment. Unlike what it was like in September of 2024, the reality is that new liquidity is not flowing in, relfected in multiple volume tracking protocols. In the case of macro uncertainty like now I would rather focus on technical analysis which have stayed consistent for more than three decades in financial market.
Technical Standpoint
In the chart, the BTC have clearly broke fist major resistance which was the support zone of October's liquidation cascade, the day when SUI dropped 70%. This now reflects short term trend change in 4h structure, which is not a welcome for the bulls. The main point of my analysis is the early 2025 major level acting as strong resistance(pre tariff double top neckline), forming ABC structure while failing to claim breakout above the level.
Opinion
so I have concluded to open a short position at current level and examined 15m time frame as well to place a stop loss. However, as I am uncertain if current structure is just a wedge before next impulse leg or if this is an actual consolidation before next drop. If being conservative, I would sell 50% of my bag at 0.618 level of current ABC and hold 50% until the 2024 accumulation high which is each 5:1 and 8.7:1 RR.
*Educational purposes only, this is not a trading advice. Be smart, make your own choices

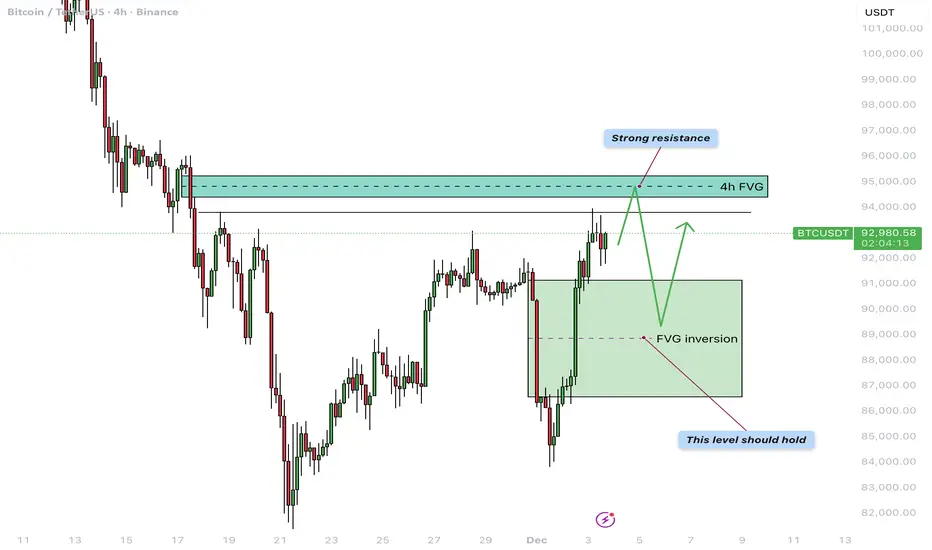
Bitcoin - $95.000 before a correction?Bitcoin finds itself at an important turning point once again after a sharp decline followed by a strong recovery. In this update, we will cover the reaction to the previous 4H bearish FVG, the newly formed 4H FVG inversion acting as support, the next resistance level around 95,000 dollars, and the recent liquidity sweep.
4H Bearish FVG Inversion
Two days ago, BTC made a strong downward move that reversed a large part of the earlier rally and collected deep liquidity beneath local lows. During this drop, a clear 4H bearish FVG was formed, acting as a supply zone. Yesterday, however, BTC reclaimed this entire FVG with conviction: the price broke through it and closed multiple candles above the zone. This shift flips the area from supply into demand, meaning the former bearish FVG has now transformed into a 4H FVG inversion. The green box on the chart now represents the primary support zone, ideally holding during any pullback.
4H Bearish FVG Around $95,000
Above the current price lies the next 4H bearish FVG around roughly 95,000 dollars, aligning with a previous consolidation and distribution phase. This region acts as strong resistance and is the next logical magnet for the ongoing recovery move. As long as the FVG inversion beneath price holds, it is reasonable to expect BTC to gradually move toward the 95k area. A clear reaction is likely once this zone is reached—ranging from a brief rejection and sideways consolidation to a potentially larger reversal if sellers become aggressive again.
Liquidity Sweep
Recently, BTC briefly pushed above a local high and pulled back immediately afterward, creating a clear liquidity sweep on the chart. This move wiped out the stops of late shorts as well as breakout longs but did not yet lead to immediate continuation to the upside. After such a sweep, the question becomes whether the market can gather enough buyers to fuel the next impulse toward the higher FVG, or whether price will first drop back toward the inversion support to gather liquidity there. The reaction at current levels will therefore provide important insight into short-term direction.
Conclusion
Because of today’s liquidity sweep, a direct correction from the current price is very possible, especially if short-term traders take profit after the strong bounce. However, the base scenario remains that BTC could still make one more push upward toward the 4H bearish FVG around 95,000 dollars, where a more significant reaction is expected. Such a move would fit perfectly within a structure where resistance is tested first, followed by a pullback to retest the new inversion support—confirming whether the recent reversal has real strength behind it.
-------------------------
Thanks for your support. If you enjoyed this analysis, make sure to follow me so you don't miss the next one. And if you found it helpful, feel free to drop a like 👍 and leave a comment 💬, I’d love to hear your thoughts!
Consistency: The Real Market Hack!Every trader wants consistency.
But very few understand what consistency actually means.
Consistency is not:
❌ winning every trade
❌ predicting the market
❌ avoiding losses
❌ being perfect
Consistency is built long before you press the buy (or sell) button.
Here’s what consistent traders all have in common:
1️⃣ They Repeat the Same Process Every Day!
Consistency comes from repetition; not randomness.
The best traders don’t have a different plan for every chart.
They use the same routine, the same checklist, the same rules.
Clarity replaces guesswork.
2️⃣ They Trade Only When Their System Shows Up!
Consistency is not about taking more trades.
It’s about taking only the trades that match your edge.
No signal = no trade.
No confluence = no risk.
No clarity = no entry.
Most inconsistency comes from forcing trades that never belonged in the plan.
3️⃣ They Accept Losses Without Breaking Structure!
A consistent trader still loses, they just don’t fall apart when it happens.
❌They don’t double their risk.
❌ They don’t chase entries.
❌ They don’t change strategy mid-trade.
They take the loss the same way they take the win:
within the system.
4️⃣ They Focus on Long-Term Data, Not Single Trades!
You can’t judge a strategy by one day, one week, or even one month.
Consistency is measured across:
✔ dozens of trades
✔ multiple cycles
✔ all market conditions
Professionals think in probabilities.
Beginners think in outcomes.
The Real Secret?
Consistency is not an ability.
It’s a decision you make every day:
➡️ Follow your rules
➡️ Manage your risk
➡️ Trade your edge
➡️ Ignore the noise
When your habits become consistent, your results eventually follow.
⚠️ Disclaimer: This is not financial advice. Always do your own research and manage risk properly.
📚 Stick to your trading plan regarding entries, risk, and management.
Good luck! 🍀
All Strategies Are Good; If Managed Properly!
~Richard Nasr

Bitcoin Pumps +10% — Bull Trap or Trend Reversal?Bitcoin( BINANCE:BTCUSDT ) has experienced over a +10% increase in the past two days, which came as a surprise to many analysts considering the previous bearish momentum. In other words, Bitcoin is on something of a roller coaster lately😂.
The question now is whether Bitcoin has started a new bullish trend or if it’s likely to see another decline.
Let’s dive into the 4-hour chart of Bitcoin. Currently, Bitcoin is approaching a resistance zone($94,850-$93,000), a Cumulative Short Liquidation Leverage($94,710-$94,063), and the monthly pivot point. This cluster of resistances, combined with the recent upward momentum, might make it challenging for Bitcoin to break through.
It’s also worth noting that the trading volume during this recent rally hasn’t been particularly high, so Bitcoin could still surprise us. This recent behavior shows that Bitcoin can move sharply both up and down, so it’s crucial to maintain proper risk management.
From an Elliott Wave perspective, considering Bitcoin’s recent decline, I initially expected that Bitcoin might at least test the low of its main wave 3 again. However, the recent rebound suggests that the main wave 5 may be truncated, and the corrective waves could still push Bitcoin lower, potentially even below $75,000.
From a classical technical analysis perspective, Bitcoin might be forming a bearish flag pattern, with the ascending channel acting as the flag’s pole.
In addition, the USDT.D%( CRYPTOCAP:USDT.D ) is still on an upward trend, which indicates that the cryptocurrency market might still face downward pressure.
Moreover, geopolitical tensions, such as those between the U.S. and Venezuela, could also act as a trigger for further Bitcoin declines if they escalate.
Lastly, the S&P 500 index( SP:SPX ), despite its recent bullish trend, doesn’t show the same positive correlation with Bitcoin. In fact, a decline in the S&P 500 could amplify Bitcoin’s downward movement.
Considering all these factors, I expect Bitcoin to continue its bearish trend and potentially test the heavy support zone. If these support levels break, we could see even more significant declines in the crypto market.
Based on the above explanation, I expect Bitcoin to have at least a correction to the targets I specified on the chart, and then depending on the momentum, we can expect a continuation of the decline or a resurgence.
Note: In general, with the opening of the US markets, financial market movements have become more intense these days than before, and it is better to be prepared for any scenario at that time.
What do you think? Do you believe Bitcoin will dip below $75,000, or will it bounce back?
Cumulative Short Liquidation Leverage: $98,591-$96,688
Cumulative Long Liquidation Leverage: $91,860-$90,960
Stop Loss(SL): $96,200
Points may shift as the market evolves
💡 Please respect each other's opinions and express agreement or disagreement politely.
📌Bitcoin Analysis (BTCUSDT), 4-hour time frame.
🛑 Always set a Stop Loss(SL) for every position you open.
✅ This is just my idea; I’d love to see your thoughts too!
🔥 If you find it helpful, please BOOST this post and share it with your friends.

Premium vs Discount Zones: Where Smart Money PositionsPrice doesn’t move in a straight line. It oscillates within swings, creating areas where buying or selling becomes more favourable.
Understanding premium and discount zones is how professionals identify where the market offers opportunity and where it carries unnecessary risk. It is a simple framework, but it shifts your mindset from chasing movement to positioning with intention.
Every significant swing in price has two halves. The upper half of a swing is the premium zone; the lower half is the discount zone. Premium is where smart money distributes or looks for short exposure. Discount is where accumulation and long positioning become attractive.
These zones reflect nothing more than logic: buy lower than average, sell higher than average.
To identify these areas, start by marking a clear swing high and swing low. The midpoint between them creates an equilibrium.
Above that midpoint, the market trades at premium; below it, at discount. This doesn’t guarantee reversal points, but it provides structure for understanding where traders with size can enter with reduced risk.
In an uptrend, the goal is to position within discount zones.
Buying in premium exposes you to deeper retracements, failed impulses, and weaker continuation. Discount buying aligns you with the dominant direction while keeping your risk defined.
In downtrends, the logic reverses: premium becomes the ideal zone to sell into, not chase.
What elevates this concept is combining it with liquidity and structure. A discount zone with a strong higher low carries far more weight than discount alone. A premium zone paired with equal highs or a liquidity sweep becomes a cleaner short.
These layers create clarity on where the market is likely to react, rather than relying on individual candles.
Premium and discount zones also prevent emotional trading. When price is in premium during an uptrend, the temptation to chase a breakout is high. The framework reminds you that continuation is less probable and patience often pays.
When price enters discount, the market offers a logical window to build positions without relying on prediction.

BTC analysis 8 DecBTC – Bullish Outlook with Planned Laddered Entries
📌 Overall Trend
My higher-timeframe bias on Bitcoin remains bullish.
I expect the current pullback to create liquidity for continuation to the upside.
⸻
📥 Laddered Buy Zones
I am planning to accumulate in three key demand zones:
• $90,500
• $88,650
• $85,907
These levels align with previous reaction zones and liquidity pockets that could serve as bases for bullish continuation.
⸻
🔍 Entry Criteria (Very Important)
I will NOT enter blindly into these zones.
For each level, I will wait for:
✔ CHoCH (Change of Character)
✔ Break of Structure on the 15-minute timeframe
Only after a clear shift in market structure will I execute entries.
This filter significantly increases win-rate by avoiding ignored or weak zones.
⸻
🎯 Trade Plan Summary
• HTF trend: Bullish
• Looking for a corrective move into demand
• Entry only with 15m CHoCH + BOS confirmation
• No confirmation → no trade

The Bell Curve: Understanding Normal Distribution in TradingMost traders have seen the “bell curve” at some point, but very few actually use it when they think about risk and returns.
If you really understand the normal distribution, you’re already thinking more like a risk manager than a gambler.
1. What is the normal distribution?
The normal distribution is a probability distribution that describes how values tend to cluster around an average.
If you plotted a huge number of outcomes (for example, daily returns or P&L per trade), the shape you’d get would often look like a symmetric bell :
- Most observations are close to the center.
- As you move away from the center in either direction, outcomes become less frequent.
- Extreme gains and losses are possible, but they’re relatively rare.
Mathematically, a normal distribution is usually written as N(μ, σ):
μ (mu) is the mean – the average outcome.
σ (sigma) is the standard deviation – a measure of how widely the outcomes are spread around that mean.
In trading terms:
If your returns roughly follow a normal distribution, you should expect many small wins and losses clustered near zero, and only occasional large moves in either direction.
2. Mean (μ): the “drift” of your system
The mean is the point at the center of the distribution. On a chart of returns, this is where the bell is highest.
If μ > 0, the bell is shifted slightly to the right → your system is profitable on average.
If μ < 0, it’s shifted to the left → your system slowly loses money over time.
For a trading strategy, μ is basically your edge. It doesn’t need to be huge. Even a small positive mean return, if it’s consistent and combined with disciplined risk management, can compound strongly over the long run.
3. Standard deviation (σ): volatility in one number
The standard deviation controls how wide or narrow the bell curve is.
- A small σ gives a tall, narrow bell → outcomes are tightly clustered around the mean.
- A large σ gives a short, wide bell → outcomes are more spread out, with bigger swings away from the mean.
Think of σ as a statistical way to describe volatility:
- For an asset: how much its price typically moves relative to its average change.
- For your strategy: how much your returns or daily P&L fluctuate.
Two systems can have the same mean return but very different σ:
- System A: μ = 0.2%, σ = 0.5% → relatively smooth ride.
- System B: μ = 0.2%, σ = 2% → same edge, but a wild equity curve and deeper drawdowns.
Same average, totally different emotional and risk profile.
4. The 68–95–99.7 rule
One of the most useful features of the normal distribution is how predictable it is. Roughly:
- About 68.2% of observations lie within ±1σ of the mean.
- About 95.4% lie within ±2σ.
- About 99.7% lie within ±3σ.
So if daily returns of an asset were approximately normal with:
- Mean μ = 0.1%
- Standard deviation σ = 1%
Then under that model you’d expect:
- Roughly 68% of days between –0.9% and +1.1%
- Roughly 95% of days between –1.9% and +2.1%
- Only about 0.3% of days beyond ±3%
Anything far outside that ±3σ range is, in theory, a very rare event. In practice, that’s often the kind of day everyone remembers.
5. Why this matters for traders
Even with all its limitations, the normal distribution is a powerful framework for thinking about risk:
Position sizing
If you know (or estimate) the standard deviation of your returns, you can form an idea of what “normal” daily or weekly swings look like, and size positions so those swings are survivable.
Stop-loss logic
Stops that sit right in the middle of the usual noise (within about ±1σ) will get hit constantly.
Stops closer to the ±2σ–3σ region are more aligned with “something unusual is happening, I want to be out.”
Expectation management
Most days and most trades will fall inside the “boring” part of the bell curve.
Understanding that prevents you from overtrading while you wait for the edges of the distribution – the bigger opportunities.
6. The catch: markets are not perfectly normal
Real markets often break the textbook assumptions:
- Returns tend to have fat tails → extreme moves happen more often than a normal distribution would predict.
- Distributions are often skewed → one side (usually the downside) has more frequent or more severe extreme events.
That means:
- A move that looks like a “5σ event” under a normal model might actually be something that happens every few years.
- Risk models based strictly on normal assumptions usually underestimate crash risk.
- Strategies like option selling can look very safe when you only think in terms of a normal distribution, but they are very sensitive to those fat tails.
So the normal distribution should be treated as a baseline model, not as reality itself.
7. Quick recap
The normal distribution is the classic bell curve that describes how values cluster around an average.
It’s parameterized by μ (mean) and σ (standard deviation).
Roughly 68% / 95% / 99.7% of observations lie within 1σ / 2σ / 3σ of the mean in a perfectly normal world.
Markets only approximate this; they usually show fat tails and skew, so extreme events are more common than the simple model suggests.
Even with those limitations, it’s a very useful tool for thinking about returns, drawdowns, and the range of outcomes you should be prepared for.
BTC updates
Here’s the Bitcoin result as well: it has gained 4%, and as expected, the 90,500 level pushed the price upward with high precision.
If you’d like to see more of my analyses, make sure to follow.

5 Key Trading Tips for BeginnersWelcome back everyone to another post! In this article we will be explaining 5 key pointers (tips) for new individuals entering the trading space.
When it comes to trading first there is “ understanding ” before we begin the 5 keys steps. Let me assist you in understanding what will happen when you take on trading.
Trading is a challenge. Not a video game challenge, not a math test challenge – a * Challenge * One that will break you. Trading will break you mentally, physically, spiritually and financially. It is an eye-opening journey.
Trading will teach you a lot about yourself, and it will teach you a lot about discipline, patience and how you can analyze markets.
I saw a quote somewhere, it said trading: “ Trading is the hardest way, to make easy money ” and they are right.
You will be learning how to manage risk, control your emotions, understand your own decision-making patterns. These are all invaluable lessons for life, as well as trading.
Sounds great! But then there are the losses, what you lose to gain all this. Trading isn’t something that you can learn overnight – all those posts you see about a young 17-year-old “ cracking the code ” is rubbish. Why? Because they haven’t learnt life lessons.
You can make money fast, but you will lose it faster if you don’t know how to manage it.
Trading will drain every bit of energy out of you. You will feel like you’re falling behind, you will eventually collapse at every loss and become frustrated. The market will test you; the market doesn’t give a damn about you – you accept the risk when you take on trading and since you’re the one making the trades, it’s you VS you.
You’re testing yourself. You agree to test your patience, your confidence, your mindset. Doing so will make progress feel nonexistent or slow.
Every day, and every trade you will question yourself, wondering if “trading” is even for you. Sometimes it will feel like you’re going in circles. You will continue to make mistakes repeatedly. It will become exhausting but remember – only experience and your own strengths will allow you to succeed. Only those who can endure the grind without giving up will make it.
So, let’s start off the 5 key pointers that will prepare you.
1) Prioritize Risk Management Over Profits:
Most newbies focus first on “ making money ” rather than safeguarding capital. The reality is that surviving in the market is way more important than winning every trade you see or come across.
Key Points:
Determine risk per trade: A common rule is risking no more than 1-2% of your trading account on a single trade. This way even a string of losses will not wipe you out.
Always use stoploss: A defined maximum loss per trade enforces discipline and emotions to stay in check.
Position sizing: Your sizing should be proportional to what you’re willing to lose on each trade. Bigger trades amplify the losses, but they also amplify the profits.
Why it matters:
Without strong risk management, even a high win-rate strategy can fail. Protecting capital ensures you’re still in the game when opportunities arise.
2) Develop a trading plan and stick to it .
Random reactive trading is the best way to lose money. Build your plan overtime.
Key points:
Define your strategy: Building your strategy is the longest part, constant back testing and forward testing, refining and rebuilding. You’re not “switching” your strategy if you’re adding something small to it, you’re changing it if you eliminate the whole thing.
Identify your form of trades, short, mid, long term or swing trades.
Set clear rules: Don’t leave anything to chance, for example “I only enter trades if price closes above the 50ema and RSI is above 50”
Journalling trades: Ensure to journal all your trades, “How do I journal” Easy. Record the time, date, symbol, pair, what model/system you used, images, your entry, tp and exit, why and for how long you’ll have it open.
Why it matters:
Consistency is a key, it pairs with discipline, psychology and lingers with risk management. Traders who follow a disciplined system perform better than those to trade off an impulsive feeling. Other words “Gamble”
3) Master one market and one system first:
Beginners usually spread themselves too thin, trying forex, crypto, stocks and commodities all at once – Unfortunately for me I made this mistake at the start which made it very difficult! – Don’t do this. Stick to one market.
Key points:
Pick one market: Each market has its own rhythm, volatility, and liquidity. Teaching one thoroughly allows you to understand everything about it.
Focus on one system: Instead of trying every new system from you tubes or forums, master one approach and refine it onwards e.g. – you trade FVGs, Win rate is 50% once you add Fibonacci it might be e.g. 65%
Avoid information overload: Social media and trading forums are filled with conflicting advice, stick to your chosen approach and refine it. People say you need to have 12-hour trading days. If you do this, you will FAIL. You will grind yourself into the ground and face burnout making it very difficult to get back up again. Limit yourself to how much trading and trading study you do a day. Eg 10 back test trades, 3 real trades, 3 journaled trades, 1 hour of studying and researching the market.
Without strong risk management, even a high win-rate strategy can fail. Protecting capital ensures you’re still in the game when opportunities arise.
Why it matters
Depth beats breadth early on. Mastering a single market and system will allow you to build confidence and improve your edge.
4) Understand the Psychology of trading.
Trading isn’t just numbers: as mentioned in “understanding” it’s a test of emotional control, fear, greed and impatience.
Key points:
Emotions vs logic: ensure you recognize emotional reactions like FOMO (Fear of missing out) or revenge trading. Pause before reacting to a trade that will go against you.
Set realistic expectations : Markets move slowly. Sometimes for months, don’t expect huge gains overnight. Just like DCA focus on compounding. Compound your knowledge and skill set.
Mindset training: Techniques like medication and journaling as well as visualization can help reduce stress and maintain discipline.
Why it matters:
Even a diamond system can still fail if emotions drive your actions. Psychology often determines long term success, more than technical skill.
5) Prioritize learning. Then earning.
Beginners fall into the trap of trading being a “get rich quick” scheme. But the real investment is learning how the market works.
Key points:
Paper and demo trade first: Practice on demo accounts before you use real money – you will be surprised how many times you will fail. It’s better to fail with simulation money than your McDonalds weekly wage.
Review every trade: Analyze your losing trades, but also your winning trades. Find patterns and areas to improve.
Continuously educate yourself: Read books about the mind, about habits, watch market analysis but critically, apply what you learn and don’t just collect information and not use it.
Why it matters:
Earnings are just the byproduct trading. The faster you learn and adapt, the sooner your profits will appear. Treat early losses as tuition. Not failure.
Thank you all so much for reading.
I hope this benefits all those who are starting off their trading journey. If you have any questions, let me know in the comments below!

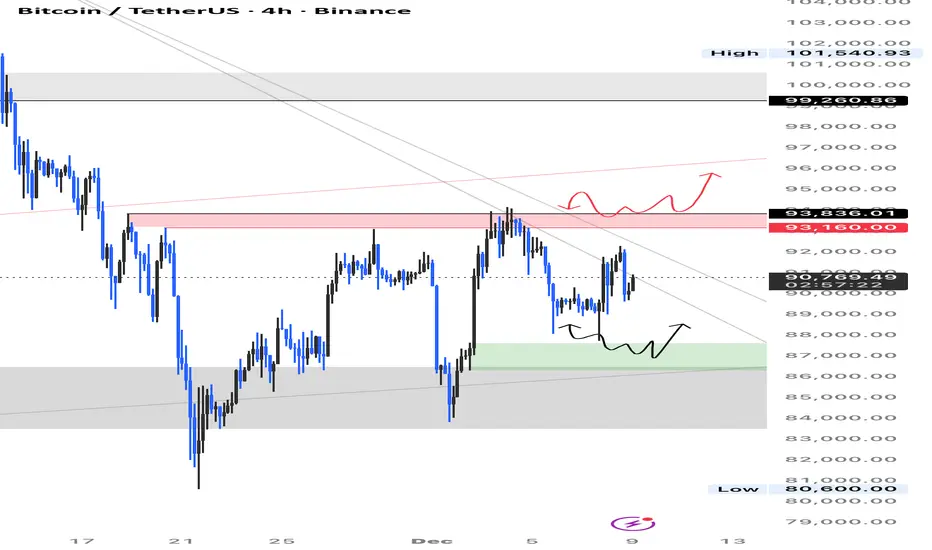
BITCOIN — THE MARKET IS APPROACHING ITS REAL DECISION POINTTraders,
We dumped. Now Bitcoin is grinding through a controlled recovery. The important question is not simply if we move higher. The real question is where the market will reveal its true intention. The chart is giving us a very clean map and the next major decision point is already forming.
1. The structure so far
Bitcoin sold off aggressively, found real buyers, and reclaimed the breakdown wick. That reclaim shows that the low was bought by spot demand rather than mechanical short covering.
Price is now pushing into a zone where the next expansion will be decided. The recovery itself is not the interesting part. The levels above and below are.
2. The major checkpoint above: 104k to 105k
This zone is extremely important. Two strong pieces of confluence meet here:
The 0.886 of the A to B retracement
The 1.618 extension of the impulse move you marked with the arrows
This creates a clean Potential Reversal Zone.
What this means:
If the market rejects 104k to 105k structurally, the next major destination becomes the lower imbalance cluster around 64k. That would be a true higher timeframe unwind because the entire path down is filled with thin volume and inefficient price action.
If Bitcoin breaks above 105k with flow support, then the next magnets open up immediately.
3. Targets above
If price accepts above the 104k to 105k PRZ:
First target area
Around 116k to 118k where we have a liquidity pocket and HTF inefficiencies.
Second target area
123k to 125k where a swing failure pattern is very likely. This is a weak high with resting liquidity and a natural magnet for price during bullish expansions.
At target two I expect the first serious reaction because of the liquidity sitting above the weak high.
4. Order flow confirms accumulation not distribution
Looking at the CVD grids:
Spot CVD is trending lower while price holds steady. This is a sign of absorption because someone is taking the other side of the selling.
Stablecoin margined CVD continues lower but without price following.
Coin margined CVD is sweeping lows with no breakdown in price.
This creates a hidden bullish divergence across the board.
Open interest also supports this view:
Stablecoin margined OI remains high which means traders did not exit during the dump.
Coin margined OI is slowly building which often appears before directional expansion.
This is not the profile of a market preparing for distribution. It is the profile of a market preparing for a move.
5. CME chart: AVWAP support from the last major swing
On CME, the AVWAP anchored from the previous major swing low to swing high is still holding as support. CME often leads during inflection zones. As long as this AVWAP holds, the market is positioned in a continuation PRZ rather than a breakdown PRZ.
If CME loses this AVWAP, the cascade scenario strengthens. As long as it holds, the bullish structure remains intact.
6. What happens if we break down instead
if Bitcoin fails to reclaim structure and breaks back down, the following levels become active:
83k to 84k
This is the shallow retrace zone and the first structural catch.
81k to 82k
This area contains the 1.113 extension and a previously unfilled FVG.
79k to 80k
This is the 1.272 level and a strong imbalance pocket.
72k to 73k
This contains the 1.414 extension and the next clean liquidity cluster.
64k
This is the 1.618 extension and the final major downside target. It aligns with the strong HTF imbalance that has never been fully tested.
A rejection from 104k to 105k can eventually lead price through these levels in sequence because the entire zone from 90k down to 70k contains thin volume. There is not much structural support built on the way up.
7. Real time confirmation tools
Watch these signals when we approach the 104k to 105k decision zone:
Spot CVD rising means continuation likelihood increases
Funding staying negative means shorts are still stuck
OI rising with price means momentum is building
CVD stalling or rolling over at 104k to 105k means rejection risk is high
CME AVWAP reclaim or failure will guide direction
If buyers hold flow above 105k, the path to 117k and then 124k is clean.
If buyers fail and we reject 105k with aggressive selling, the path down becomes active.
Final view
Bitcoin is approaching one of the most important technical levels on the chart.
We dumped on real flow.
We recovered on spot demand.
Now the market is converging toward the 104k to 105k PRZ where a true decision will be made.
Break above and the next magnets are 117k and 124k with a likely swing failure at the second target.
Reject and the lower zones activate with 64k as the eventual HTF destination.
This is the map. The levels are clear.
TLDR
BTC is recovering with spot support
104k to 105k is the major PRZ
Break above: targets at 116k to 118k and 123k to 125k
Reject here: downside levels at 83k, 82k, 80k, 73k and 64k
Order flow is showing hidden bullish divergence
CME AVWAP is holding which keeps the bullish narrative alive
The market leaves its footprints long before it shows its direction. Read the sands, follow the flow and stay prepared.
- ThetaNomad
----------------------------------------------
If you enjoy this style of analysis feel free to leave a like or comment. It lets me know you find value in these deeper structural and flow based breakdowns.
----------------------------------------------

Bitcoin Head & Shoulders on 1H is pumping it above 100K$ soonFirst lets take a look at that Attractive Reversal pattern which is now obvious in all tokens:
#Head_Shoulders :
The recent downward movement successfully triggered a significant number of long-position stop losses, effectively executing a 'long squeeze' and absorbing substantial sell-side liquidity. This classic market-clearing event often removes weak hands and over-leveraged positions, thereby reducing immediate overhead resistance.
With this liquidation event concluded, the market structure has notably cleared a key obstacle. The path upward now encounters less selling pressure from previously vulnerable positions. This development supports a bullish technical outlook, with the next primary targets residing at the $100,000 psychological level and beyond, as the new market structure allows for a more sustained advance.
DISCLAIMER: ((trade based on your own decision))
<<press like👍 if you enjoy💚

TradeCityPro | Bitcoin Daily Analysis #241👋 Welcome to TradeCity Pro!
Let’s move on to today’s Bitcoin analysis. The market is currently in a downward correction phase.
⏳ 1-Hour Timeframe
Yesterday, Bitcoin corrected down to 91,974, and as I mentioned, the bullish momentum the market had was gone.
🔔 Now the correction has become deeper, and the price has fallen to 90,421.
✔️ The last candle we saw shows strong seller dominance, and with the high selling volume, it could very well be the beginning of a new downward move.
💥 The RSI oscillator, after resetting yesterday, has now dropped all the way to the 30 level, with the possibility of breaking below it and entering the oversold zone.
💫 If that happens, given the strong selling pressure and powerful red candles, the probability of a drop toward lower levels will increase significantly.
🧩 One area the price hasn’t reacted to properly is 89,082.
🎲 This level used to be very important for Bitcoin, but recently the price hasn’t respected it much.
⭐ If the price again fails to react to this level on the next move down, we can conclude that this support has weakened.
⚖️ However, in my opinion, if buyers are going to step in, this level is not a bad candidate for a reaction.
🔭 If Bitcoin gets supported at 89,082 and moves upward, it will form a higher low compared to 85,220, which increases the probability of a bullish structure forming.
☘️ But if 89,082 breaks, the downward move toward 85,220 will begin, and that could even signal the start of the next major bearish wave on the daily timeframe.
❌ Disclaimer ❌
Trading futures is highly risky and dangerous. If you're not an expert, these triggers may not be suitable for you. You should first learn risk and capital management. You can also use the educational content from this channel.
Finally, these triggers reflect my personal opinions on price action, and the market may move completely against this analysis. So, do your own research before opening any position.

Bitcoin New Update (4H)As you know, these days the market volume is low and there are many fake pump-and-dump movements. Therefore, in these last days of the year, please manage your position sizes and risk appropriately.
Based on user requests and the available data we currently have on Bitcoin, the hourly sub-waves can be counted as follows:
Considering that Bitcoin has not yet reached the main order zone, the likelihood that wave D is complete is low. Also, in terms of timing, wave D could still extend further.
It is expected that Bitcoin may make another push upwards from the green zone.
Let’s see what happens.
For risk management, please don't forget stop loss and capital management
When we reach the first target, save some profit and then change the stop to entry
Comment if you have any questions
Thank You

Bitcoin (BTC): Seeing Bullish Signs | Need To Re-Claim 100 EMAThe 100 EMA has been tested multiple times on BTC, yet buyers did not manage to fully secure this area. What we see is a continuation of attempts to break this zone completely and secure it, and as buyers are showing volume, we are looking for it to happen.
Setup looks decent; the zone of liquidity is our stop zone, where the major target is the 200 EMA as of now!
Swallow Academy

BTC at Crossroads: Consolidation Before the Next Leg Up?BTC at Crossroads: Consolidation Before the Next Leg Up?
After Bitcoin came out of the consolidation, the price is reluctant to rise further. The market remains uncertain about the future moves considering that the FED is expected to cut rates at the upcoming meeting.
Perhaps the US PPI data today will start the move considering that the market should speculate again regarding the FOMC meeting.
On the other hand, BTC is well positioned for an optimistic move. It may correct in this area before moving higher. This is a normal scenario.
It is also possible that the price will fall within the pattern even more considering that the markets are still volatile and unclear before we see the optimistic move resume again.
Main targets
98900
106300
114500
You may find more details in the chart!
Thank you and Good Luck!
❤️PS: Please support with a like or comment if you find this analysis useful for your trading day❤️

Quick Bitcoin Update (4H)The corrective phase of Bitcoin is an expanding triangle/diametric/symmetrical , with wave C completed and now we are inside wave D. This is a bullish D wave.
There is still time remaining for wave D to complete.
We have marked a green box below the price; if the price reaches this area, we can look for long/buy positions.
Look for long/buy positions in the red box, as there are many sell orders placed there.
For risk management, please don't forget stop loss and capital management
When we reach the first target, save some profit and then change the stop to entry
Comment if you have any questions
Thank You
