Bitcoin to $100kBitcoin is trading exactly at the resistance line and is very likely to break above it towards 100k. Then after a pullback, we can expect a rally to the 110k area in the coming weeks and months.
Trade ideas

#BTC/USDT is currently strongly bullish#BTC
The price is moving in a descending channel on the 1-hour timeframe. It has reached the lower boundary and is heading towards a breakout, with a retest of the upper boundary expected.
We are seeing a bearish trend in the Relative Strength Index (RSI), which has reached near the lower boundary, and an upward bounce is expected.
There is a key support zone in green at 88200, and the price has bounced from this level several times. Another bounce is expected.
We are seeing a trend towards stabilizing above the 100-period moving average, which we are approaching, supporting the upward trend.
Entry Price: 88900
First Target: 90000
Second Target: 91123
Third Target: 92300
Remember a simple principle: Money Management.
Place your stop-loss order below the green support zone.
For any questions, please leave a comment.
Thank you.

The 100K Magnet: Bitcoin Can’t Resist This Zone!!!🧲🧲Bitcoin is aggressively climbing, and the chart makes one thing very clear, the red zone above is acting like a powerful magnet pulling price toward it.
Here’s why:
1️⃣ 100k Round Number
Major round numbers always attract liquidity. Traders, algorithms, and even long-term investors pay attention to them, making 100,000 a natural magnet for price.
2️⃣ Supply Zone
This area hosted heavy selling in the past, meaning there’s unfilled liquidity sitting there. Markets tend to revisit such zones to rebalance orders.
3️⃣ Major Resistance Zone
Historically, this level acted as a ceiling multiple times. What was once previous resistance often turns into the next major test.
With all three factors stacked together, the entire zone becomes a high-gravity area, and BTC tends to get "pulled" toward such confluences.
🏹As long as BTC maintains its short-term momentum, a retest of this magnet zone becomes the most likely scenario. After that? The reaction will reveal whether the bulls can finally break through, or get rejected again.
Will Bitcoin reclaim the magnet zone this time? 🤔
⚠️ Disclaimer: This is not financial advice. Always do your own research and manage risk properly.
📚 Stick to your trading plan regarding entries, risk, and management.
Good luck! 🍀
All Strategies Are Good; If Managed Properly!
~Richard Nasr

BTC — Range Deviation Play & Bear Flag TargetBitcoin continues to trade inside a clearly defined sideways range. Recently, the price made a deviation above the range high — a classic false breakout — and quickly returned back inside the channel, confirming the upper boundary as strong resistance.
Now, on the daily timeframe , the market is forming a bear flag , which typically acts as a continuation pattern to the downside. If this structure breaks lower, it opens the way toward the $68–67K zone , which aligns perfectly with the lower boundary of the range.
A move into this area would likely create a deviation below the range low, mirroring the earlier deviation at the top. Such symmetrical deviations often signal liquidity grabs before a potential mid-term reversal.
Key Points:
Range structure remains intact
Upper deviation confirmed — failed breakout
Daily bear flag suggests continuation lower
Target: $68–67K (potential lower deviation zone)
This scenario remains valid as long as BTC stays below the mid-range and the bear flag structure holds.

BTCUSDT.P - December 8, 2025Bitcoin is stabilizing after a prior downside leg and is now trading in a broad consolidation just above the highlighted mid-range support band around 88,500–90,000, with a clearly defined resistance zone at 97,000–98,000. A break and sustained close above that resistance would confirm a bullish continuation toward the projected 105,000–106,000 area, with invalidation below the 93,300 stop region. Conversely, rejection from resistance followed by a loss of the 88,500–90,000 support band would reassert the broader downtrend and open the way for a deeper move toward the lower 80,000s.

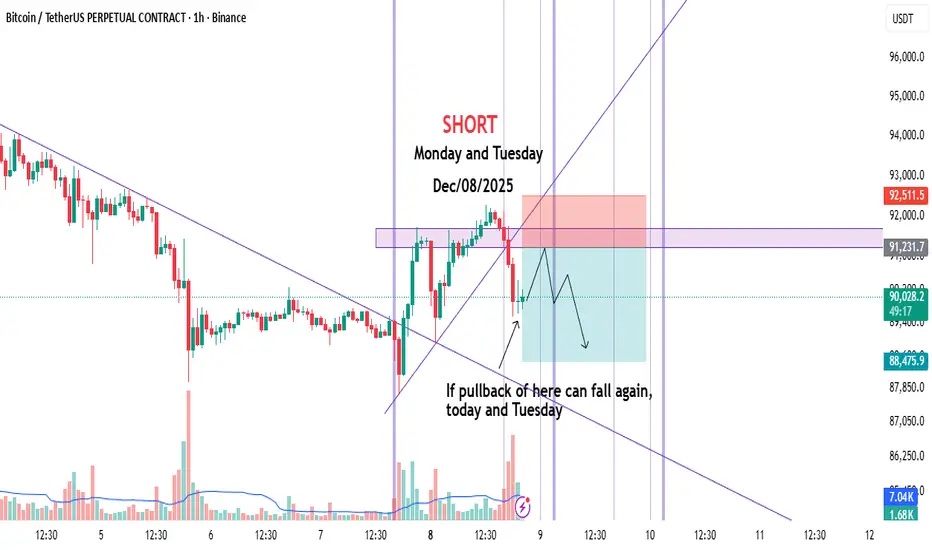
Daily Bitcoin Trade | Short | Monday | Dec/08/2025Hi Guys.
Given the trendline break and the static resistance formation, Bitcoin could be shorted today and tomorrow.
This is my personal setup.
Please be careful with your capital and don't forget the risk.
This is not an offer to buy or sell.
Good Luck :)
Alert: Bitcoin Price Charts Bear Flag Bitcoin follows the downward path posted earlier on the weekly chart (see related)
The falling knife accelerated after price broke below $100k as it swiftly hit the 80k level and stopped there just ahead of the next viable support at $74k
The price is now within a pink downtrend channel as RSI turned bearish below the 50 reading
Every strong move is followed by corrective price action
So the price bounced off the $80k and is now in a sideways consolidation
This is how the Bear Flag pattern has formed (white lines)
I think one more minor leg up is likely to complete the corrective structure
Watch for a breakdown of the flag’s downside to target the distance of the flagpole below
This aligns with both the downside of the descending channel and the $64k strong support
As I checked, MicroStrategy’s (MSTR) BTC cost basis is around $66k
Watch RSI as it should remain bearish below 50 to support the drop

BITCOIN Bitcoin currently faces a major resistance at the 98,750 level, a zone that has repeatedly limited upward momentum. As long as the U.S. Dollar Index fails to decline and geopolitical risks remain elevated, Bitcoin is unlikely to show strong bullish continuation. Despite the lack of immediate strength, the market still provides attractive opportunities.
The 80,000 and 70,000 support regions are fundamentally valuable zones, especially if institutional buyers — such as BlackRock through ETF allocations — accumulate positions.

M formation BTCBitcoin is confirming M formation and will go to 36k-37k to pick up all liquidity...there is as well support from 200EMA

$BTCUSD— $85,100–$84,100 Demand Zone Could Spark the Next Rally!BINANCE:BTCUSDT is building a solid bullish structure after a confirmed CHOCH and multiple BOS signals. Price is now approaching the $85,100–$84,100 demand zone, which is the key area to watch for a potential long entry.
If buyers step in and the zone holds, upside targets remain $88,000, $93,000, and $100,000.
A breakdown below $82,100 invalidates the setup and suggests deeper downside.
This demand zone will determine whether BTC continues its emerging bullish momentum. Stay patient and manage risk accordingly.

BTCUSDT.P – Bullish Reversal Targeting Key HighsPrice has swept the recent low near 89,934, triggering a sell-side liquidity grab and creating a Fair Value Gap (FVG) in the discount zone. This setup offers a high-probability long entry targeting the major swing highs from the previous structure.
• Direction: Long
• Entry Zone: 90,000 – 90,200 (Reaction within the FVG & mitigated sweep zone)
• Stop Loss: 89,600 (Below the swept low)
• Take Profit 1: 97,000 (Key previous high & major liquidity zone)
• Take Profit 2: 100,500 (Major swing high / equal legs expansion)
• Take Profit 3: 102,000 – 104,000 (HTF extension & liquidity target)
• R/R: Exceptional – Tight stop below sweep, aiming for significant higher-timeframe targets.
Key ICT/SMC Observations:
Liquidity Sweep Complete: Sell-side cleared below 89,934.
FVG & Order Block: Zone 90,000–90,200 provides premium entry.
Break of Structure: Awaiting move above 90,345 for confirmation.
Target Alignment: TP1 at 97,000 (previous high), TP2 at 100,500 (major swing), TP3 for full range expansion.
Bias is bullish while price holds above the swept low. Entry within the FVG targets a move back into the range, first toward 97,000, then 100,500+.

BTC OutlookHere we go.
Yesterday the Fed has cut for another 25 bps and Powell has given us a not so great outlook into interest rates for the next two years, forecasting only another two cuts of 50 bps total, expecting us to be near 3.1% in 2028.
As fellow BTC Traders that is something we don't like to hear. We want 50 bps in ONE, but it makes sense considering Powell wants to keep aiming for 2% Inflation while also supporting the labor market.
Anyways folks, while this isn't ideal we can expect the Fed to be turned upside down once Powell isn't chair anymore and Trump sweeps through there.
Besides interest rates in the US, we are at an interesting point in time as we have the Russell hit a new ATH, which indicates Risk-On, while we have the BoJ Meeting next week with them most likely hiking rates.
I'd be careful in the current macro regime as you have one side of the market scream AI Bubble, Yen Carry Unwind while the others are continuing to push for new upside as interest rates drop and DXY will start cooling.
For BTC this means uncertainty and mixed signals. We want and need a market that's risk-on, but a lack or even the pulling of liquidity through the yen carry unwind would sweep us off our feet.
In terms of Liquidity the Fed has also announced their $40B. T-Bill purchase program.
For BTC where we are headed to is all I can say, everyone and their grandma are screaming for higher prices right now. I could imagine this being the bottom, but if we do lose $76k I see us back in the range of $63k very quick.

[SeoVereign] BITCOIN BULLISH Outlook – December 09, 2025As of December 9, I would like to share Bitcoin’s bullish scenario.
Below are the main factors supporting the current rebound.
- Detailed Technical Basis
1) Reaching the completion zone of the 1.902 DEEP CRAB pattern
In the Deep Crab pattern, the 1.618 or 1.902 levels are considered reversal zones,
and when the BC extension and XA ratio converge simultaneously, a strong retracement structure is formed.
This aligns with the typical pattern conditions in which the market attempts a meaningful rebound.
2) Overlap of key Fibonacci 0.618 ~ 0.886 retracement zones
The 0.618 ~ 0.886 levels, which serve as the basis for the mid-term trend, are currently overlapping near the price,
forming a strong buy-side defense zone.
This area has acted as a pivot for directional reversals multiple times in the past,
and it now carries sufficient probabilistic context for a similar reaction to occur again.
3) Detection of initial signals of market structure shift
Even as the price continues to decline, bearish momentum is slowing,
and a classic absorption pattern seen in oversold conditions is appearing in the volume structure.
This is not yet a confirmed reversal signal but can be interpreted as an early movement preparing for a rebound.
- Strategy and Target
Based on these factors, I have set the average target zone for this rebound at 92,450 USDT.
If upward movement unfolds, I will reassess whether to continue holding at that level.
I plan to gradually increase long positions based on the technical conditions described above.
Further updates to position management will follow depending on market movement and indicator changes.
Thank you for reading.

BTC: Start BuyingAfter a rally, BTC has entered another consolidation phase, presenting fresh buying opportunities. You can start buying now, with the target range at 94K–96K.
BTC Trading Strategy for Today:
BTCUSDT buy@89000-90000
TP:94000-96000
All signals have been 100% accurate for two consecutive weeks. I’ll keep delivering precise signals — act fast to get yours now.

BTC: $105K on the HorizonI’m assuming we’re seeing a reversal Head and Shoulders forming on BTC, with a potential retest of 106k. In that case, there’s a strong chance of seeing a new all-time high. I opened a few scout positions and still believe the bulls are in control. A retest of the local low (around the 80k zone) is possible, but I’m staying in long positions for now. The price action from here will be telling: if we can move up right away, the probability of a new high increases sharply.
Stepping away from the hourly charts — now we wait.

BLACK SWAN322 and black swan
i cant tell more all in the chart. My last predict not in TV i predicted 10 october because i have signal from space)

BTC Trade Plan 06/12/2025Dear Traders,
appears to be a corrective bullish channel within a larger downtrend. This channel likely represents a pullback, increasing the probability of a downside continuation. The 94,500 – 98,500 zone is a major supply area that has acted as resistance multiple times and may trigger another rejection or fake breakout if retested. Should the price get rejected from this zone, the potential downside targets are 83,000, followed by 78,000 and 75,000. A bullish scenario becomes valid only if BTC closes a daily candle above 100,000, which could open the path toward the 105,000 – 110,000 resistance range. This is a market outlook and not financial advice — proper stop-loss and risk management are strongly recommended.
If this post helped you, consider boosting and sharing it. Thank you for the support.
Alireza!

max longin BTC hereMax longing BTC here, houghts?
Price is sitting on a strong support zone with clear signs of seller exhaustion. As long as this level holds, the long setup offers a solid risk-reward. A reclaim of nearby resistance could trigger continuation upward, while a break below invalidates the idea. Open to hearing everyone’s view.

$BTC - Market UpdateIntraday’s been pretty messy this week, a lot of pump & dump moves,
Well technically, we’re still sitting at a premium, but it looks a bit saturated now, and and 90k support won't probably hold. I was hoping we’d sweep those marginal highs around 95–96k, but yearly open is acting as trouble zone, a retest of 86k makes more sense now.
We could see a technical bounce around 86k, either we reclaim and break 92k, or we roll over toward the 82k (base support) .
Happy weekend everyone!

Bitcoin Price Weakness, $76,000 next?Bitcoin continues to struggle below the value area high, repeatedly rejecting the $95,559 resistance. Price has slipped beneath the POC, showing signs of weakness as momentum shifts toward support.
BTC is now heading into the $89,185 support level, and a breakdown here could trigger deeper selling as liquidity pools sit lower in the structure.
Key Points:
Rejected multiple times at $95,559 resistance
Trading below POC, signalling immediate weakness
Next key support sits at $89,185, with deeper targets at $76,000
What to Expect:
Unless Bitcoin reclaims the POC and breaks back above $95,559, the bearish trend is likely to continue, with $76,000 becoming a high-probability downside target.

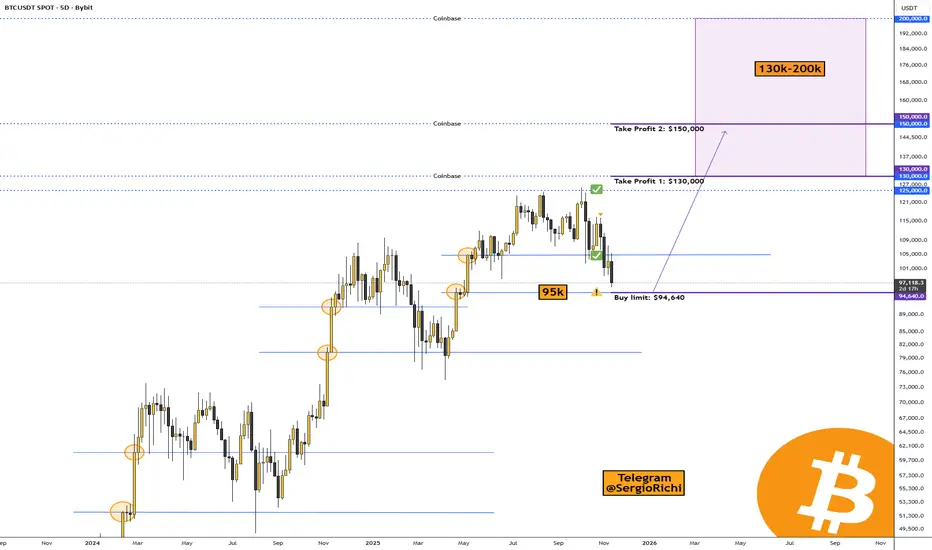
Bitcoin is approaching a key level at $94,640CRYPTOCAP:BTC #Bitcoin — Bitcoin is approaching a key level at $94,640.
The correction in the crypto market continues, and it's now starting in the US stock market.
Bitcoin is nearing an important level on the 5-day timeframe—specifically $94,640.
That's where market makers and big players have placed limit buy orders, and I think we'll see some major trader liquidations there too. For those who trade Bitcoin exclusively, I've marked a buy level.
• Buy limit: $94,640.
• Take Profit 1: $130,000
• Take Profit 2: $150,000
The range for wrapping up Bitcoin's cycle is pretty wide, since there are large orders set up there for taking profits. It's tough to pinpoint exactly where the price peak will be—we can only go by the data we can see.
• Coinbase: $130,000, $150,000, and possibly $200,000.
• Binance: $130,000, $150,000, and likewise, it's unlikely but possible to climb to $200,000.
Based on Elliott waves, we're finishing the 5th upward wave, and I figure the peak will hit in 2026, followed by a straight drop.
Indicator for Bitcoin miners:
The cycle indicator on Bitcoin shows the peak hasn't been reached yet:
Samuel Benner's Cycle and the 2026 Peak
The "200-year farmer chart," often referred to as Samuel Benner's Cycle Chart, is a historical economic forecasting tool created in 1875 by Ohio farmer and self-taught economist Samuel Benner.
It's credited with a "90% success rate" in broad sentiment prediction, and modern applications extend to stocks, crypto, and even solar cycles correlating with recessions.
It's best used as a sentiment gauge, not a precise timer.
Implications for 2026
The chart marks 2026 as a "B" year—a cycle peak in "Good Times," signaling high prices and a time to sell before transitioning to panic and hard times from 2026-2032.
This suggests a potential bull run peak, followed by downturn risks amid global debt, inflation, and geopolitics. As of late 2025, we're in a growth phase approaching this apex, per the model's extensions.
Dear friends, it looks like 2026 will mark the end of the growth cycle for Bitcoin and altcoins, so we'll need to find exit points, bail out of the crypto market, stock up on supplies for 3-5 years, and get busy building bunkers 😀🔥.
BTC: Target 100KBTC pulled back again over the weekend, dropping below 90K. I’ve been consistently emphasizing that levels below 90K present the optimal buying opportunity—and the market has rallied as predicted, aligning perfectly with my analysis. We now continue to wait for an upward breakout, with the target set at 100K.
I send accurate signals daily—all signals have been 100% correct for two consecutive weeks. Don’t miss out!

BTC-USDTI directly said about Bitcoin that it’s going to correct and go down, and that’s exactly what happened 🕯🕯
But selling pressure caused it to even hit a shadow of 88. Right now, for Bitcoin to rise again, it needs to break 90k 🪙📊
If that happens, it can go up to 92,800 ✔️🔼
For now, Bitcoin’s support is at 88k 📣🚀
