BTC_updateHidden Bullish divergence on the weekly chart. Still stuck in the cloud. When we break trough the cloud next resistance zones are indicated on the chart. Biggest ressistance zone is the 109.000$ region. I will do an update next saturday.
Trade ideas

max longin BTC hereMax longing BTC here, houghts?
Price is sitting on a strong support zone with clear signs of seller exhaustion. As long as this level holds, the long setup offers a solid risk-reward. A reclaim of nearby resistance could trigger continuation upward, while a break below invalidates the idea. Open to hearing everyone’s view.

Still more upside for BitcoinHi traders,
Last week Bitcoin made a correction down and went up again as I've said in my previous outlook.
Now we could see more upside at least to the bearish Weekly FVG above after the finish of the correction down.
Let's see what the market does and react.
Trade idea: Wait for a small correction down on a lower timeframe and a change in orderflow to bullish to trade longs.
This shared post is only my point of view on what could be the next move in this pair based on my technical analysis.
But I react and trade on what I see in the chart, not what I've predicted or expect.
Don't be emotional, just trade your plan!
Eduwave

BTC/USDT 4HOUR CHART UPDATE !!BTCUSDT is consolidating within an ascending channel after a sharp bounce from lower levels, and the price is currently retracing towards mid-channel support around 88,000–87,000 USDT.
The lower boundary of the channel and horizontal levels at 88,000, 87,013, and 84,584 act as step-down support; as long as candles remain above around 84,500, this will remain a healthy corrective pullback in the short-term uptrend.
Below that, key higher-timeframe supports near 80,550, and 76,200 are the next demand zones where a deeper flush could still maintain the larger bullish structure.
The price drops towards the lower channel area, finds support, and then rotates higher for another leg up, with the green zone around 94,000–95,000 being the first major resistance on the way back towards the large grey supply above 100,000.
DYOR | NFA

BTC/USDT | $BTC Smashes Back to 94K but The Real Test Is Ahead!CRYPTOCAP:BTC pulled a full reversal after the heavy crash and pushed all the way back to 94K. Right now price is trading around 93K and this entire move basically filled the liquidity void created during the violent dump. For short term traders this is where I prefer staying on the sidelines because premium entries will show up again at lower levels once the market cools down.
For long term traders and holders nothing has changed. The bullish structure is still alive and if Bitcoin can break above 97K the next upside leg can easily extend toward 105K and even 106K. I will update the view again once we see how price behaves around the 97K zone.
Please support me with your likes and comments to motivate me to share more analysis with you and share your opinion about the possible trend of this chart with me !
Best Regards , Arman Shaban

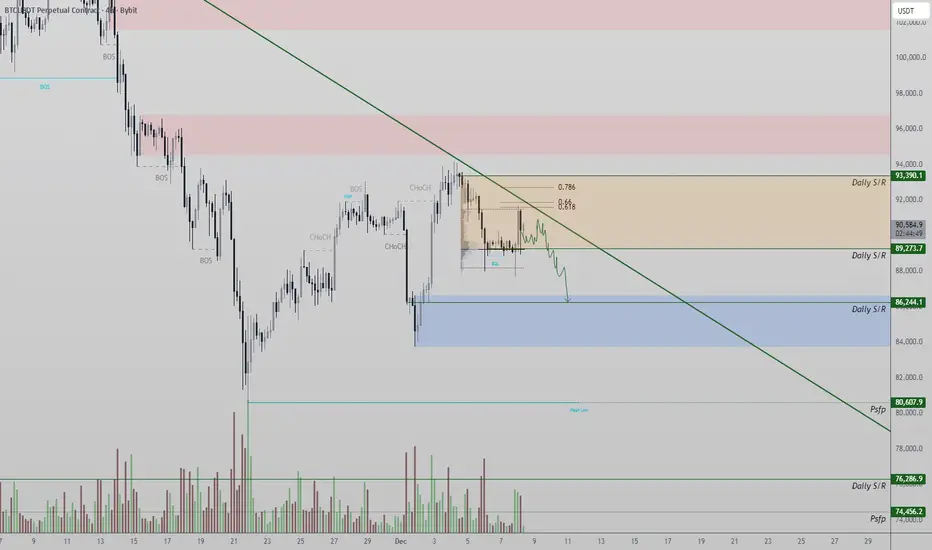
Daily Bitcoin Trade | Thu(Dec-04-2025) | ShortThu(Dec-04-2025) | Short
LEV: 50x
EN: 92990
SL: 93926
TP: 90489
This is my setup for today. This setup may fail. be careful, because this trade is risky!
This is not an offer to buy or sell.

The 100K Magnet: Bitcoin Can’t Resist This Zone!!!🧲🧲Bitcoin is aggressively climbing, and the chart makes one thing very clear, the red zone above is acting like a powerful magnet pulling price toward it.
Here’s why:
1️⃣ 100k Round Number
Major round numbers always attract liquidity. Traders, algorithms, and even long-term investors pay attention to them, making 100,000 a natural magnet for price.
2️⃣ Supply Zone
This area hosted heavy selling in the past, meaning there’s unfilled liquidity sitting there. Markets tend to revisit such zones to rebalance orders.
3️⃣ Major Resistance Zone
Historically, this level acted as a ceiling multiple times. What was once previous resistance often turns into the next major test.
With all three factors stacked together, the entire zone becomes a high-gravity area, and BTC tends to get "pulled" toward such confluences.
🏹As long as BTC maintains its short-term momentum, a retest of this magnet zone becomes the most likely scenario. After that? The reaction will reveal whether the bulls can finally break through, or get rejected again.
Will Bitcoin reclaim the magnet zone this time? 🤔
⚠️ Disclaimer: This is not financial advice. Always do your own research and manage risk properly.
📚 Stick to your trading plan regarding entries, risk, and management.
Good luck! 🍀
All Strategies Are Good; If Managed Properly!
~Richard Nasr

Relative analysis of Bitcoin vs. Gold and Total CryptoOn the BINANCE:BTCUSDT / TVC:GOLD ratio chart, price attempted to re-enter the primary channel after the initial breakout, aiming to push back toward the channel’s upper boundary. However, despite (105) days of upward attempts, the ratio consistently struggled with the dynamic resistance area.
After the breakdown, price extended toward the lower boundary of the extended channel, where it showed a strong and precise reaction.
From here, the structure suggests a potential bullish corrective move toward the resistance zone, supported by:
bullish divergence between price and MACD,
clear weekly rejection candles,
and price interaction at the channel’s lower boundary.
This scenario is further reinforced by the Crypto Market Cap (excluding Bitcoin) CRYPTOCAP:TOTAL2 vs. Gold TVC:GOLD ratio. This chart has also reached the bottom of its (180-week) channel, formed a weekly bullish divergence, and has now returned back inside the channel.
As shown on the chart, the TOTAL crypto channel exhibits cleaner and more consistent reactions compared to the Bitcoin channel.
If our key level is broken, the bullish scenario becomes invalid, and price is likely to move toward the support zones. This analysis will be updated accordingly.
BINANCE:BTCUSDT
TVC:GOLD
CRYPTOCAP:TOTAL2

TradeCityPro | Bitcoin Daily Analysis #239👋 Welcome to TradeCity Pro!
Let’s move on to today’s Bitcoin analysis. The market has started a new bullish move, which seems to be the beginning of a sharp upward move.
⏳ 1-Hour Timeframe
Yesterday, after the previous drop, Bitcoin created a range structure, and the bullish move began with the break of the 87,088 resistance.
🔔 This move was very sharp, and the price continued its way up to 93,609, a level that is very important for Bitcoin’s future trend.
⚡️ Currently, after reaching 93,609, the price has entered a range and correction phase, with a pullback to the 91,974 level, preparing for the next upward move.
📊 If volume starts to increase, we can open a long position after the 93,609 level is broken.
🧩 Breaking this level has been a long-awaited trigger for a long position.
💥 The RSI oscillator, after entering the overbought zone, has now reset. If the price starts moving upwards again, and RSI enters the overbought zone once more, we can get momentum confirmation for the next leg up.
❌ Disclaimer ❌
Trading futures is highly risky and dangerous. If you're not an expert, these triggers may not be suitable for you. You should first learn risk and capital management. You can also use the educational content from this channel.
Finally, these triggers reflect my personal opinions on price action, and the market may move completely against this analysis. So, do your own research before opening any position.

BITCOIN SIGNAL: ARE BEARS PREPARING TO CRASH BTC??????!!!Yello Paradisers! Enjoy the video!
And Paradisers! Keep in mind to trade only with a proper professional trading strategy. Wait for confirmations. Play with tactics. This is the only way you can be long-term profitable.
Remember, don’t trade without confirmations. Wait for them before creating a trade. Be disciplined, patient, and emotionally controlled. Only trade the highest probability setups with the greatest risk to reward ratio. This will ensure that you become a long-term profitable professional trader.
Don't be a gambler. Don't try to get rich quick. Make sure that your trading is professionally based on proper strategies and trade tactics.

BTCUSDT - The Top (3x) I am looking at $75k-$80k for a bottom with 3 potential topping targets, the last macro sized pump for 'the cycle'.
Target 1 ~$108k
Target 2 ~$144k
Target 3 ~$173k
I put the least weight in Target 1 at 10%, with 40% for Target 2 and 3 a piece.
As to when these targets hit, I am thinking 2nd week to 3rd week of January 2026 to coincide with the seasonal 'January Effect'
As always, this could be completely wrong. So as always, hold strong opinions, but hold them loosely.

BTCUSDT Short-term bullish trend: Target - $94KTread with Caution with the market lacking volatility and the upcoming FOMC meeting. Use Stop Loss wisely.
The 15 min chart shows a triangle formation ready for a breakout with a potential target of $94K.
The 4hr chart shows a double bottom formation with a potential target also around $94K.
The previous FVG on the 4-hour chart also sits between the 94K-95K zone.
The market structure shows an uptrend with higher highs and lower lows recently and the prices sitting above the 20EMA.
The RSI and MACD are also trending upwards on the Daily, 4hr and 15min, indicating (for the moment) bullish trend.
Overall, gives enough data points to suggest a temporary uptick to $94K range.
As always, trade with strong risk management and adapt with the market direction.

Bitcoin's scenario ahead in daily timeBitcoin's scenario ahead in daily time
See more details on the chart

BTC 88194.99K the point where time bows before structure Carved in Stone: The Point Where Time Bowing to Structure
🏷 BTC
🏷 17.11.2025
🏷 Capital Sector. Local price slice at a moment. System of intelligent anticipation.
🏷 88194.99 — The price is carved. As of publication, the level has not yet been reached.
November 17, 2025 — not a date, but a portal .
Within it, as within an ancient temple, the number is inscribed: 88194.99 . Not approximately. Not “around.”
Carved — without room for interpretation, without space for opinion.
This is not a signal. This is the establishment of reality within the Capital Sector. Here, speculation ends; architecture begins. Lower timeframes fall silent. The crowd remains in shadow. Only those who understand the language of price sectors and anticipatory structures can read what has already been written.
To this core is bound a minimum impulse of 7% — not an option, but a structural imperative. Price does not merely move: it must validate the integrity of the sector. Thus, the range of realization is not shaped by desire, but by inevitability.
International horizons have long been marked: not all may approach the source without being burned.
To outsiders — no entry. Not because it is forbidden, but because it is inaccessible . Reality here is constructed according to rules that are not debated — they are executed.
The point is not an invitation. The point is a test.
— The Architect

#BTC#Bitcoin Technical Analysis:
In my opinion, #Bitcoin will have an upward movement towards the indicated resistance areas (red).
Red areas: Static resistance
Red lines: Dynamic resistance


BTC/USDT Analysis. Bearish Bias Remains in Play
Hello everyone! CryptoRobotics trader-analyst here, and this is the daily market analysis.
Due to a technical issue on TradingView, yesterday’s update could not be published. However, Bitcoin has already begun to play out the short setup we outlined earlier.
As a reminder: on Wednesday at 22:00 (GMT+3), the U.S. Federal Reserve announced a rate cut, which triggered a sharp short squeeze toward ~$93,500 — the level where previously the largest absorbed buying volume was concentrated. Buyers failed to break the high, and Bitcoin dropped 5% overnight. This is exactly the scenario we described in advance.
During yesterday’s decline, the price reacted to a technical level where selling pressure weakened and buyers showed initial signs of activity.
We are now trading inside the local volume zone at $92,000–$93,000.
Despite these local reactions, the broader bias remains bearish. We expect a move toward the nearest support.
The bearish scenario would be invalidated only by a strong breakout above the $94,000–$97,500 sell zone.
Buy Zones
• $87,800–$86,400 (volume zone)
• $84,000–$82,000 (volume anomalies)
Sell Zones
• $92,000–$93,000 (local volume zone)
• $94,000–$97,500 (volume zone)
• $101,000–$104,000 (accumulated volume)
• $105,800–$106,600 (local resistance)
This publication is not financial advice.

Bitcoin is in a downtrend and Ascending wedgeBitcoin is in a clear downtrend and below key moving averages like 20 WEMA, 34WEMA and below EMA ribbon and below previous low which is 98k. Now it is forming and ascending wedge pattern on 4H time frame which is very bearish. Fundamentally DATs are cooked, No ETF inflows (Mainly outflows), Whales still selling, Gold took the crown of hedge for money printing and with tokenized gold it becomes clear bitcoins narrative has being proven wrong. Until people accept bitcoin as a proper hedge downtrend will continue. Probably can buy bitcoin once Strategy start selling.

BTC at the upper boundary: mixed signalsThis analysis is based on the Initiative Analysis (IA) method.
Hello traders and investors!
On the 4-hour timeframe, an absorption pattern has formed at the upper boundary of the range. At the same time, a buyer zone begins immediately below, where a buyer reaction may appear.
On the daily timeframe, the structure remains within the same sideways range. The touch of the upper boundary came on a volume spike, and key volume was accumulated in the upper part of the range — which is a positive sign.
However, this daily candle has two details that raise questions:
First: the highest volume was accumulated around 90,400, not at the top of the candle.
Second: despite the volume spike, it was still lower than the volume during the previous touch of the upper boundary, when the buyer showed initiative.
Therefore, if considering a short here, I would do so only after a break below 89,500 and confirmation that the seller is defending this level.
For now, the stance is neutral: observing how the structure develops on the 1-hour and 4-hour timeframes.
Wishing you profitable trades!

Bitcoin Price Apex Zone, Directional Move this week?BTC is sitting above a key level at $90,000 after rejecting from the 0.618 Fib, which aligned with the value area high and dynamic trendline resistance.
This confluence has pushed price back into an apex zone where consolidation is likely.
Key Points:
- Rejection at 0.618 Fibonacci + value area high
- Dynamic trendline continues to cap upside
- Price compressing inside an apex, watching for a break
What to Expect:
As long as dynamic resistance holds, BTC risks a decisive downside break once the apex completes. Bulls must reclaim resistance to shift momentum.
Last bulish wave price target We got last bulish wave in 4 triangle pattern
That Price is the 98000 dollar
In the wave we have a fast momentume for give liquidity then rejected vdown price to 74000
For confirmation we shold be RD _ in histogram macd
Set your money management & stop loss actually

BTC USDT idea - Temporary (Christmas) bullish patternMy idea is based on my bias that we are in a range season and the upward movement is a correction. In other words, I take into account the liquidity zones left by previous POCs.
If it reaches 101 k at all, for me that's a dangerous zone where any unnecessary FOMO could turn into a trap. But if it breaks through, we'll see again. We're all hoping for a Christmas rally, right?

BTC/USDT Weekly AnalysisBitcoin is currently in a corrective phase after a strong weekly sell-off.
Price has a clear Weekly Fair Value Gap (FVG) sitting around the previous weekly high in the 95k–97.5k area.
📌 Technical idea:
Price could retrace back into the weekly FVG to rebalance inefficiency and grab liquidity above the previous weekly high.
After tapping that zone, a bearish reaction is expected.
Final target is the previous weekly low, where major liquidity rests.
📍 Key levels:
Weekly FVG zone: 95,000–97,500
Liquidity grab above previous weekly high
Target: previous weekly low around ~75,000
🎯 Bias: Bearish after mitigation
