Nvidia: Acceleration Toward New Highs Nvidia gained strong upward momentum shortly after our last update, surging past the $196.45 mark, which had previously served as resistance. As a result, our prior short-term alternative scenario was triggered, and we have now adjusted the chart accordingly (with minor modifications). We now view the green wave as complete and believe that the joint top of green wave and beige wave III, as well as the low of wave IV, have already been established. The Target Zone we had initially set for the wave- low has therefore been removed. In our updated short-term alternative scenario, we still see a 30% probability of a new low for beige wave alt.IV below the $176.21 support level. In this case, however, price would likely rebound above the lower $145.50 level.
Trade ideas

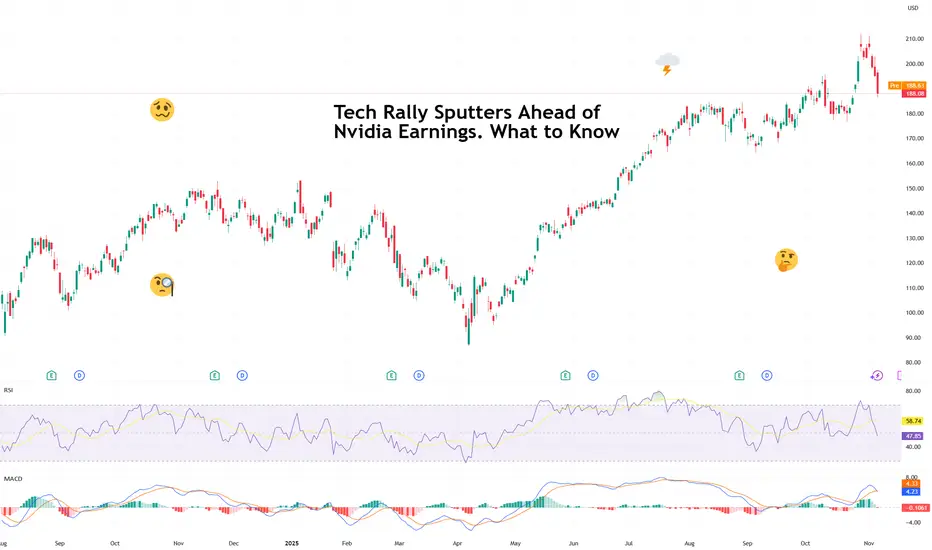
Tech Rally Sputters Ahead of Nvidia Earnings. What to KnowIs the powerful AI sector finally out of breath? With valuations that stretched, some investors fear if we all took it too far.
After months of seemingly unstoppable gains, the tech trade is finally showing signs of fatigue. Stocks are back in the red this week, with technology — the sector that’s carried the entire market on its silicon shoulders — leading the declines.
The S&P 500 SP:SPX , up more than 35% since its April lows and boasting 36 record closes this year, has been powered almost entirely by a handful of tech heavyweights.
The Magnificent Seven now make up nearly 40% of the index’s market value and roughly a third of its earnings.
But now, investors are wondering if the rally’s run too far, too fast. The question echoing across trading desks: Is AI finally out of breath?
💸 The Price of Perfection
It’s not that tech earnings have been bad — in fact, they’ve been stellar. Microsoft NASDAQ:MSFT , Amazon NASDAQ:AMZN , Meta NASDAQ:META , and Alphabet NASDAQ:GOOGL all beat expectations last week and promised even more AI spending next year. Translation: more orders for Nvidia’s chips, more data centers, more server farms, more everything.
But good news isn’t moving the needle right now. When valuations stretch this far, even “great” can start to look “meh.” Investors are realizing that the higher you climb, the thinner the air gets.
The entire AI complex — from semiconductors to cloud computing — now trades at multiples that assume not just perfection, but sustained, exponential perfection. And that’s a tough sell when rates are still relatively high, inflation is sticky, and the Fed remains data-deprived thanks to a looming government shutdown (now the longest in history).
🧠 Nvidia: The Market’s Favorite Crystal Ball
Which brings us to Nvidia NASDAQ:NVDA — the stock that can save the day. The chipmaker reports fiscal third-quarter earnings on November 19, and it’s shaping up to be a defining moment for the entire market.
Expectations are sky-high: analysts see earnings per share of $1.25, up from $0.81 a year ago , and revenue of $54.6 billion, a jaw-dropping 56% increase from last year’s $35 billion.
If Nvidia delivers (again), it could reignite the rally and remind investors why they fell in love with AI in the first place. But if there’s even a hint of deceleration — a cautious forecast, a whisper of supply constraints — the selloff could accelerate.
Simply put: as goes Nvidia, so goes the market. Fast fact: Nvidia washed out more than $450 billion from its valuation in just the last three days .
🔌 The Waiting Game
With two long weeks until Nvidia’s report, traders are stuck in a sort of limbo. Without a fresh catalyst, the market could decide to churn sideways — or drift lower — as profit-takers cash in on their massive gains.
The uncertainty isn’t helping either. A government shutdown delays key economic data, leaving the Fed flying in the dark just as investors are trying to gauge when rate cuts might actually arrive.
That means more guesswork, less conviction, and a good chance of exaggerated market swings.
So don’t be surprised if volatility ticks higher before Nvidia’s big reveal — the gem of the earnings calendar .
Off to you : How do you see the next two weeks unfolding? And, more importantly, are you bullish or bearish on Nvidia’s earnings report?
Concerns on market specifically NVDA - Not financial adviceSome thoughts and concerns watching the market as an amateur investor looking at historical shifts and trends. This is not a prediction and not to be considered financial advice in any manner shape or form. It is simply a personal opinion based on my impression of the market. Please discuss any choice you make in the market regarding trades with a financial advisor or planner as this opinion is just an uneducated perspective to be taken with a grain of salt from someone who does not work in the financial industry. There are several factors I have taken into account regarding the economy, job losses, looming Debt Wall, real estate market concerns, tariff pain points for US, recession chatter, dollar weakness, US debt and my personal gut check.
Disclosure - I do not currently hold NVDA but I have a standing buy order for my personal account for NVDA at $50. I do not know the market well enough to short.

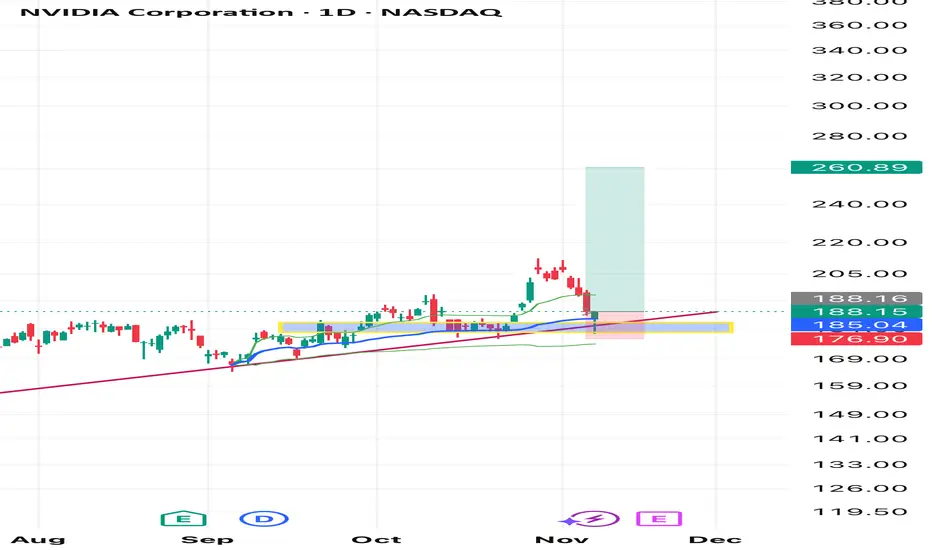
NVDA Rebounds From Demand Zone, Eyeing $210 Supply AreaNASDAQ:NVDA has shown a strong rebound from the $177–$180 demand zone, signaling potential bullish momentum after a steep correction. The 1-hour chart shows a shift in structure, with higher lows beginning to form, suggesting renewed buyer interest.
As long as the price holds above $182, the short-term outlook remains constructive. A breakout above $190 could accelerate the move toward the $210–$213 supply zone, where sellers previously regained control.
However, if NVDA fails to maintain above $182, the bullish setup may be invalidated, and price could revisit the $177 support.
🟢 Entry: $186–$188
🔴 Invalidation: Below $177
🎯 Target: $210–$213

NVIDIA STOCKS TECHNICAL DETAILS FOR AI STOCKS NVIDIA.
AFTER A RALLY COMES A CORRECTION TO KEEP A HEALTHY TREND.NVIDIA WEEKLY REJECTION LEVEL AT 213$ WILLHAVE THE FIB 0.382 (165.32$) DEMAND FLOOR WATCHED FOR POTENTIAL BUY.
THE NEXT DEMAND FLOOR IS 50% FIBONACCI 150.52$ A STRONG PSYCHOLOGICAL DEMAND FLOOR AND THE WEEKLY SMA 50 PROVIDING BUY BIAS. TO THE NEXT DEMAND FLOOR AT 150.52$ FOR NVIDIA .
FUNDAMENTAL OUTLOOK.
Reasons for Recent Stock Drop:
Concerns over valuation: The stock trades at a high forward P/E (~59x), raising worries about near-term growth sustainability.
Competitive pressures: Emerging competitors (e.g., AMD, Intel) and Chinese startups with cost-effective AI models (like DeepSeek) create market uncertainties.
Regulatory and geopolitical risks: US export restrictions on advanced AI chips may constrain NVIDIA’s international growth.
Profit margin pressure: Expectations of tighter profit margins due to accelerated rollout of new chip architecture (Blackwell).
Broader tech sector pullbacks driven by rising bond yields and inflation fears have also weighed on NVIDIA.
Overall, while NVIDIA's long-term outlook in AI remains positive, short-term market dynamics including valuation concerns and increased competition caused the stock to retreat after reaching highs near $213.
#STOCKS #NVIDIA

NASDAQ:NVDA — pre-earnings Swing Trade Breakdown💰 NVDA — Swing Trade Breakdown
Ticker: NASDAQ:NVDA
Duration: Short-term swing (pre-earnings setup, ~12 days before report)
🏢 Company Snapshot
NVIDIA is the global leader in GPUs and AI computing hardware. The stock remains a momentum anchor in the semiconductor space, benefiting from continued AI data-center demand and strong cash flow expansion. Current setup follows a steep pullback — RSI(2) at 6.32, signaling short-term exhaustion and potential bounce zone.
📊 Fundamentals
P/E: ~56× (vs ~35× industry average) → Premium valuation justified by hyper-growth.
P/B: ~48× → Reflects asset-light, high-margin structure.
Debt/Equity: ~0.09 → Very low leverage, excellent balance sheet.
ROE: > 100 % → Exceptional profitability.
Dividend Yield: 0.02 % → Pure growth focus.
Free Cash Flow: ~$72 B TTM → Strong liquidity and reinvestment potential.
Cash on Hand: High, current ratio ~4.2× → Excellent short-term flexibility.
Summary: Outstanding profitability and balance sheet strength, but valuation remains stretched.
📈 Trends & Catalysts
Revenue Growth: +60 % YoY (AI infrastructure and data-center demand).
EPS Trend: Rising sharply with margin expansion.
Cash Flow Trend: Explosive FCF growth — from ~$4 B (2023) to ~$60 B (2025).
Balance Sheet: Minimal debt, huge cash reserves.
Catalysts: Upcoming earnings (~12 days), AI build-out momentum, tech rotation inflows.
Risks: Elevated valuation, potential multiple compression post-earnings, high beta (~2.1).
🪙 Industry Overview
Semiconductors remain one of the strongest global sectors.
Weekly: Up ~2-4 % — rotation into large-cap AI plays.
Monthly: Up ~8-12 % — capital inflows favoring high-growth tech.
12-Month: Strong outperformer vs. S&P; macro driven by AI demand cycle.
📐 Technicals
Price: ~$188.08
50-SMA: ~175 – 180 → currently testing zone.
200-SMA: ~145 – 150 → long-term uptrend intact.
RSI(2): 6.32 → extremely oversold, near reversal zone.
Pattern: Short-term consolidation after parabolic run; possible breakout retest.
Support: $165 – 175
Resistance: $205 – 215
Volume: Watch for accumulation spikes near support for confirmation.
🎯 Trade Plan
Entry Zone: $180 (buy near support on strength confirmation).
Stop Loss: $175 (below key support / invalidation).
Target: $190 (first swing resistance).
Risk/Reward: ~2:1 if entered near $180.
Alternate Setup: Continuation breakout > $215 for momentum traders.
🧠 My Take
NVDA remains the king of AI momentum. Fundamentally bulletproof, technically oversold, and sitting on key support ahead of earnings. Ideal setup for a 2:1 swing bounce — but exit before the earnings date to avoid volatility risk. Watching for a reversal candle or volume confirmation near the 50-SMA zone.

Nvda LongLong NVDA because it finished testing weekly trendline, and Vwap. The reaction to the trendline and the vwap was a hammer daily candle which shows that those will be respected.
If any other instrument you guys want me to analyse, just let me know me know!!
Good luck everyone !!
NVDA How to become successful in forex and stock trading:
1.Master fundamentals and technical analysis.
2.Build and follow a solid trading plan.
3.Apply strict risk management (4–6% rule).
4.Stay disciplined—control fear and greed.
5.Record and analyze every trade.
6.Focus on high-quality setups only.
7.Diversify across assets and markets.
8.Keep evolving—study, adapt, and grow daily.

Inflection Point NVDA has a hammerhead candle on a key level and the 50 EMA and the 0.786 Fibonacci level.
Oscillators are flashing oversold. For bullish activity we need a bullish candle with a close above 188.15 and next resistance will be around 191 or 190.70. If price breaks below the 50 EMA(185.19) next key level will be 177.10

Going for 210 soonIt is still inside the channel, it needs to break the upper trendline. Once it breaks the trendline it will go rocket. My first PT is 210.
NFA

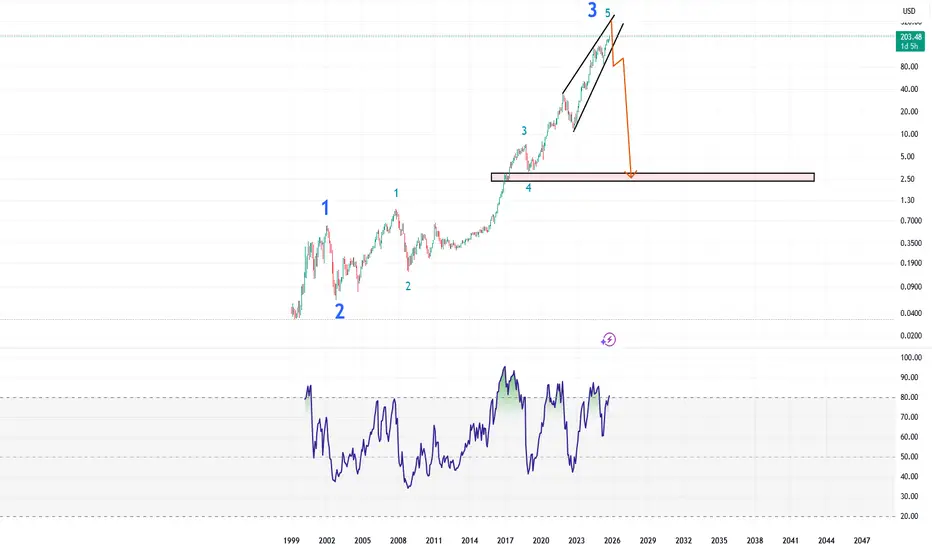
China gonna crash it or what?This monthly corrective pattern is wild — a nosedive from $300 to $3 (yep, you read that right).
Maybe China, maybe aliens, who knows!
But the real story is the aftermath — scoop up millions at $3 and you’re officially a billionaire (on paper, at least).
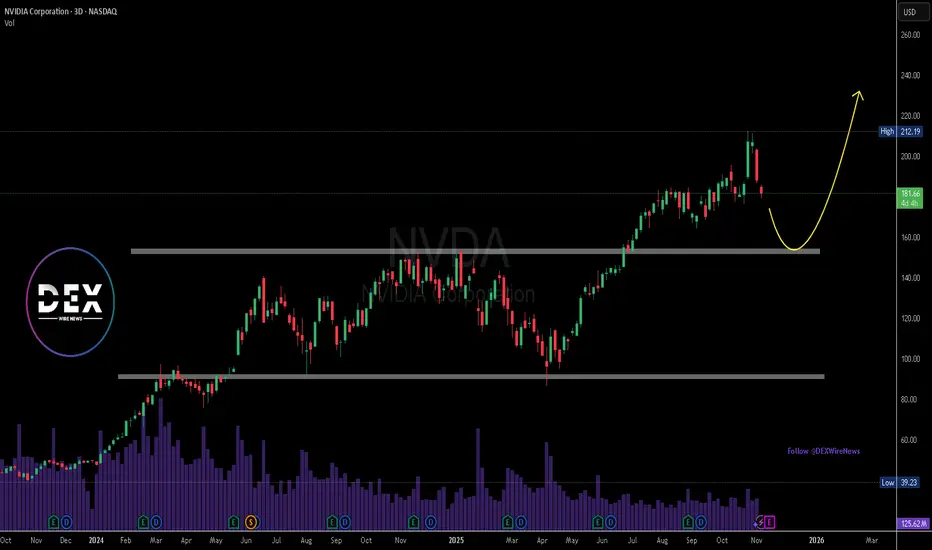
Nvidia Corp.($NVDA) Drops as U.S. Blocks AI Chip Sales to China Nvidia Corp. (Nasdaq: NASDAQ:NVDA ) shares dropped 4.18% to $180.22 on Friday after reports that Washington will block the company’s sales of scaled-down AI chips to China. The decision marks another escalation in U.S. restrictions on advanced semiconductor exports.
According to The Information, the White House informed several federal agencies that Nvidia will not be allowed to sell its new B30A AI chip to Chinese firms. Nvidia had already provided samples to some customers in China before the ban was confirmed.
The B30A was designed to meet U.S. export thresholds while retaining enough computing power for AI training when used in large clusters. However, U.S. officials reportedly concluded that the chip still poses national security risks.
Compounding Nvidia’s challenges, Beijing has issued new guidelines restricting foreign chips in state-backed data centers. Reuters reported that China will require all new projects using government funding to rely solely on domestically developed processors. Data centers less than 30% complete must remove foreign chips, while advanced projects will face case-by-case reviews.
Technical View
The NVDA chart shows a recent rejection from the $212 level, with price sliding toward $180. A further decline toward $160 support is possible before a rebound, as indicated by the yellow curve. Long-term structure remains bullish, but near-term weakness persists under regulatory pressure
NVDA at the $200 BattlefieldThe daily chart of NVIDIA (NVDA) shows that after a sharp rally from around $180, the price is now consolidating near a key resistance zone between $200–$205. This level has previously acted as a major resistance area, and it’s now a critical decision point for the next move.
Short-Term Outlook (next few days to weeks):
In the short term, how the price reacts to the $200 zone will be crucial. The latest candle shows a long upper wick and a close below the day’s high, signaling selling pressure. If the price fails to hold $200, a pullback toward the 50-day SMA near $183 is likely.
However, if NVDA can regain and close firmly above $205, bullish momentum could accelerate, targeting the $215–$220 area next.
• Bullish short-term target: $215–$220
• Bullish stop loss: Below $198
• Bearish short-term target: $185 (near the 50-day SMA)
• Bearish stop loss: Above $206
Long-Term Outlook (1–3 months):
The broader trend remains bullish as the 50-day SMA is sloping upward and price remains above it. Sustained closes above $205–$210 would likely confirm a continuation of the uptrend, potentially leading to new highs around $230–$245.
If the $180 support fails, however, the medium-term structure would weaken, opening the door for a deeper correction toward $160.
• Bullish long-term target: $230–$245
• Long-term stop loss: Below $180
In summary, the $200 level is the market’s decision point — a confirmed breakout above it could spark another leg higher, while a breakdown below may lead to a healthy but notable correction.

Buffett says buy when everyone else is selling, right?Long at 188.08. Even if you assume that NVDA and the whole market are correcting, I say so what. There are lots worse places to ride out a market correction than NVDA.
And not for nothing, but I've posted 7 ideas on NVDA here so far. 6 of them were during its 36% drop from Nov '24 to Apr '25. All 12 trades that were part of those ideas paid me. Every. Single. One. The average gain on those 12 trades was nearly 6%. You can make money long while stocks drop. I do it all the time.
Those were also times when people were saying the AI bubble was popping, that AI was over hyped. Michael Burry was shorting NVDA during at least part of that. I don't care. Those kinds of things don't have much to do with day to day stock movements, and what I do has mountains of data behind it that show that kind of thing isn't relevant to what I do.
Going to zero quickly is the big risk to what I'm doing here, and I assure you, if NVDA goes to zero quickly, there will be nowhere to hide. I'll take my chances with the company that takes in $500M a DAY in revenues. This stock's fall is extremely overdone currently, in my opinion, adding to this trade's allure for me.
I will exit here fairly quickly - no need to give back what the market gives me. I'm no HODLer. I take my money and run. If I can do it in one day, so much the better. If I'm forced to hold, tactically adding and selling until I close the position overall will be done according to price action.
As always - this is intended as "edutainment" and my perspective on what I am or would be doing, not a recommendation for you to buy or sell. Act accordingly and invest at your own risk. DYOR and only make investments that make good financial sense for you in your current situation.

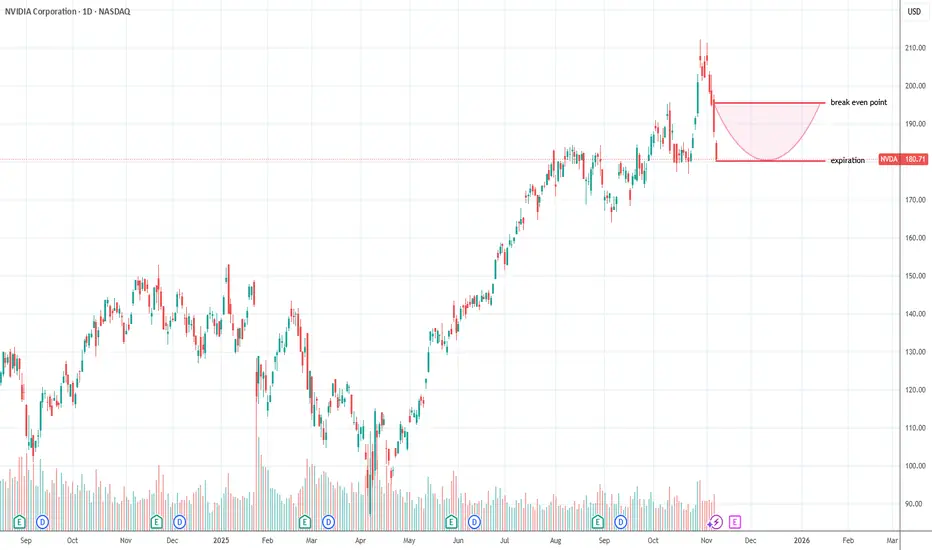
Re-Entering NVD - Eyeing Mid-November ReversalReopened long on NVDA with Jan 16 ’26 $180 Call at 16.50. Expecting rebound from recent 13% drop and continuation higher through Q4 as momentum returns.
NVIDIA – A New World First, Where Next?A mere 24 hours after Apple become the third company in history to reach a $4 trillion valuation, NVIDIA set a new benchmark by becoming the first company ever to register a market capitalisation of $5 trillion.
Despite concerns about over extended valuations, the news flow for NVIDIA was initially positive to start this new week as the company attempts to solidify its future at the centre of the potential AI revolution.
CEO Jensen Huang revealed the company had received $500 billion of AI chip orders, including contracts to build supercomputers for the US government and then President Trump commented on Wednesday that NVIDIA’s latest Blackwell chips could be a discussion point when he meets with President Xi at Thursday’s summit in South Korea.
Putting this into numbers, after opening on Monday at 189.25, the stock soared 12% across the first 3 trading days to a high of 212.19 on Wednesday. That move brought its year-to-date rally to 54%, very impressive indeed! Although, it must be said that prices did slip back to close the day at 207.04.
However, overnight the positive sentiment may have stalled slightly, the Federal Reserve cut interest rates 25bps as expected but Chairman Powell provided a more cautious outlook on future cuts than had been anticipated. Also, earnings from Alphabet, Microsoft and Meta released late on Wednesday were mixed, with strong profits offset by rising costs.
Looking forward, the initial updates from the President Trump and President Xi meeting has started to arrive on newswires and traders will be keen to assess the actual details of what was discussed about NVIDIA chip sales between the two countries. A crucial aspect could be whether sales of NVIDIA’s latest Blackwell chip was discussed and if not, what were the reasons why.
Then it’s eyes down for the release of Amazon and Apple earnings after the close tonight which could either confirm the recent bullish moves or throw a sentiment curve ball which could negatively impact in positioning into the weekend.
Technical Update: Acceleration Higher Shifts Focus to Extension Resistance
In just six trading sessions, NVIDIA's share price has rallied over 20%, reaching fresh all-time highs. Such a rapid acceleration can often signal strong momentum but also raises the risk of short-term upside exhaustion, although it's difficult to pinpoint where such moves might slow or even see risks of possible reversal.
In this environment, traders might monitor support and resistance levels, with resistance zones signalling potential for profit-taking, while breaks below support could lead to further price weakness.
[b Potential Resistance Levels:
As price action pushes into uncharted territory with new all-time highs, identifying resistance becomes a challenge. However, traders often turn to Fibonacci extension levels, derived from the most recent correction, to highlight potential areas where upside momentum may slow or even reverse.
As the chart above shows, for NVIDIA, this last correction developed between October 10th and October 22nd and the latest strength appears to be stalling in the short term ahead of 213.23, a level equal to the 100% Fibonacci extension.
There is no guarantee such extension levels will be successful in capping price strength and closing breaks above the 213.23 resistance may shift focus to 220.14, which is the higher 138.2% extension level.
Potential Support Levels:
To maintain NVIDIA’s current price strength, traders may now be focused on Wednesday’s low at 204.78 as near-term support; if price weakness tests this level, its defense will be watched, as a closing break below 204.78 could trigger further downside pressure.
A close below 204.78 could lead to tests of 198.59, the 38.2% Fibonacci retracement of the October 22nd to 29th rally, but if that support gives way, risks may extend toward 194.39, the deeper 50% retracement level.
The material provided here has not been prepared accordance with legal requirements designed to promote the independence of investment research and as such is considered to be a marketing communication. Whilst it is not subject to any prohibition on dealing ahead of the dissemination of investment research, we will not seek to take any advantage before providing it to our clients.
Pepperstone doesn’t represent that the material provided here is accurate, current or complete, and therefore shouldn’t be relied upon as such. The information, whether from a third party or not, isn’t to be considered as a recommendation; or an offer to buy or sell; or the solicitation of an offer to buy or sell any security, financial product or instrument; or to participate in any particular trading strategy. It does not take into account readers’ financial situation or investment objectives. We advise any readers of this content to seek their own advice. Without the approval of Pepperstone, reproduction or redistribution of this information isn’t permitted.

NVDA Pullback or Trend Break? (Nov 10–14)Full Multi-Timeframe Outlook
NVDA just had one of its sharpest weekly pullbacks in months, and this week is all about figuring out whether this drop is simply a reset inside the bigger bullish trend or the start of a deeper correction. I’ll walk through each timeframe so traders can understand the structure clearly.
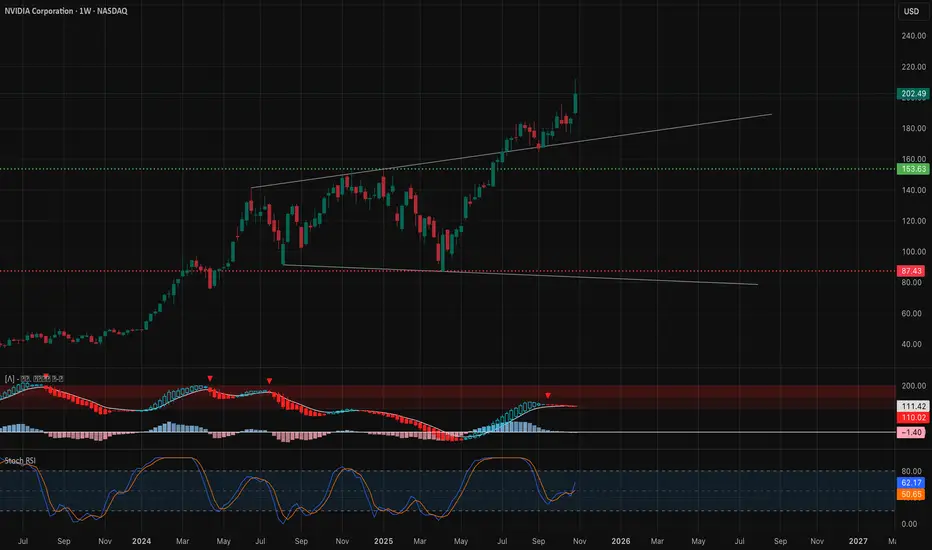
1. Weekly Timeframe (1W)
Macro Structure
NVDA finally tapped the top of the long-term rising wedge and rejected aggressively. Even with the deep weekly red candle, the bigger structure hasn’t broken yet — NVDA is still sitting above the main weekly trendline that carried the entire 2023–2025 bull run.
Weekly demand starts around 153–160. Price hasn’t reached that level yet, but the rejection candle shows sellers finally stepping in with size.
Weekly MACD is rolling over for the first time since mid-summer. Stoch RSI is turning down from overbought. Both suggest momentum is cooling on the larger timeframe.
Weekly Trade View
Watch how NVDA reacts around the trendline near 184–188. As long as NVDA stays above 153–160, the larger trend remains bullish, but a break below 184 adds pressure.
Weekly GEX Perspective
Below 180, negative GEX expands heavily, which tends to increase volatility on the downside.
Above 200, positive GEX slows the upside.
This places NVDA in the middle of a high-energy zone — whichever way it breaks next will likely extend for days.
2. Daily Timeframe (1D)
Daily Trend and Structure
The daily chart is where the weakness is more visible. We already printed a downside CHoCH, confirming a short-term trend shift. NVDA has also broken its rising channel from September, which means sellers took control temporarily.
Key daily support sits at 176–184. That’s a demand cluster plus the midpoint of the previous impulse. The daily candle you posted shows NVDA sitting right on this zone.
Daily MACD crossed bearish and continues to widen. Stoch RSI is oversold but hasn’t curled yet — usually a sign that a bounce needs more time to develop.
Daily Trade View
Hold 184 → NVDA can bounce back toward 195 then 202.
Break 176 → opens a deeper retracement toward 164 and even 153.
Daily GEX View
There is a major put wall around 178–180.
This level often acts like a gravitational pull, especially in pullbacks.
The next put concentration is near 164.
Unless NVDA reclaims 190–195 quickly, the daily structure still favors a retest of these lower zones.
3. 1-Hour Timeframe (1H)
Short-Term Structure
You can see NVDA has been sliding down the descending intraday channel for days. The most recent BOS is bearish, but the latest CHoCH shows buyers finally trying to step in around 178.
Price is now approaching the 190 resistance — this is the intraday pivot for the week.
1H MACD is curling upward, showing the first momentum shift since early November. Stoch RSI is rising fast, confirming short-term buyers entering.
1H Trade View
Above 190 → opens room toward 195 then 202.
Reject 190 → NVDA likely rolls back toward 184 then 178.
The 190 break is the whole game for intraday momentum.
4. 15-Minute Timeframe (15M)
Intraday View
The 15M shows the cleanest structure:
A strong BOS just formed, and NVDA broke the intraday trendline. This is the first real bullish sign since the selloff started.
However, the CHoCH that printed after the BOS is sitting right underneath the 188–190 ceiling. That means the sellers still sit overhead waiting.
MACD on 15M is trending strongly upward — momentum is on the bulls’ side right now.
15M Trade View
Break and hold above 188–190 → intraday long toward 195.
Reject 188–190 → expect a fade back toward 184.
This level aligns across all lower timeframes, which makes it extremely important for Monday and Tuesday.
5. GEX Map & Options Strategy
GEX Interpretation for NVDA (This Week)
The GEX chart shows:
Positive GEX at 195–205
Negative GEX at 178–180
A major put wall at 178.91
A major call wall at 202–205
What this means:
Under 180 → volatility expands downward as dealers hedge.
Over 195 → upside will feel slower and grindy, not explosive.
202–205 → heavy call wall likely to act as a ceiling unless NVDA has strong momentum.
Options Strategy
If NVDA rejects 188–190:
Short-dated puts targeting 180 or 178 make sense.
If NVDA reclaims 190 and holds:
Short-dated calls targeting 195 or 202 are the better play.
Avoid chasing anything above 205 — that’s deep inside positive GEX and tends to stall.
My Thought
NVDA is in a very interesting spot going into the week. Higher timeframes are still bullish, but the daily and intraday charts clearly show the momentum shift to the downside. Everything comes down to how price reacts between 188 and 190.
Rejecting that zone keeps the pullback alive toward 184–178.
Breaking above that zone starts the recovery toward 195–202.
This is a week where levels matter more than bias. The reaction at 188–190 will decide which side controls NVDA next.
Disclaimer
This analysis is for educational purposes only and not financial advice. Always trade your own plan and manage your risk. If you want a breakdown on another ticker, just drop it in the comments.

Nvidia - Squeezing every single bear!🧯NVidia ( NASDAQ:NVDA ) is finally breaking out:
🔎Analysis summary:
Over the course of the past couple of months, Nvidia has been rallying +125%. Considering the market cap of Nvidia, this is already an insane move but clearly not the end. We can still see another +25% from here, before Nvidia will then retest the next resistance.
📝Levels to watch:
$250
SwingTraderPhil
SwingTrading.Simplified. | Investing.Simplified. | #LONGTERMVISION

NVDA Wave Analysis – 5 November 2025
- NVDA reversed from resistance area
- Likely to fall to support level 193.75
NVDA recently reversed from the resistance area between the key resistance level 210.00 (which stopped the previous impulse wave i), resistance trendline of the daily up channel from June and the upper daily Bollinger Band.
The downward reversal from this resistance area started the active short-term ABC correction ii – which belongs to wave iii from last month.
Given the strength of the resistance level 210.00 and the bearish divergence on the daily Stochastic indicator, NVDA can be expected to fall to the next support level 193.75, former resistance from the start of October.

NVDA (NVIDIA) – Buy PlanNVDA (NVIDIA) – Buy Plan
📊 Market Sentiment
On October 29, the FED lowered rates by 25bps as expected. However, Powell’s remarks introduced uncertainty around further cuts in December, emphasizing that future policy will depend on incoming data.
One FED member dissented, preferring no cut this cycle — a notable shift from September’s unanimous decision.
Additionally, ADP Non-Farm Employment Change came at 42K versus 32K expected. It’s slightly higher, but since other macro data are missing due to the U.S. government shutdown, the overall sentiment remains mixed.
For now, macro sentiment leans bearish, as rate cuts may be delayed into 2026.
However, with NVDA earnings approaching, we could see a short-term bullish sentiment building around the stock.
📈 Technical Analysis
NVDA is currently trading around the 0.5 equilibrium zone, which aligns with the HTF bullish trendline.
This area could provide temporary support and a potential bounce setup.
However, it’s crucial to watch the SPY structure as it may influence NVDA’s short-term movement.
📌 Game Plan / Expectations
I’ll be watching the $185–$180 range as a key HTF support zone.
This area also aligns with a possible trendline deviation, where price could manipulate below the trendline to trap sellers before reclaiming it.
I plan to buy call options within this range, targeting a continuation of the bullish leg post-earnings.
💬 If this breakdown aligns with your outlook, like and comment below.
For deeper sentiment and strategy insights, subscribe to my Substack — free access available.
⚠️ Disclaimer
This analysis is for educational purposes only and does not constitute financial advice. Always conduct your own research before trading or investing.

NVDA-Bulls Defend Trendline Into Gamma Week (Nov. 3–7)NVDA Weekly Squeeze Setup 🔥
WEEKLY TIMEFRAME ANALYSIS
1. Market Structure
NVDA remains in a strong macro uptrend on the weekly. Recent BOS confirmations to the upside are intact, and the latest pullback retested the long-term ascending trendline perfectly. We’ve seen a subtle CHoCH attempt in prior weeks, but buyers stepped in aggressively on structure breaks. Liquidity remains stacked below around $153–$160, and smart money continues defending dips rather than chasing breakouts — a healthy sign of accumulation rather than distribution.
2. Supply & Demand / Order Blocks
There’s a key demand pocket sitting around $180–$190 from previous imbalance fills. The closest unmitigated bullish order block lives near $153 — that’s the nuclear level if we ever wash out. On the supply side, overhead inefficiency spans between $220–$230, where sellers historically rotate in. If price pushes into that region with thin volume, expect reactions.
3. Indicator Confluence
The 9EMA remains firmly above the 21EMA with a positive slope, confirming trend continuation. MACD histogram is still green, though showing early signs of momentum slowing — not reversal. RSI is elevated, but not at exhaustion levels. Weekly volume looks constructive; we’re not seeing blow-off distribution.
4. Weekly Tone
As long as NVDA stays above the weekly trendline near $195, bulls maintain control. Break below that, and things could get uncomfortable fast. The structure favors continuation, but expect profit-taking wicks.
DAILY TIMEFRAME ANALYSIS
1. Market Structure
Daily structure flipped bullish after a clean BOS from the prior swing high. The recent pullback respected support at $195.62 and reclaimed structure. Liquidity is still stacked at $190 and $184 — levels shorts would love to hunt. Smart money tends to dip price into these zones before running it into fresh highs.
2. Supply & Demand / Order Blocks
There’s a visible demand block at $184–$190 that has been tapped, but not fully mitigated. Supply overhead sits around $212–$217, which aligns with prior liquidity sweeps. If price pushes into that band with increasing volume, we could see continuation; otherwise, emotional wicks can form.
3. Indicator Confluence
9EMA curling sharply upward over the 21EMA — textbook bullish engine. MACD histogram shows expansion but with minor slowing bars; keep an eye on that slope. RSI remains healthy around mid–upper band, signaling momentum not overheated. Volume expansion shows the buyers aren’t exhausted yet.
4. Daily Tone
Bulls want to keep price above $200 to avoid gamma pressure on the downside. Below $198, we start inviting liquidity hunts.
15–MINUTE INTRADAY STRUCTURE
1. Market Structure
Short-term structure on 15m printed a CHoCH followed by BOS continuation into the closing session. We now have a small wedge structure forming just above intraday liquidity around $202.08–$202.36. If bulls defend these micro OBs, we can see a morning leg up.
Weak hands got shaken near $201, and smart money collected stops. Classic intraday accumulation profile.
2. Supply & Demand / Order Blocks
Demand sits at:
• $202.30–$202.60
• $201.80–$202.10
Below that? $199–$200 is the bigger reload pocket.
Supply zones to watch:
• $204.75–$205.10
• $207.90–$208.20
Everything in between is chop bait.
3. Indicator Confluence
9EMA trying to curl back up toward 21EMA. MACD histogram contracting to flat — sign of potential inflection. RSI pushing toward mid-band, which usually favors a scalp bounce early session if defended.
4. Intraday Tone
Expect a morning decision candle. If bulls can take $204.75 clean, we likely rotate into the $207 liquidity pocket.
GEX (Gamma Exposure) & OPTIONS SENTIMENT
Options flow favors call-side interest, with meaningful call walls stacked at:
• $210
• $217.5
• $220
Gamma walls often behave like magnets when price gets within 1–2%.
Noteworthy negative gamma sits lower at:
• $179–$180
If NVDA ever flushes below $195, dealers must hedge into downside momentum — accelerating moves. Conversely, above $205, dealer hedging acts as fuel for upside squeezes.
Max pain appears around $200 — this explains why price has gravitated around this area into the weekend.
How to use this:
• Above $205 → scalp continuation long into $207–$210.
• Below $200 → volatility spikes, favor puts.
Expect volatility compression between $200–$205 early week, then a directional release.
TRADE SCENARIOS (Nov. 3–7)
✅ Bullish Setup
Trigger: Break and hold above $204.75
Entry: Retest of $204.40–$204.60
Targets: $207.80 → $210 → potential wick into $217
Stop: Below $202.50
Invalidation: 15m CHoCH to downside at $202.10.
✅ Bearish Setup
Trigger: Break below $200 with heavy volume
Entry: Retest of $200–$200.30
Targets: $195.60 → $190 liquidity sweep
Stop: Above $202.50
Invalidation: reclaim of $204.75.
CLOSING OUTLOOK
This week sets up like a controlled grind with pockets of volatility. If bulls defend $200–$202 early, it can ignite a squeeze toward $210 and possibly tap the $217 gamma pocket. Failure at $200, especially with broad market weakness, flips this into a liquidity hunt down to $190.
Personally, I’m watching for liquidity traps around $202 early week — if I see absorption, I’ll lean long into call walls. But if we reject from $204.75 again with declining volume, expect a fast unwind.
DISCLAIMER
This analysis is for educational purposes only and does not constitute financial advice. Always manage risk and trade based on your own plan.
NVIDIA Technical Breakdown – November 2025Structure : Price broke out of a descending channel, retested the breakout zone, and is now hovering near a double top resistance.
Fibonacci Confluence: Price is reacting near the 50–61.8% retracement zone, a key decision area for continuation or rejection.
Liquidity Grab: A red-marked zone below shows where stop-losses were likely triggered before reversal — classic accumulation behavior.
Volume & RSI: Volume faded post-breakout, and RSI shows early signs of divergence — momentum is slowing, but not yet reversing.
Scenario Planning:
Bullish: Break and hold above double top zone with volume → target $206–$214.
Bearish: Rejection + RSI divergence → pullback to $183–$178 support.
Watching for confirmation above the double top zone. Liquidity grab + fib confluence suggest potential continuation, but momentum needs to align.
Follow @GoldenZoneFX for more content and valuable insights.

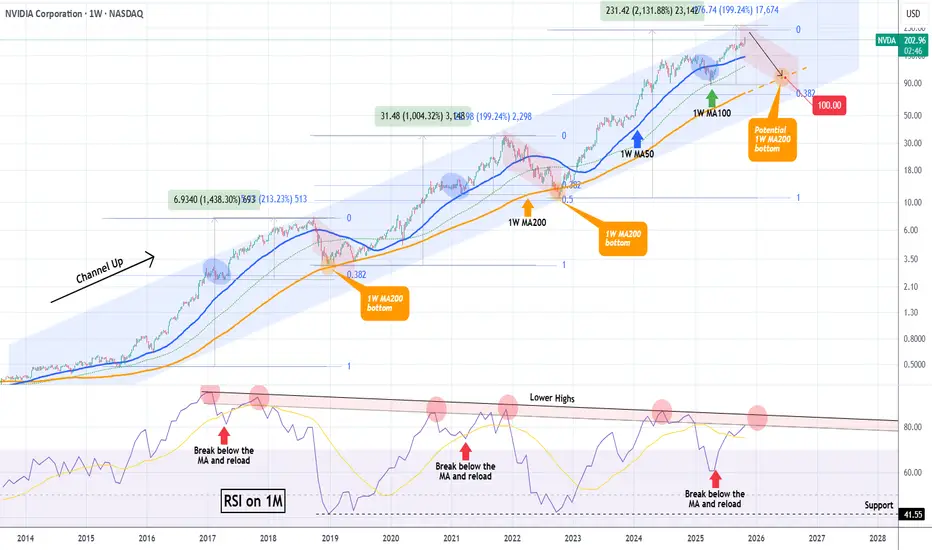
NVIDIA hit $5 Trillion but the end of the rally may be near.NVIDIA Corporation (NVDA) broke this week the $5 Trillion market cap barrier, becoming the first company to do so. In the meantime, it is extending the rally that started on the April 07 Low on the 1W MA100 (green trend-line), following the end of the Tariff War.
This rally has been nothing more than a part of the larger technical Bullish Leg inside the 10-year Channel Up that NVIDIA has been trading in. Within this pattern, the price has had rather asymmetric Bullish Legs in terms of rise % but has always been rejected at the top of the Channel Up and corrected back to the 1W MA200 (orange trend-line).
Following the mid-Bullish Leg corrections to the 1W MA50 (blue trend-line), the final rallies of the Bullish Legs before their Tops have been around +200%. Then their corrections/ Bearish Legs have always hit the 1W MA200 (as mentioned), with one time bottoming just above the 0.382 Fibonacci retracement level and the other below it (0.5 Fib).
We previously had NVIDIA's top at around $240, which is slightly below this expected +200% rise from the 1W MA100 bottom. As a result, we project that a potential contact with the 1W MA200 for the 2026 Bearish Leg can be achieved around $100, which is above the 0.382 Fib, similar to 2018.
Note that a very reliable Top indicator has also been the 1M RSI and its 9-year Lower Highs Zone. Every time the RSI entered the Zone and then broke below its MA (yellow trend-line) and rebounded, the next hit was the Bullish Leg's Top. Right now the 1M RSI is about to enter this Zone for the second time, indicating that we may be approaching the end of this long-term rally.
-------------------------------------------------------------------------------
** Please LIKE 👍, FOLLOW ✅, SHARE 🙌 and COMMENT ✍ if you enjoy this idea! Also share your ideas and charts in the comments section below! This is best way to keep it relevant, support us, keep the content here free and allow the idea to reach as many people as possible. **
-------------------------------------------------------------------------------
💸💸💸💸💸💸
👇 👇 👇 👇 👇 👇