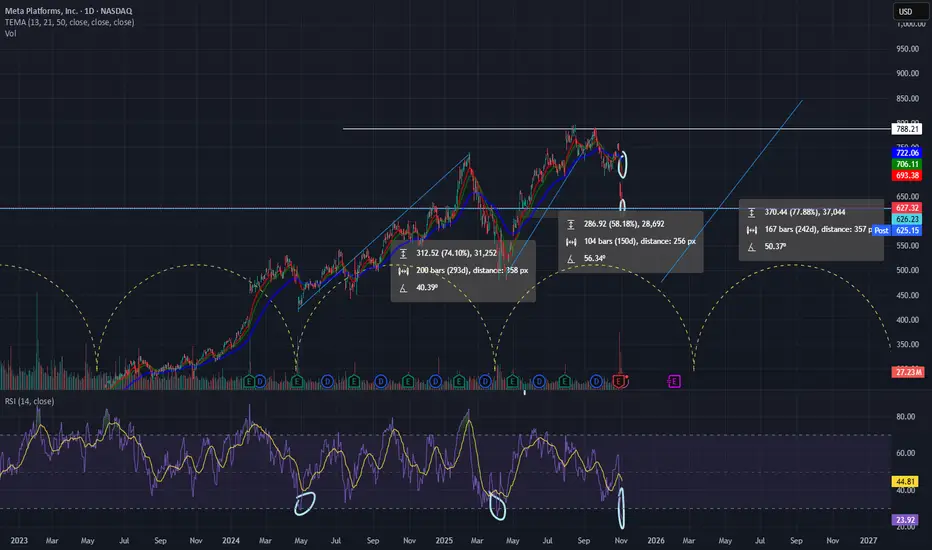
META: Next Long Term Buy Following a disappointing earnings report, Meta (META) dropped more than 10% in post-market trading, decisively breaking through several key support levels. My primary support zones are typically derived from anchored VWAPs (Volume-Weighted Average Prices), which help identify where institutional bu
Key facts today
Next report date
—
Report period
—
EPS estimate
—
Revenue estimate
—
23.18 USD
62.36 B USD
164.50 B USD
2.17 B
About Meta Platforms, Inc.
Sector
Industry
CEO
Mark Elliot Zuckerberg
Website
Headquarters
Menlo Park
Founded
2004
ISIN
US30303M1027
FIGI
BBG009STMY16
Meta Platforms, Inc. engages in the development of social media applications. It builds technology that helps people connect and share, find communities, and grow businesses. It operates through the Family of Apps (FoA) and Reality Labs (RL) segments. The FoA segment consists of Facebook, Instagram, Messenger, WhatsApp, and other services. The RL segment includes augmented, mixed and virtual reality related consumer hardware, software, and content. The company was founded by Mark Elliot Zuckerberg, Dustin Moskovitz, Chris R. Hughes, Andrew McCollum, and Eduardo P. Saverin on February 4, 2004, and is headquartered in Menlo Park, CA.
Related stocks

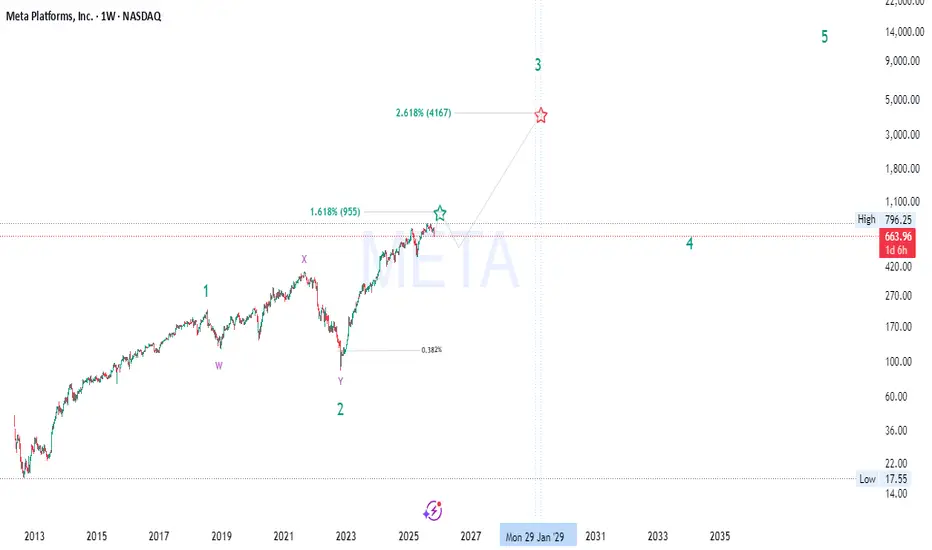
Be patient to jump onto MetaMeta completed its grand cycle 3 on elliot wave structure and entering onto wave 4 now. Wave 4 typically retraces to 0.618 or 0.5 levels of wave 3 which is the zone marked in the box.
That zone is also a demand zone and 500 level is the long standing trend line level. If you are eyeing an entry, be

Meta long Meta dumped on earnings because of a one time tax event. I have long been following this company and have missed obvious setups multiple times. We are right at the .5 fib. This megaphone was drawn on the monthly chart but I zoomed in to show the swing trade setup I am looking at.
We note a basing O

META Cycle Analysis – Possible Macro Bottom FormingMETA just hit a major technical confluence zone around $620–625, aligning with previous cycle lows and a deeply oversold RSI (~24).
Every prior RSI flush at this level (2023, early 2024) has marked the start of a new multi-month leg higher.
The current structure mirrors META’s past rhythm — roughly
Meta 4 hr timeframe is too oversold , Macd on the monthly looks horrible it crossed bearish I think meta pull back a little bit then continue the downtrend no reason for a bullish reversal but only a small pullback do to being way to oversold

The META drop explainedSo what happend to META last week:
I see a lot of you wondering what happend to the stock and what caused the drop.
The answer is simple. The EPS was not so good.
We can see on the chart that the EPS is only 1.05 and that they expected 6.723 . That is a chance of -84.38%.
So for that big o
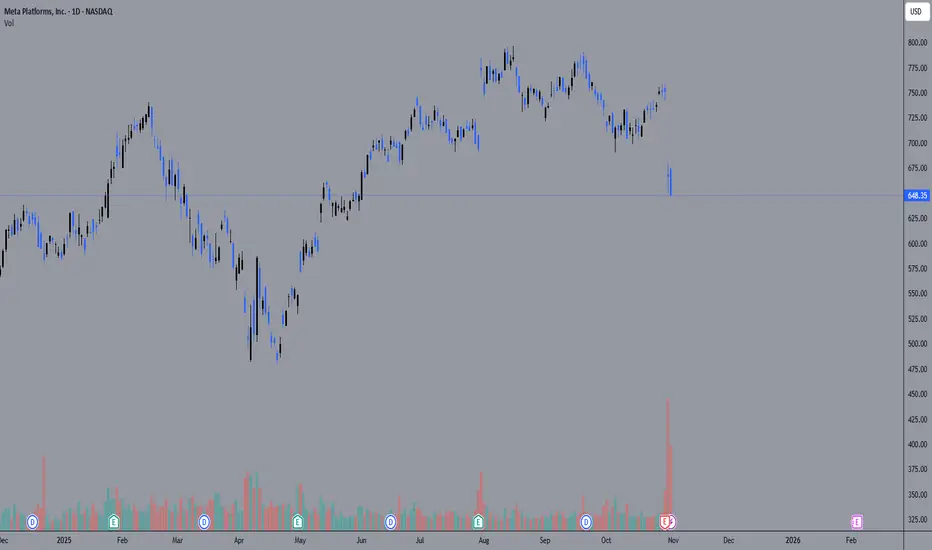
META watch $634-641: Semi-Major Support may hold Earnings DUMP META apparently disappointed with its last earnings report.
Approaching a "Semi-Major" support zone at $634.32-641.88
Look for a clean bounce or look lower like $600 for next try.
.
This is a followup to my TOP CALL given by Dual Goldens:
Hit BOOST and FOLLOW for more such PRECISE and TIMELY cha

Meta Could Be OversoldMeta Platforms plunged after its last quarterly report on October 29, but some traders may think the social-media giant is oversold.
The first pattern on today’s chart is the May 23 weekly close of $627.06. Prices tested and held the level on Tuesday and Wednesday, which could make some traders thi

Meta Platforms (META) shares plunge 11%Meta Platforms (META) shares plunge 11%
On Wednesday, Meta Platforms (META) released its quarterly report, which included several positive highlights:
→ revenue rose to $51.2 billion (forecast: $49.5 billion);
→ the size of the daily active audience increased to 3.54 billion people.
However, META

META’s Hidden Fibonacci Path to 4000+ — Don’t Miss Wave 3🚀 META Long-Term Elliott Wave + Smart Money Macro Outlook
🌊 Elliott Wave Structure (662→955→4000+)
META appears to be progressing through a major impulsive 5-wave supercycle on the weekly timeframe:
Wave 1: The initial breakout from accumulation (2015–2021), fueled by growth in advertisi
See all ideas
Summarizing what the indicators are suggesting.
Neutral
SellBuy
Strong sellStrong buy
Strong sellSellNeutralBuyStrong buy
Neutral
SellBuy
Strong sellStrong buy
Strong sellSellNeutralBuyStrong buy
Neutral
SellBuy
Strong sellStrong buy
Strong sellSellNeutralBuyStrong buy
An aggregate view of professional's ratings.
Neutral
SellBuy
Strong sellStrong buy
Strong sellSellNeutralBuyStrong buy
Neutral
SellBuy
Strong sellStrong buy
Strong sellSellNeutralBuyStrong buy
Neutral
SellBuy
Strong sellStrong buy
Strong sellSellNeutralBuyStrong buy
Displays a symbol's price movements over previous years to identify recurring trends.
US30303M8D7
Meta Platforms, Inc. 3.85% 15-AUG-2032Yield to maturity
14.09%
Maturity date
Aug 15, 2032
FB5458295
Meta Platforms, Inc. 4.65% 15-AUG-2062Yield to maturity
5.87%
Maturity date
Aug 15, 2062
FB6221365
Meta Platforms, Inc. 5.75% 15-NOV-2065Yield to maturity
5.78%
Maturity date
Nov 15, 2065
FB5868810
Meta Platforms, Inc. 5.55% 15-AUG-2064Yield to maturity
5.77%
Maturity date
Aug 15, 2064
FB5581331
Meta Platforms, Inc. 5.75% 15-MAY-2063Yield to maturity
5.75%
Maturity date
May 15, 2063
FB5522241
Meta Platforms, Inc. 4.65% 15-AUG-2062Yield to maturity
5.70%
Maturity date
Aug 15, 2062
FB6221364
Meta Platforms, Inc. 5.625% 15-NOV-2055Yield to maturity
5.65%
Maturity date
Nov 15, 2055
FB5868809
Meta Platforms, Inc. 5.4% 15-AUG-2054Yield to maturity
5.65%
Maturity date
Aug 15, 2054
FB5581330
Meta Platforms, Inc. 5.6% 15-MAY-2053Yield to maturity
5.64%
Maturity date
May 15, 2053
FB5522214
Meta Platforms, Inc. 4.45% 15-AUG-2052Yield to maturity
5.62%
Maturity date
Aug 15, 2052
FB6221369
Meta Platforms, Inc. 5.5% 15-NOV-2045Yield to maturity
5.51%
Maturity date
Nov 15, 2045
See all META bonds
Curated watchlists where META is featured.


Frequently Asked Questions
The current price of META is 615.20 USD — it has decreased by −0.77% in the past 24 hours. Watch Meta Platforms Inc Class A stock price performance more closely on the chart.
Depending on the exchange, the stock ticker may vary. For instance, on BVL exchange Meta Platforms Inc Class A stocks are traded under the ticker META.
META stock has fallen by −7.63% compared to the previous week, the month change is a −13.60% fall, over the last year Meta Platforms Inc Class A has showed a 4.31% increase.
We've gathered analysts' opinions on Meta Platforms Inc Class A future price: according to them, META price has a max estimate of 1,117.00 USD and a min estimate of 560.00 USD. Watch META chart and read a more detailed Meta Platforms Inc Class A stock forecast: see what analysts think of Meta Platforms Inc Class A and suggest that you do with its stocks.
META reached its all-time high on Aug 15, 2025 with the price of 795.00 USD, and its all-time low was 90.00 USD and was reached on Nov 4, 2022. View more price dynamics on META chart.
See other stocks reaching their highest and lowest prices.
See other stocks reaching their highest and lowest prices.
META stock is 2.48% volatile and has beta coefficient of 1.40. Track Meta Platforms Inc Class A stock price on the chart and check out the list of the most volatile stocks — is Meta Platforms Inc Class A there?
Today Meta Platforms Inc Class A has the market capitalization of 1.57 T, it has increased by 2.19% over the last week.
Yes, you can track Meta Platforms Inc Class A financials in yearly and quarterly reports right on TradingView.
Meta Platforms Inc Class A is going to release the next earnings report on Feb 4, 2026. Keep track of upcoming events with our Earnings Calendar.
META earnings for the last quarter are 1.05 USD per share, whereas the estimation was 6.72 USD resulting in a −84.38% surprise. The estimated earnings for the next quarter are 8.20 USD per share. See more details about Meta Platforms Inc Class A earnings.
Meta Platforms Inc Class A revenue for the last quarter amounts to 51.24 B USD, despite the estimated figure of 49.51 B USD. In the next quarter, revenue is expected to reach 58.21 B USD.
META net income for the last quarter is 2.71 B USD, while the quarter before that showed 18.34 B USD of net income which accounts for −85.23% change. Track more Meta Platforms Inc Class A financial stats to get the full picture.
Yes, META dividends are paid quarterly. The last dividend per share was 0.52 USD. As of today, Dividend Yield (TTM)% is 0.33%. Tracking Meta Platforms Inc Class A dividends might help you take more informed decisions.
Meta Platforms Inc Class A dividend yield was 0.34% in 2024, and payout ratio reached 8.38%. The year before the numbers were 0.00% and 0.00% correspondingly. See high-dividend stocks and find more opportunities for your portfolio.
As of Nov 8, 2025, the company has 74.07 K employees. See our rating of the largest employees — is Meta Platforms Inc Class A on this list?
EBITDA measures a company's operating performance, its growth signifies an improvement in the efficiency of a company. Meta Platforms Inc Class A EBITDA is 99.66 B USD, and current EBITDA margin is 51.83%. See more stats in Meta Platforms Inc Class A financial statements.
Like other stocks, META shares are traded on stock exchanges, e.g. Nasdaq, Nyse, Euronext, and the easiest way to buy them is through an online stock broker. To do this, you need to open an account and follow a broker's procedures, then start trading. You can trade Meta Platforms Inc Class A stock right from TradingView charts — choose your broker and connect to your account.
Investing in stocks requires a comprehensive research: you should carefully study all the available data, e.g. company's financials, related news, and its technical analysis. So Meta Platforms Inc Class A technincal analysis shows the sell today, and its 1 week rating is sell. Since market conditions are prone to changes, it's worth looking a bit further into the future — according to the 1 month rating Meta Platforms Inc Class A stock shows the neutral signal. See more of Meta Platforms Inc Class A technicals for a more comprehensive analysis.
If you're still not sure, try looking for inspiration in our curated watchlists.
If you're still not sure, try looking for inspiration in our curated watchlists.