XLE BearLong Term Bearish on XLE
The deflation narrative is now the contrarian narrative . However, XLE the SPDR Energy giant is signaling a hefty drop on the 3M stochastic RSI . This signal has been produced 3 times in the last two decades leading to multiple 50%+ drops in value of the fund.
The 5-wave impulsive move looking for a similar 3 wave a-b-c corrective wave down to it's most recent corrective wave.
The yield curve un-inversion (zoom in on a 10Y/02Y) is signaling the opposite of the media narrative of higher rates for longer (pending Trump).
However, I believe bond bulls are preparing for economically stormy waters in equities. XLE appears to reflect this.
Considering Jan '27 70P's for wave A with a PT of 55-65$.
Not financial advice!
.
.
.
.
.
.
Proverbs 14:12 There is way that seems right to a man, but it's path that leads to destruction.
Psalm 119:105 Your word is a lamp to my feet and a light to my path.
Acts 4:11 This Jesus is the stone that was rejected by you, the builders, which has become the cornerstone.
Trade ideas

XLE Long DailyAsset Class: Indices
Income Type: Daily
Symbol: XLE
Trade Type: Long
Trends:
Short Term: Up
Long Term: UP
Set-Up Parameters:
Entry: 90.44
Stop: 89.22
TP 93.70 (2.8:1)
Trade idea:
Retest of 1H demand zone formed by a drop-base-rally near the breakout level, SL is a bit lower to cover the deeper RBR structure as the price might test tis liquidity. TP set at the nearest SZ with a 2.8:1 risk-reward ratio. The RSI is oversold.
!!Be aware of pending Economic Reports. If price is within 20 pips of proximal value at time of major impact report, then Confirmation entry.
Trade management:
**When price hits 1:1 or T1, consider moving stop to entry in case of pullback.
**Disclaimer**:
The trading strategies, ideas, and information shared are for educational and informational purposes only. They do not constitute financial advice or a recommendation to buy or sell any securities, currencies, or financial instruments. You should do your own research or consult with a licensed financial advisor before making any trading decisions. The author assumes no responsibility for any losses incurred from following these trading ideas.

XLE AT A INTERESTING PRICE WHEN LOOKING AT THE PASTDoes this mean anything?
Yes and no.
you need more to go on than just this to project the move, however, if you assume middle trend is where this price wants to go to stabilize, and you see we are at a major spot when it comes to horizontal support.
I really can't tell yet where it goes.
The upside percentage is far less than the potential downside percentage.
Upside is favored, but again, I can't really tell on this one to say anything other than, it's at a horizontal mark that has been historically important.

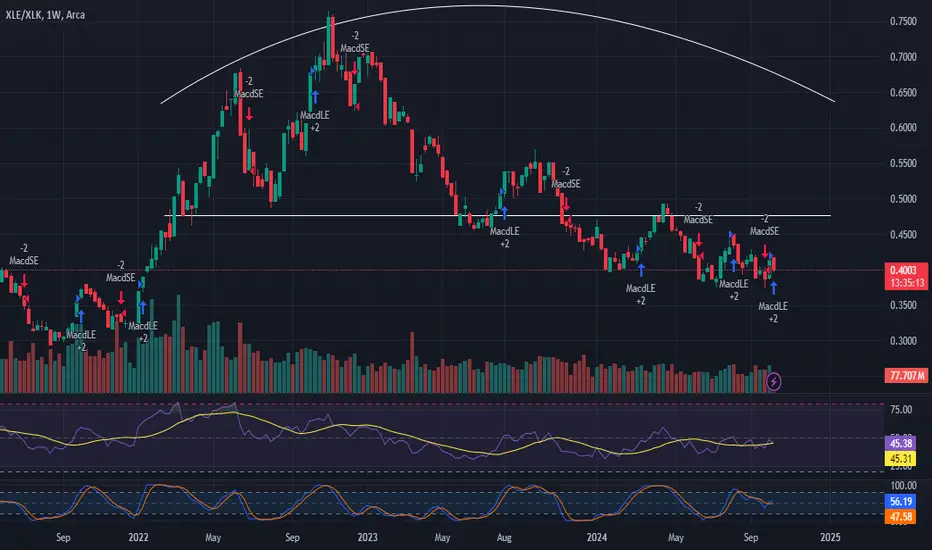
Energy vs Tech : Analyzing Sector Performance and Market TrendsIntroduction:
The comparison between the energy sector (XLE) and the technology sector (XLK) provides valuable insights into current market trends. As the largest sector in the S&P 500, XLK often serves as a barometer for broader market strength. Conversely, when XLE outperforms XLK, it may signal caution, as XLE's smaller size limits its impact on the overall index.
Analysis:
Sector Comparison: XLK's performance is crucial in indicating market health. When XLK outperforms, it generally suggests a robust market outlook. On the other hand, if XLE starts to outperform XLK, this may indicate potential weakness in broader market conditions.
Inflationary Pressures: This ratio between XLE and XLK also reflects inflationary trends. A strong performance from XLE relative to XLK may signal rising inflationary pressures, which investors should closely monitor.
Charting the Pattern: The energy sector has formed an inverted saucer pattern. A breakout from this pattern could signify a positive upward trend and possibly a return to inflation.
Trade Setup:
Entry Point: Monitor the XLE/XLK ratio for a potential breakout confirmation.
Stop Loss: Consider setting a stop loss below the recent support level identified on the chart.
Target Price: Set a target based on the measured move from the breakout point of the inverted saucer pattern.
Conclusion:
The comparative performance of XLE and XLK offers essential insights into market dynamics and inflationary pressures. Traders should keep an eye on the potential breakout from the inverted saucer pattern in XLE, as it may indicate a shift in market trends. What are your thoughts on this analysis? Share your insights in the comments!
Charts: (Include relevant charts showing the XLE/XLK ratio and the inverted saucer pattern)
#Energy #Technology #MarketTrends #Inflation #XLE #XLK
XLE: Rising Wave PatternTechnical analysis chart of the Energy Select Sector SPDR Fund (XLE), with Elliott wave analysis overlaid. Let's break down the analysis based on the chart and labels:
Overall Analysis:
The chart suggests a bullish trend for XLE, based on the Elliott wave structure. It indicates that we have completed wave ((4)) of wave V and are now in the unfolding wave ((5)). Within wave ((5)), we have started wave (1), and are currently in wave (3) of (1).
Wave Counts and Labels:
V Red: This represents the fifth and final wave of a larger Elliott wave pattern.
((4)) Black: The fourth corrective wave within V.
((5)) Black: The fifth and final impulsive wave within V.
(1) Blue: The first impulsive wave within ((5)).
1 Red: The first wave within (1).
2 Red: The second corrective wave within (1).
3 Red: The third impulsive wave within (1) (currently unfolding).
Price Projection and Invalidation as per Waves:
Bullish Projection: The chart suggests a potential target of 105 for wave ((5)).
Invalidation Level: A break below 83.02 would invalidate the current bullish analysis.
Educational Notes:
Elliott wave theory is a technical analysis tool that identifies patterns in price movements based on a series of five waves.
Impulsive waves (1, 3, 5) move in the direction of the overall trend, while corrective waves (2, 4) move in the opposite direction.
Wave labels use brackets to indicate different levels of analysis. For example, ((5)) is a larger wave than (1).
Colors are often used to visually differentiate between different waves and patterns.
I am not Sebi registered analyst.
My studies are for educational purpose only.
Please Consult your financial advisor before trading or investing.
I am not responsible for any kinds of your profits and your losses.
Most investors treat trading as a hobby because they have a full-time job doing something else.
However, If you treat trading like a business, it will pay you like a business.
If you treat like a hobby, hobbies don't pay, they cost you...!
Hope this post is helpful to community
Thanks
RK💕
Disclaimer and Risk Warning.
The analysis and discussion provided on in.tradingview.com is intended for educational purposes only and should not be relied upon for trading decisions. RK_Charts is not an investment adviser and the information provided here should not be taken as professional investment advice. Before buying or selling any investments, securities, or precious metals, it is recommended that you conduct your own due diligence. RK_Charts does not share in your profits and will not take responsibility for any losses you may incur. So Please Consult your financial advisor before trading or investing.

XLE LONGMulti-year wedge currently trading near the bottom it.
Easy long here IMO using 84 as a LIS.
Above 84 i can see a move up into 100 to the top of the wedge and towards the 2014 high.

SPDR Select Sector Fund - Energy Select SectorIf you like my Idea, Don't forget to Boost and comment on my Analysis.. The recommendations are purely for educational purpose only, consult you financial advisor before trading.
if you have any questions do not hesitate to contact me.

Is oil signalling a recession? Oil has really started to free fall.
The death cross on the daily chart has occurred. this is where the 50 MA intersects with the 200 MA in a downtrend.
This often implies more downside to the medium and long term but is often a great short term long signal.
Usually when you get this signal the market makers bounce the stock or commodity a bit before taking it lower.
We are hitting a massive multi year trend line going back to 2022 that should act as some support.
XLE looks ready for 1 more down leg before a swing tradable low is in.
Energy does have a tendency to fall precipitously so understanding oil can keep falling if investors fear the worst or a recession.

Opening (IRA): XLE October 18th 83 Monied Covered Call... for a 81.41 debit.
Comments: This is a little early for a run at grabbing the September dividend, but wanted to get in when the underlying is still hovering around recent lows ... .
Metrics:
Break Even/Buying Power Effect: 81.41
Max Profit: 1.59 (ex. divvies)
ROC at Max: 1.95% (ex. divvies)
50% Max: .80
ROC at 50% Max: .98%

XLE longI think XLE could be a great place to hedge recent chip volitility. the 88 price level has been a consistent support level and with unrest in the middle east we could see oil prices rise. In my personal portfolio NVDA and QCOM are two of my largest holdings and with the recent corrections I've continued to load up however I've been buying XLE just as much to give myself some sort of saftey in the short term.
obviously not a financial advisor do what you want

Lock in Longterm value @ breakout levelsI would have to go on a 3H keyboard mashing to be able to present all the data pointing to the upside.
Breakout of longterm consolidation;
Retest of previous support + longterm trendline;
Breakout from support retest with an bullish engulfing pattern;
W and M indicators are either crossing into neutral zone or indicating an expansive move uP
GL & HF

XLE retested the wedge!XLE retested the breakout and looks like it will go to test another resistance level.

Opened (IRA): XLE August 16th 85 Monied Covered Call... for an 83.77 debit.
Comments: Some of the only red on my ETF board ... . Here, selling the -75 delta call against a one lot to emulate the delta metrics of a 25 delta short put, but with the built-in defense of the short call. There is also a divvy to be had some time in June, with the last distribution being .73.
Metrics:
Buying Power Effect/Break Even: 83.77
Max Profit: 1.23 ($123)
ROC at Max: 1.47%
50% Max: .62 ($62)
ROC at 50% Max: .74%

Energy is going to get expensive as soon as the dollar drops!Bounced off long term 200 - crossover rolling over. The dollar will peak this summer and then go down to 97. I see energy exploding. August 100 calls are going for .25 which looks like a minimum 10x return. I see it going past 100, but don't have any estimations for how high it can go.
NFA ALWAYS!

Gearing up for all time high 2008 / 2014 / 2024 touching 90s each time. Currently monthly is holding my fast emas and right at support. Bullish for me until below slow emas / major pivot broken and retested. Flagging inside the ascending triangle. possible breakout to all time high and beyond.
This chat is for entertainment/educational purpose only. This is just an idea by an amateur.

The rotation from Tech to Oils has begunI've been suggesting this for a while but the accelerator has been pressed hard today. rotation out of tech (XLK) into oils (XLE). Has a lot of room to run.

Oil stocks about to rally rel to SPXThink we can potentially get a big up move for Oil stocks vs SPX in the coming months. I'm long a bunch of names.

Energy - which way are we headed?Energy does not look good right now. XLE+XOP has an inverse correlation to the gold/oil ratio. The two only move into neutral and positive correlations for brief periods before one of them changes direction. Additionally, when the gold/oil ratio crosses 30 we’ve seen energy prices begin to fall to more extreme lows.
The technicals above indicate gold is continuing higher . If we’re patient, this should lead to a very strong buying opportunity in energy.
Oil recently tested and rejected the 200SMA. This makes it more likely that we see another test of the green AVWAP tied to the covid low than a retest of the red one from the March 2022 high.

XLE reached the supportBullish move soon. It reached the support line. The previous historical resistance line.

May Market Outlook, Sectors Rotation, Relative Strength AnalysisSince February, the commodities asset class has surged ahead, overshadowing the S&P 500's faltering performance. This notable shift in market dynamics underscores the resilience and strength exhibited by commodities during this period.
Of particular interest are the XLE and XLU sectors, which have emerged as frontrunners since early March. This transition coincided with the decline in momentum of previously dominant sectors like XLK and SMH (refer to Fig. 2). Notably, XLE and XLU, characterized as growth defensive sectors, have thrived amidst market downturns. Investing in commodities and energy/utility sectors during these phases could have yielded significant profits, with select energy stocks boasting returns exceeding 25%, while the S&P 500 experienced an approximate 10% decline.
Looking ahead to May, it's anticipated that XLE and XLU will maintain their market leadership, albeit with a slight loss in momentum. However, investors are advised to remain vigilant as these sectors may soon witness a change in dynamics. It's crucial to employ stop limit orders to safeguard profits in such volatile conditions.
Following the current trajectory, XLY, XLRE, and XLF are poised to emerge as significant players in the market cycle (refer to Fig. 3&4). However, it's important to note that these sectors are susceptible to rapid momentum shifts, particularly when XLK and XLC regain momentum.
Looking towards June, indications suggest that XLK and XLC will likely regain prominence in the market. For buy-and-hold investors, this presents an opportune moment to consider purchasing assets during market dips.
Considering these market dynamics, my top investment picks are (TSLA), (GOOG), (AAPL), (ORCL), and Cisco Systems, Inc. (CSCO). These companies demonstrate strong growth potential, especially when timed strategically to align with sector rotation leadership shifts.

XLE could be inverted Cup-Handle - Possible trapTemporary breakout may turn into inverted cup so careful.
Wait for clear breakouts, will keep you posted.
Possible temporary small break at 95.60
Possible consolidation at 97

Spy / Oil / Natural Gas - Market Analysis CPI comes in hotter than consensus.
IWM slaughtered / QQQ under pressure / SPY closes negative.
Yields & Dollar ripping.
Oil ripping / Natural Gas selloff.
Are we entering a new reflation trend?

Rotae out of Tech (XLK) into Oils (XLE) for longer term I'm very confident that for long term real money investors (or long time horizon long/short) a switch/rotation now from tech stonks into oils will pay off massively over the next 1 to 2 years (100% relative basis)
