$XLE (Energy) seems to be making the same pattern as last time!Notes:
* I last spoke about this around the end of May as it was forming an ascending wedge
Now:
* It seems like the Energy sector ETF $XLE is making an ascending bearish wedge/channel once again.
* It's showing resistance around the $82.9/8 area again.
* I wouldn't be surprised if it has a fake breakout to the upside face resistance around the ~$88.7 area and eventually falling back inside the channel.
* I'm neutral for the time being but keeping a close eye on this for a bearish reversal.
It doesn't seem extended yet, that's what makes me think that it may actually break out to the up side before heading back down.
Trade ideas

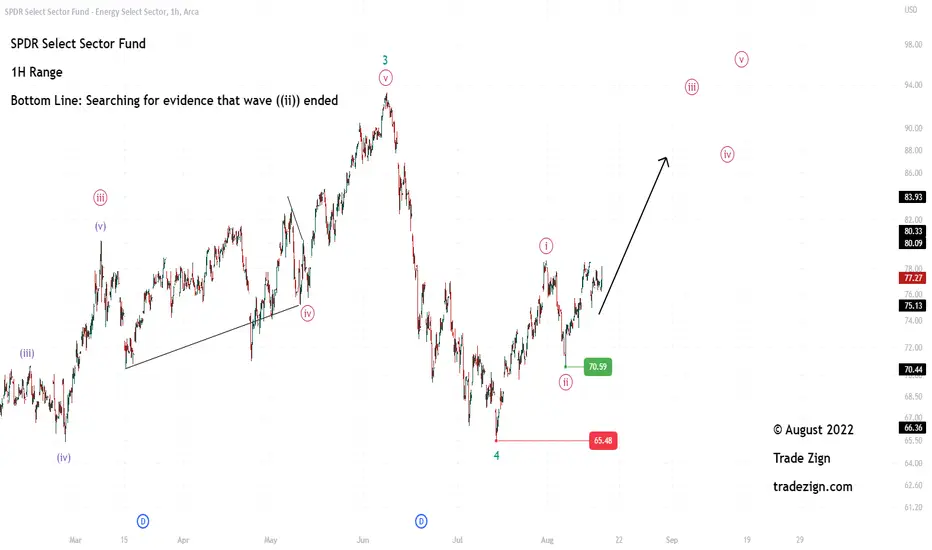
Energy XLE idea (29/08/2022)SPDR Select Sector Fund 1H Range In addition rise is expected in the XLE Energy Sector Index, targeting the third wave. Since prices are above the support Prise 70.59 in the long term, and the main support point at prices of 65.48. Currently, we expect the decline to correct since the prices are below 84.56

Energy XLE idea (26/08/2022)SPDR Select Sector Fund 1H Range Further rise is expected in the XLE Energy Sector Index, targeting the third wave. Since prices are above the support point of 70.59, we expect a rise in the near term and also in the long term, and the main support point is at prices of 65.48

Energy XLE idea (24/08/2022)SPDR Select Sector Fund 1H Range Further rise is expected in the XLE Energy Sector Index, targeting the third wave. Since prices are above the support point of 70.59, we expect a rise in the near term and also in the long term, and the main support point is at prices of 65.48

The Best Part of Waken Up...Is Inflation in your Cup!
This idea is following my previous post about how to Straddle an Ascending Triangle.
After that Straddle plays out a Cup and Handle could form.
The current admin forgot they need to turn off the spigot to stop inflation.
Want a strong economy? employment.
Employment burns fuel. Firms are trying to get employees back in offices.
Offices burn fuel with employees.
Can't have one without the... other.

How to Straddle an Ascending TriangleFor info on Ascending Triangle, check out my previous AMZN chart.
XLE consolidated 2 weeks prior to form an Ascending Triangle on the 4hr chart.
The 2 week period at the end of July XLE gained 20% .
This sets up a Great risk/reward around a sector with NG on the move.
Don’t count out the oil bull either.
While markets were bearish overall, XLE was on a 60% top before June.
Falling Energy gave way to lower inflation prints in June and July.
I can see XLE going to June high of 93 to form a cup and handle.
More on that in my next XLE idea.

XLE Energy Sector approaching ATH. Options play with CushionWith energy prices continuing their rise due to global shortages and war, XLE has climbed over 50% YTD. The potential upside to all-time highs, along with the intact trend since March of 2020 are enticing. It might be harder to take on a position after a 100% YoY increase and not feel like its FOMO. So, I look for options to enter with a bullish outlook but protect from downside volatility. Using a custom options strategy we can build in a 23% cushion ($65.38) and still capture all the upside to the ceiling ($89.13).
Using this strategy, it’s possible to make up to 9% ( 15% annualized ).
Start to lose only if XLE falls by more than 22% to below $63.58 as of 03/31/2023 .
Option Order
Buy 1 $82 call
Sell 1 $87 call
Sell 1 $64 put
Exp 3/31/23
Required to invest: $6,362.98

Energy XLE idea (22/08/2022)SPDR Select Sector Fund 1H Range Further rise is expected in the XLE Energy Sector Index, targeting the third wave. Since prices are above the support point of 70.59, we expect a rise in the near term and also in the long term, and the main support point is at prices of 65.48

Energy XLE idea (17/08/2022)XLE ENERGY ETFS Look for evidence of wave termination ((2).
Therefore, the current correction of the energy sector index may continue a little before it resumes and rises again, as support point 70.59 supports the rise in the near term will in the Long Term. Therefore, if trading remains above the support point of 65.48, we may see more rise.
XLE CHARTAnalysis of XLE if you wanna make cheese. Yall making me type this long description for what bro?

Bear Market - EvidenceThis descending triangle in the most "bullish" of sectors - energy - seems to prove that we are in a bear market. The descending triangle seems to trade with a bearish elliot wave pattern for descending triangles as evidenced here:
thepatternsite.com
Share your thoughts in the comments below.

XLE: Commodities short if retestXLE: Commodities short if retest
As usual everything's on the chart. TP is the minimum target.

XLE History Tends to Repeat With rates quickly increasing, inflation running rampant, the fed moving to QT and away from QE. The future certainly looks bleak. A recession will lead to lower gas prices and will eventually bring other prices lower, but first, a massive repricing needs to take place.

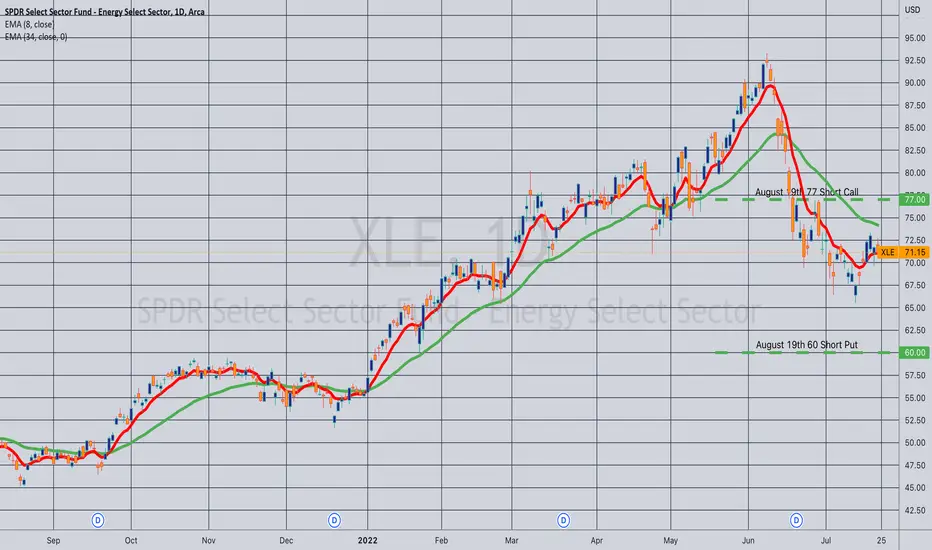
Closed (Margin): XLE August 19th 60/77 Short Strangle... for a 1.39 credit.
Comments: Collected a total of 2.49 in credit with this puppy with minimal fuss/muss. (See Posts Below). Closed today with 28 days to go for a 1.10 ($110) profit, which was basically 50% max of the original setup.
Energy stocks & commodities basing for coming reversal?Using XLE to represent the sector, it appears to be forming a "W" pattern, which could morph into an IH&S reversal pattern, but it still needs a little more time. Green zone is general support, and probable good intermediate term buying opportunity, maybe lasting into the end of the year. Pink boxes are gaps I would expect to be filled before reversal manifests.

Rolling: XLE August 19th 83 Short Call to 77... for a .43 credit.
Comments: Delta balancing my short strangle to delta/theta <1.0. Total credits collected of 2.49 with a resulting delta/theta of 5.84/6.79.

Opening: XLE August 19th 60/83 Short Strangle... for a 2.06 credit.
Comments: High IVR/IV at 76/49. Selling around the 16 delta on both sides. Delta/theta .4/5.73.

XLE: 2YR Daily Macro Data & Popular Indicators For ML AnalysisThis chart was created to accompany a blog post which explores leveraging machine learning (RNN: LSTM) using Tensorflow Keras and SHAP to determine which factors (indicators and correlations with Macro, such as oil futures prices, Fed Funds rate, consumer spending, etc) are found by the model to be the most predictive in nature.
Findings will be posted in the comments.

XLE at 100ema and key level on VPVR$77.50 has a lot of volume and can act as a resistance perfectly in line with the 100ema. Daily candle close above this and it should move into the $80 price range and could sit there for a bit. We would see one more push to the top before oil calms and this forms a lower high around $90 or a double top.
Entered on the drop at $70
TP target 1 now at $77
TP target 2 at $81
TP target 3 at $90

#XLE - time to buy energy names again?200ema has provided solid support for energy names since November 2020. Will history repeat or is this time different?

XLE Playing For A Wave 5 Upside ExtensionIn this update we review the recent price action in XLE and identify the next high probability trade location and price objectives to target

$XLE - end of year target $55Energy prices will fall for all the wrong reasons. US economy will slow; we will see recession soon. As output slows and quantitative tightening increases; prices will fall. Should fall to support levels around $55 by end of the year.
Trigger: 11 day smma crossing the 50 day smma.
$XLE components include $XOM, $CVX, $COP, $MPC

$XLE starts to look cheap around $70.50$XLE broke below weekly support, which happens to be 0.768 Fibonacci support level as well.
I'd want to get long at $70.50 as it'll be the 0.618 level of Fibonacci support and also other important technical factors coincide in that zone. Including volume profile value area high at the same level.
