Massive Upside Ahead: Top 5 Stocks With Big 2026 Potential📌 Top 5 Stocks for 2026 (Monthly Chart Setups)
I just published a new breakdown focused on multi-month / multi-year moves — not short-term noise. Using the monthly timeframe, I walk through structure + momentum to find the next potential 2x–10x runners.
Names covered:
• NYSE:ZETA – cup & handle
Adobe Inc.
No trades
Key facts today
Next report date
—
Report period
—
EPS estimate
—
Revenue estimate
—
13.454 CHF
5.73 B CHF
19.10 B CHF
417.04 M
About Adobe Inc.
Sector
Industry
CEO
Shantanu Narayen
Website
Headquarters
San Jose
Founded
1982
Identifiers
3
ISINUS00724F1012
Adobe, Inc. is a global technology company, which engages in the provision of digital marketing and media solutions. It operates through the following segments: Digital Media, Digital Experience, and Publishing and Advertising. The Digital Media segment offers products and services that enable individuals, teams, businesses, and enterprises to create, publish, and promote content anywhere and accelerate productivity by transforming view, share, engage with and collaborate on documents and creative content. The Digital Experience segment focuses on integrated platform and set of products, services, and solutions that enable businesses to create, manage, execute, measure, monetize, and optimize customer experiences that span from analytics to commerce. The Publishing and Advertising segment includes legacy products and services that address diverse market opportunities, including eLearning solutions, technical document publishing, web conferencing, document and forms platform, web app development, high-end printing, and Adobe Advertising offerings. The company was founded by Charles M. Geschke and John E. Warnock in December 1982 and is headquartered in San Jose, CA.
Related stocks

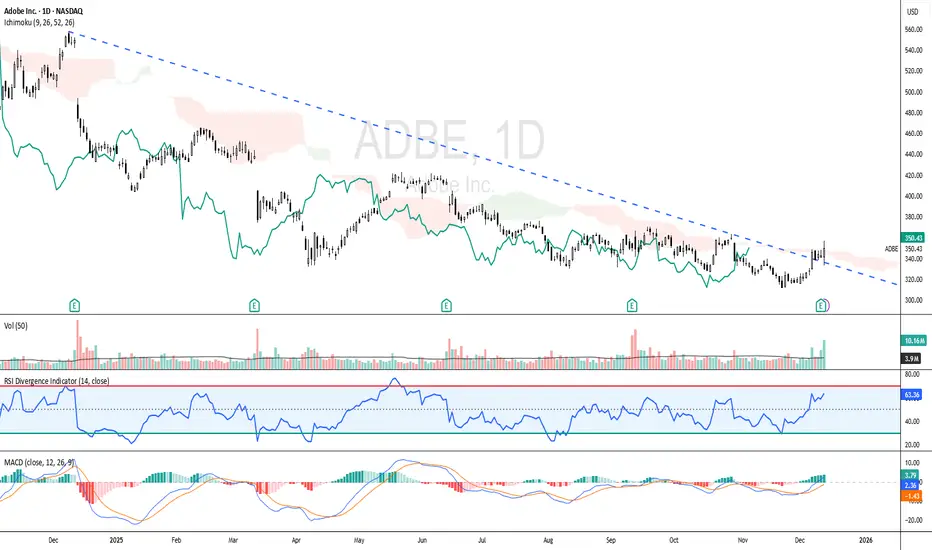
ADOBE - Short-term Bullish SetupADBE - CURRENT PRICE : 350.43
🔼 Short-term bullish outlook as price breaks above the downtrend line, signalling a potential trend reversal. 💪 RSI remains bullish above the mid-line, while MACD shows a positive crossover 📈, strengthening the upside momentum. ☁️ The Ichimoku Chikou Span (green line)
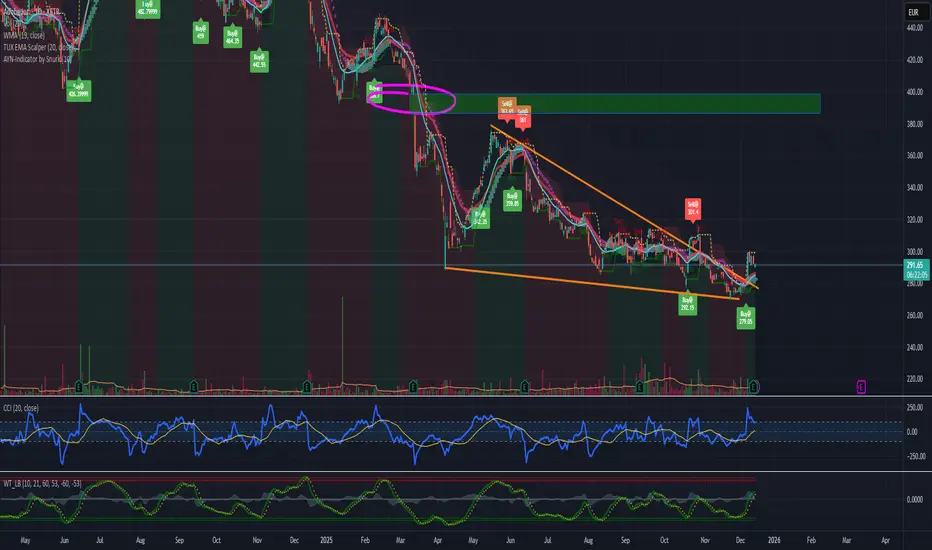
ADBE: Spring/Shakeout confirmedADBE:
.
Spring/Shakeout confirmed.
Accumuation range swing and bottom is being confirmed. Waiting for a comeback way like this.
.
US STOCKS- WALL STREET DREAM- LET'S THE MARKET SPEAK!


Breaking: Adobe Forecasts Annual Revenue Above EstimateAdobe (NASDAQ; ADBE), forecast fiscal 2026 revenue and profit above Wall Street expectations on Wednesday, signaling strong demand for the Photoshop maker's design tools and increasing monetization for its artificial intelligence offerings.
Since the launch of ChatGPT in 2022, Adobe has made heavy

(ADBE): Navigating the AI Creative FrontierAdobe Inc. (NASDAQ: ADBE), the global leader in creative software, has delivered a resounding vote of confidence in its strategic direction by issuing robust financial guidance that surpasses Wall Street expectations. On December 10, the company projected fiscal year 2026 revenue to land between $25
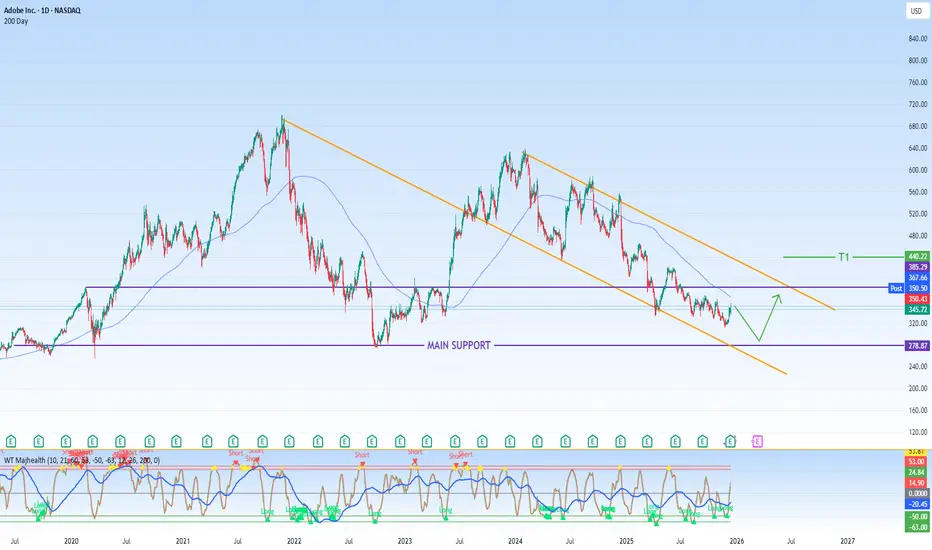
$ADBE. Should hit $400+ in the next weeks/months. GM, still holding $ADBE. Should hit $400+ in the next weeks/months.
Why?:
- Stretched downtrend
- At major support
- In the next years they will buy back $25 billion in shares.

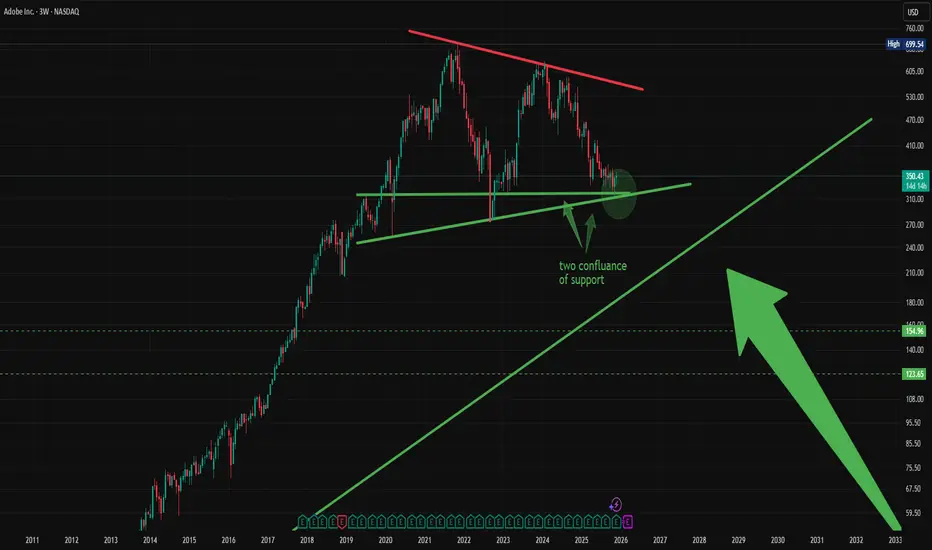
adobe wakening up adbe has been patiently consolidating in a wedge for 5 years .. we are now getting conformation of a breakout..as you can see we have not one but two confluence of support that gives us a very high probability of a reversal and now we can enter with confidence.
ADBE | Breakout Play After Earnings | Eyes on $360 and $390Adobe NASDAQ:ADBE has finally cleared the $350 volume wall, a level that’s acted as firm resistance for months. The breakout was backed by strong earnings, signaling momentum could continue as bulls step in. This move opens the door for a potential rally continuation, especially if the broader tec

ADB reaching its bottom?Hi,
Just a note for myself.
Clear bottom structure, long term disembarking.
Profitable company, industry leader.
Estimated revenue and profits -> growing.
EPS growing.
Additionally have clear buy signals and falling triangle breakout.
My expectation is to see 450 in 2026.
BUY!
AG
See all ideas
Summarizing what the indicators are suggesting.
Neutral
SellBuy
Strong sellStrong buy
Strong sellSellNeutralBuyStrong buy
Neutral
SellBuy
Strong sellStrong buy
Strong sellSellNeutralBuyStrong buy
Neutral
SellBuy
Strong sellStrong buy
Strong sellSellNeutralBuyStrong buy
An aggregate view of professional's ratings.
Neutral
SellBuy
Strong sellStrong buy
Strong sellSellNeutralBuyStrong buy
Neutral
SellBuy
Strong sellStrong buy
Strong sellSellNeutralBuyStrong buy
Neutral
SellBuy
Strong sellStrong buy
Strong sellSellNeutralBuyStrong buy
Displays a symbol's price movements over previous years to identify recurring trends.
ADBE5981558
Adobe Inc. 5.3% 17-JAN-2035Yield to maturity
4.58%
Maturity date
Jan 17, 2035
ADBE5784629
Adobe Inc. 4.95% 04-APR-2034Yield to maturity
4.49%
Maturity date
Apr 4, 2034
US724PAD1
Adobe Inc. 2.3% 01-FEB-2030Yield to maturity
4.02%
Maturity date
Feb 1, 2030
ADBE5981252
Adobe Inc. 4.95% 17-JAN-2030Yield to maturity
4.01%
Maturity date
Jan 17, 2030
ADBE5784440
Adobe Inc. 4.8% 04-APR-2029Yield to maturity
3.96%
Maturity date
Apr 4, 2029
US724PAC3
Adobe Inc. 2.15% 01-FEB-2027Yield to maturity
3.88%
Maturity date
Feb 1, 2027
ADBE5784439
Adobe Inc. 4.85% 04-APR-2027Yield to maturity
3.78%
Maturity date
Apr 4, 2027
ADBE5981557
Adobe Inc. 4.75% 17-JAN-2028Yield to maturity
3.71%
Maturity date
Jan 17, 2028
See all ADB bonds
Curated watchlists where ADB is featured.


Frequently Asked Questions
The current price of ADB is 283.260 CHF — it has decreased by −0.82% in the past 24 hours. Watch Adobe Inc. stock price performance more closely on the chart.
Depending on the exchange, the stock ticker may vary. For instance, on BX exchange Adobe Inc. stocks are traded under the ticker ADB.
ADB stock has risen by 0.13% compared to the previous week, the month change is a 4.74% rise, over the last year Adobe Inc. has showed a −30.84% decrease.
We've gathered analysts' opinions on Adobe Inc. future price: according to them, ADB price has a max estimate of 481.23 CHF and a min estimate of 214.76 CHF. Watch ADB chart and read a more detailed Adobe Inc. stock forecast: see what analysts think of Adobe Inc. and suggest that you do with its stocks.
ADB stock is 1.84% volatile and has beta coefficient of 1.18. Track Adobe Inc. stock price on the chart and check out the list of the most volatile stocks — is Adobe Inc. there?
Today Adobe Inc. has the market capitalization of 118.17 B, it has increased by 0.77% over the last week.
Yes, you can track Adobe Inc. financials in yearly and quarterly reports right on TradingView.
Adobe Inc. is going to release the next earnings report on Mar 12, 2026. Keep track of upcoming events with our Earnings Calendar.
ADB earnings for the last quarter are 4.42 CHF per share, whereas the estimation was 4.34 CHF resulting in a 1.88% surprise. The estimated earnings for the next quarter are 4.66 CHF per share. See more details about Adobe Inc. earnings.
Adobe Inc. revenue for the last quarter amounts to 4.98 B CHF, despite the estimated figure of 4.91 B CHF. In the next quarter, revenue is expected to reach 4.99 B CHF.
ADB net income for the last quarter is 1.49 B CHF, while the quarter before that showed 1.42 B CHF of net income which accounts for 5.13% change. Track more Adobe Inc. financial stats to get the full picture.
No, ADB doesn't pay any dividends to its shareholders. But don't worry, we've prepared a list of high-dividend stocks for you.
Like other stocks, ADB shares are traded on stock exchanges, e.g. Nasdaq, Nyse, Euronext, and the easiest way to buy them is through an online stock broker. To do this, you need to open an account and follow a broker's procedures, then start trading. You can trade Adobe Inc. stock right from TradingView charts — choose your broker and connect to your account.
Investing in stocks requires a comprehensive research: you should carefully study all the available data, e.g. company's financials, related news, and its technical analysis. So Adobe Inc. technincal analysis shows the strong buy rating today, and its 1 week rating is neutral. Since market conditions are prone to changes, it's worth looking a bit further into the future — according to the 1 month rating Adobe Inc. stock shows the sell signal. See more of Adobe Inc. technicals for a more comprehensive analysis.
If you're still not sure, try looking for inspiration in our curated watchlists.
If you're still not sure, try looking for inspiration in our curated watchlists.