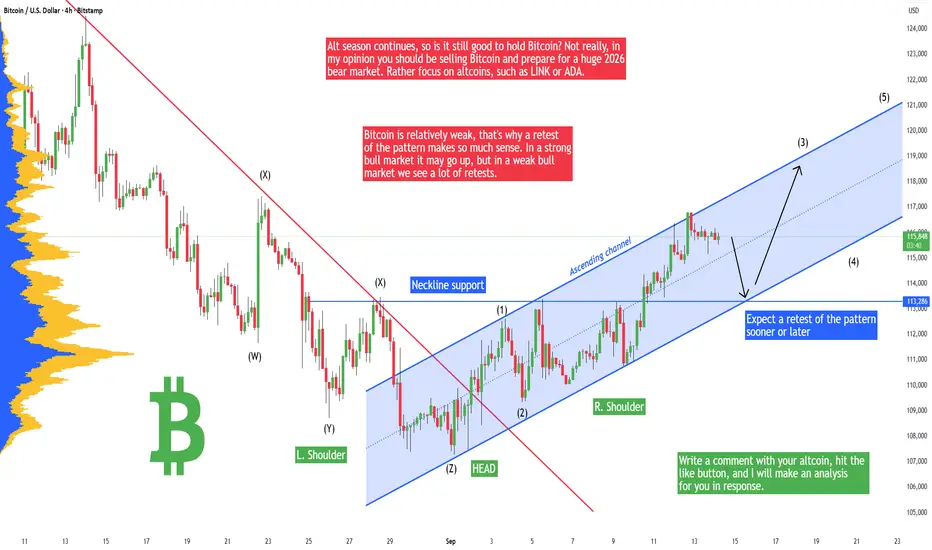
Bitcoin - Must go down to retest this pattern + new ATH soon!Bitcoin recently broke out of the head and shoulders pattern and made a pretty strong uptrend. That's a sign of strength that Bitcoin will be ready to continue in the uptrend and go to a new all time high, but not yet! I still think that Bitcoin should retest the previous Head and Shoulders pattern
Key stats
Related pairs
BTC: From Triangle to Flag → 118K?Let's take a look at the recent market context. Bitcoin climbed aggressively, creating a powerful impulsive leg upward.
That rally formed the pole of our bullish flag, a clear continuation pattern.
After that, price consolidated, shaping a tight, downward-sloping flag, while overall momentum stayed

Bitcoin - Will Bitcoin break out of range?!Bitcoin is above EMA50 and EMA200 on the four-hour timeframe and is in its ascending channel. If the downward trend continues towards the specified demand range, we can buy Bitcoin with appropriate risk-reward.
Bitcoin’s rise to around 121,000 and its arrival at the specified supply range will provi

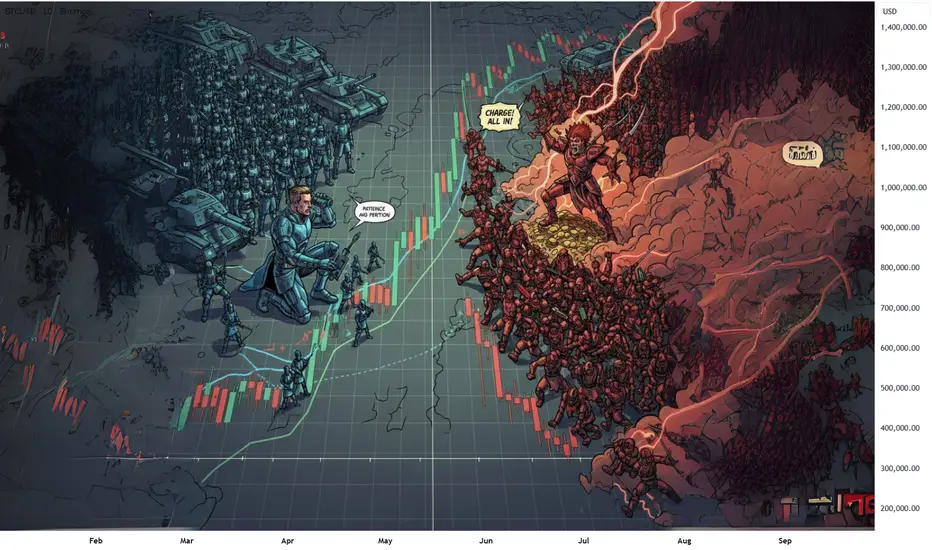
123 Quick Learn Trading Tips - Tip #8 WHERE & WHEN or WHAT size?WHERE and WHEN or WHAT size? Build an Empire?
In the war of trading, many soldiers focus only on scouting the perfect battlefield. They spend all their energy finding the perfect place ( 'where' ) and the perfect moment ( 'when' ) to launch an attack on the market. They believe a flawless entry po
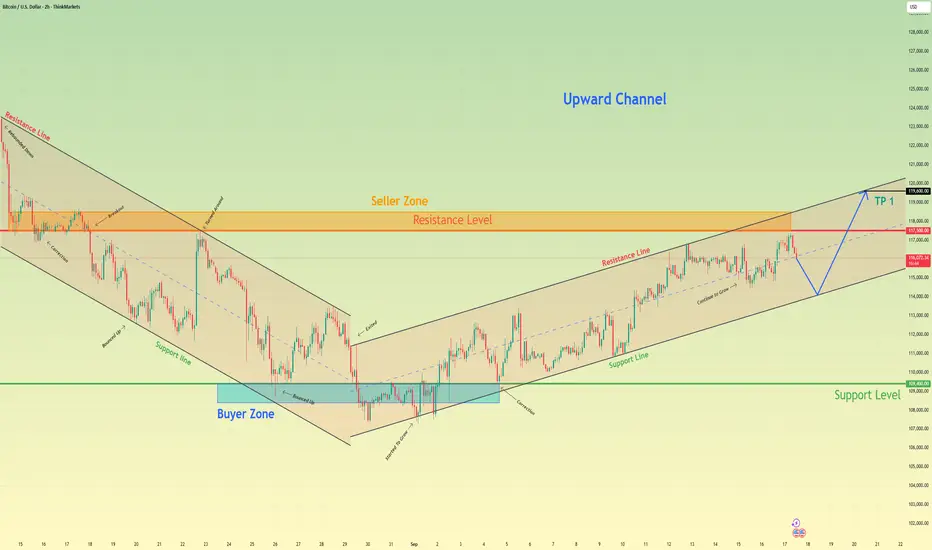
Bitcoin will break resistance level and continue to move upHello traders, I want share with you my opinion about Bitcoin. The market dynamic for Bitcoin has undergone a significant shift, with the prior bearish trend being invalidated by a strong breakout from a downward channel. This reversal has established a new bullish market structure, with the price a
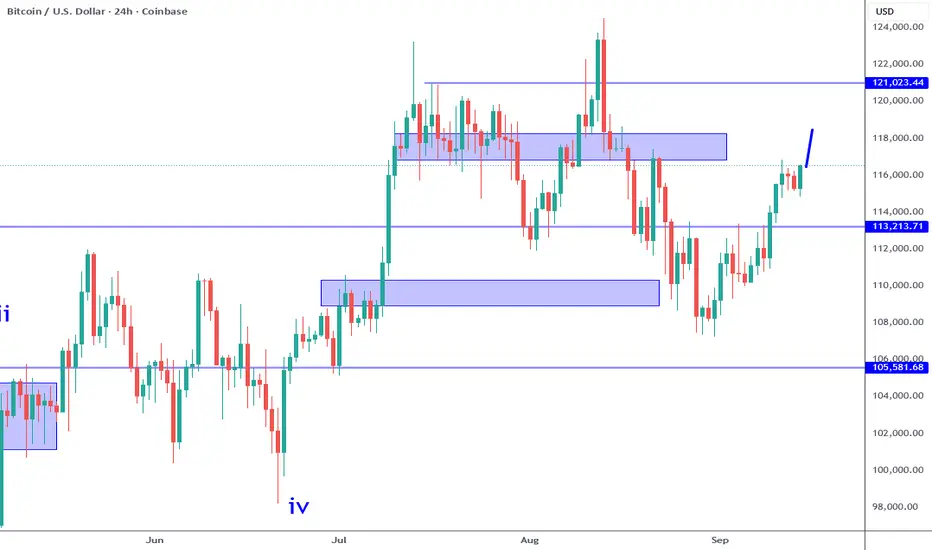
Bitcoin: Bullish Engulfing Setup Into FOMC Week.Bitcoin has formed a minor impulse structure and is currently showing a potential wave 4. The fact that it has initially rejected the 116K area resistance, but has barely retraced is a sign of strength. No wave 1, wave 4 overlap lap means a bullish wave 5 is more likely. A 5th wave can see price tes
BITCOIN 1W Stoch RSI completed a Bullish Cross. Expect new ATH.Bitcoin (BTCUSD) just completed a Bullish Cross on its 1W STOCH RSI and that's the first time it does so since April 07 2025. That was as we know, the previous market bottom of the Trade War correction.
In fact, every 1W STOCH RSI Bullish Cross has been a buy signal within this Bull Cycle's Channel

Bitcoin: Easy Monetary Policy Means Buy Pullbacks. Bitcoin has rejected the 118K resistance for now, but with the FOMC behind us and an EASY monetary policy agenda ahead of us, I would be looking for buying opportunities. The current rejection of resistance is confirming the consolidation which may persist for some weeks or months but based on the c

BITCOIN This is where the fat lady sings..Well this is o secret. We've pointed that out many times before but it couldn't be more relevant than now as Bitcoin (BTCUSD) is approaching the end of its 4-year Cycle.
So where does the 'fat lady sing'? According to the 1M RSI, at the top of its historic 15-year Channel Down. Which by the end of

BTC/USD (4H chart Pattern).BTC/USD (4H chart) with Ichimoku cloud, breakout from a descending trendline, and projected targets marked.
Based on the chart I have shared:
Immediate support zone: around 113,500 – 114,000 (aligned with cloud support).
First target point: around 120,000 USD.
Second extended target: around 124,

See all ideas
Displays a symbol's price movements over previous years to identify recurring trends.
Curated watchlists where BITCOIN is featured.

Gen 1 crypto: from little acorns grow
15 No. of Symbols

Proof of Work: Embracing the crunch
27 No. of Symbols
See all sparks
Discover funds exposed to Bitcoin and find another way to access the coin.
Frequently Asked Questions
Bitcoin ($1) (XBT) reached its highest price on Aug 14, 2025 — it amounted to 124,467.0 USD. Find more insights on the XBT price chart.
See the list of crypto gainers and choose what best fits your strategy.
See the list of crypto gainers and choose what best fits your strategy.
Bitcoin ($1) (XBT) reached the lowest price of 590.8 USD on Sep 21, 2016. View more Bitcoin ($1) dynamics on the price chart.
See the list of crypto losers to find unexpected opportunities.
See the list of crypto losers to find unexpected opportunities.
The safest choice when buying XBT is to go to a well-known crypto exchange. Some of the popular names are Binance, Coinbase, Kraken. But you'll have to find a reliable broker and create an account first. You can trade XBT right from TradingView charts — just choose a broker and connect to your account.
You can discuss Bitcoin ($1) (XBT) with other users in our public chats, Minds or in the comments to Ideas.