AUDCAD | 1H Quasimodo Structure – Liquidity Grab Into SupplyPrice is approaching a key Quasimodo (QML) region that aligns perfectly with an unmitigated 1H supply zone between 0.9220 – 0.9240.
After the Break of Structure (BOS) to the downside, the market created liquidity (LQ) below equal lows, then began a corrective leg targeting the supply origin where the previous bearish impulse started.
Market Narrative:
This setup reflects classic Smart Money Concepts (SMC) — price often revisits QML zones to collect liquidity before resuming its primary trend. The liquidity sweep + QML + supply confluence builds a compelling case for a bearish reaction.
Execution Plan:
Wait for reaction and confirmation from lower timeframes (M15–M5) inside the 0.9220–0.9240 zone:
Look for a Shift in Market Structure (SMS) or Break of Structure (BOS).
Enter on a refined pullback with stops above the QML high.
Targets could extend back toward 0.9100–0.9120, the previous demand region.
Trade ideas

AUDCAD double top pattern -box pattern consolidation short AUDCAD day candle stern formed the double top pattern and now price looks to be consolidating in a box and less chances to go up and price may further go down . Let us see how it plays out
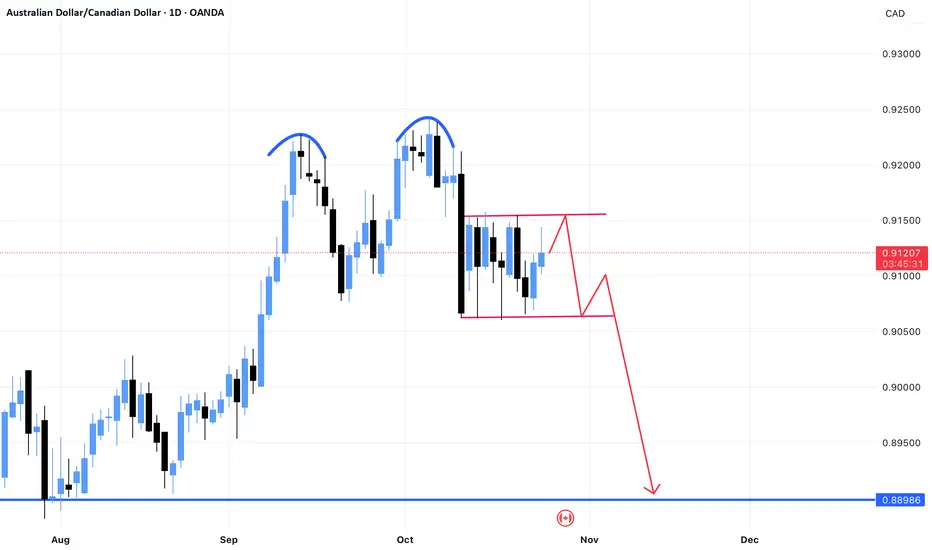
AUD/CAD BEARISH BIAS RIGHT NOW| SHORT
AUD/CAD SIGNAL
Trade Direction: short
Entry Level: 0.919
Target Level: 0.903
Stop Loss: 0.931
RISK PROFILE
Risk level: medium
Suggested risk: 1%
Timeframe: 1D
Disclosure: I am part of Trade Nation's Influencer program and receive a monthly fee for using their TradingView charts in my analysis.
✅LIKE AND COMMENT MY IDEAS✅

AUD/CAD: Overextended Rally Eyes Resistance Near 0.9227AUD/CAD is approaching the 0.9227 resistance zone following a clean breakout from its previous range. However, price action now appears overextended, with signs of exhaustion forming near last month’s high.
A rejection from this area could prompt a pullback toward 0.9166, aligning with the lower trendline support. With momentum fading, buyers may begin taking profits ahead of this key resistance level.

AUDCAD SELL OR BUY SIGNAL???The technical picture for AUDCAD is clear. The price is currently being rejected from the upper boundary of its consolidation range, with the key resistance level at 0.9144. Our trading thesis is as follows:
Bearish Scenario: A confirmed breakdown and close below the 0.9144 support-turned-resistance level would validate the ongoing selling pressure. This would be our signal to initiate a short position, anticipating a move down towards the lower end of the range.
Bullish Scenario: Conversely, a decisive breakout and sustained move above the 0.9177 resistance level would indicate a breach of the consolidation structure. This would invalidate the bearish outlook and serve as our signal to enter a long position, targeting the next significant resistance level above the range.
DISCLAIMER: ((trade based on your own decision))
<<press like👍 if you enjoy💚

AUDCAD: Morning Gap Trade 🇦🇺🇨🇦
AUDCAD may fill a gap up opening soon.
A formation of a bearish imbalance candle on an hourly time frame
provides a strong confirmation.
Goal - 0.9112
❤️Please, support my work with like, thank you!❤️
I am part of Trade Nation's Influencer program and receive a monthly fee for using their TradingView charts in my analysis.

AUDCAD: Bears Will Push Lower
The recent price action on the AUDCAD pair was keeping me on the fence, however, my bias is slowly but surely changing into the bearish one and I think we will see the price go down.
Disclosure: I am part of Trade Nation's Influencer program and receive a monthly fee for using their TradingView charts in my analysis.
❤️ Please, support our work with like & comment! ❤️

AUD/CADAUD/CAD was in a downtrend, but price created a bullish divergence indicating possible reversal. After that, a Head and Shoulders pattern formed, confirming the shift in momentum. Entry was taken on the neckline breakout, with a 1:2 risk-to-reward setup.

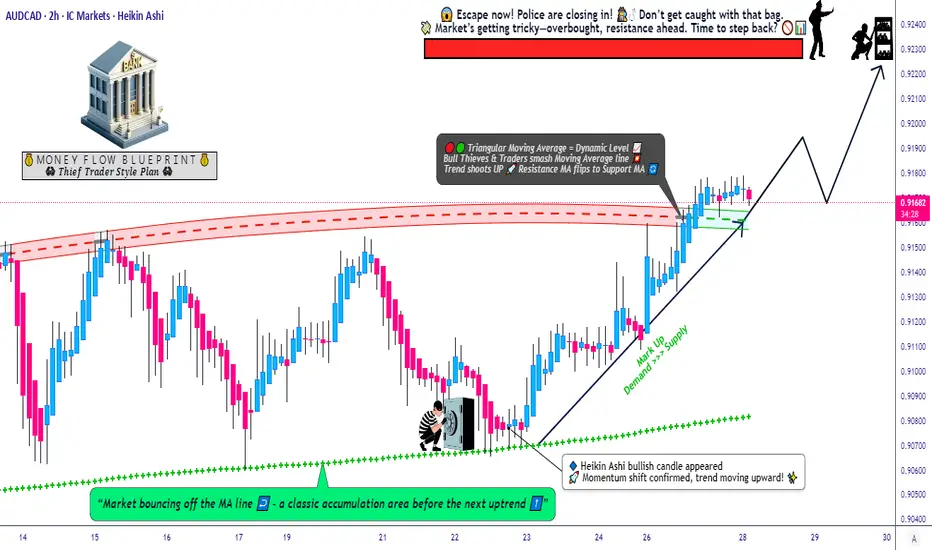
Trading The AUD/CAD Breakout - A Systematic Approach.🎯 Aussie vs Cad Dollar – Market Capital Flow Blueprint (AUD/CAD Bull Setup) 🦘🍁
Hello Market Money Makers & Thief OG’s!
We’re watching the AUD/CAD pair with a bullish bias — the Aussie is showing strength vs the Loonie, and the capital-flow looks supportive. Here’s the plan:
📈 Setup:
A breakout of the triangular moving average structure has just been confirmed — signalling a potential swing/day trade environment.
Risk-reward is favourable, and layered entries give us flexibility in execution.
🛒 Entry Strategy (Layering Style):
Using multiple buy limit orders (classic Thief layering method) at the following levels:
0.91300
0.91400
0.91500
0.91600
(You can add more layers if you like — scale as you see fit.)
🚫 Stop Loss (Thief’s SL):
0.91100 — if price drops below here the trade is invalidated.
Note: Dear Ladies & Gentlemen (Thief OG’s), I am not recommending you blindly follow my SL — it's your choice, you can make money then take money at your own risk.
🎯 Target (TP):
0.92300 — this level acts as a police barricade (strong resistance) + overbought trap zone.
Note: Dear Ladies & Gentlemen (Thief OG’s), I am not recommending you blindly follow my TP — it's your choice, you can make money then take money at your own risk.
🔍 Watch-Pairs / Correlations:
OANDA:USDCAD – watch relative strength of USD vs CAD.
OANDA:AUDJPY – for Aussie strength confirmation.
OANDA:GBPCAD – another CAD-weakness proxy.
Monitoring these helps us see if CAD remains weak or if AUD continues to shine.
📌 Key Points / Why This Setup Works:
Capital flow: Aussie assets drawing interest, contributing to AUD strength.
Breakout confirmation: Moving average triangle resolved bullishly.
Layered entries: lets us average into the trade if price comes down to support.
Target zone backed by resistance and structural trap — good exit zone.
Stop-loss placement protects capital if market flips direction.
✨ “If you find value in my analysis, a 👍 and 🚀 boost is much appreciated — it helps me share more setups with the community!”
Disclaimer: This is Thief style trading strategy just for fun.
#AUDCAD #Forex #FX #DayTrade #SwingTrade #CapitalFlow #LayeringStrategy #ThiefTrader
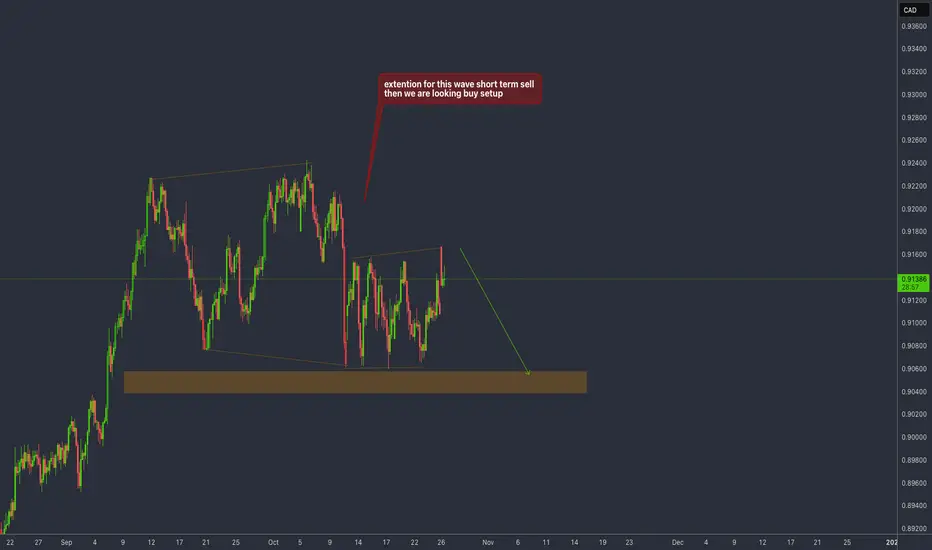
I can see it can push one time for sell atlas to break lowsAudcad long term buy but now I can see it can push for sell before it goes buy
AUDCAD the Reserve Bank of Australia (RBA) cash rate is currently steady at 3.60%. The decision reflects the RBA's cautious approach amid inflation still being slightly above the 2–3% target range, ongoing resilience in the labor market, and uncertainty in global economic conditions
The RBA Governor is Michele Bullock.
AU10Y=4.161%
the Bank of Canada (BOC) policy interest rate is 2.50%. This followed a 25 basis points cut in the September 17, 2025 meeting, part of a series of rate reductions to support a weakening Canadian economy. The BOC's next policy decision is scheduled for October 29
The Governor of the Bank of Canada is Tiff Macklem, who continues to lead the central bank's monetary policy efforts through these adjustments.
This dovish stance reflects the BOC’s focus on economic support amid external pressures like U.S. tariffs and slowing growth.
CA10Y=3.0875
Interest Rate Differential
As of October 2025, the Reserve Bank of Australia (RBA) cash rate is approximately 3.60%, while the Bank of Canada (BOC) policy rate is lower at around 2.50% but expected to cut further.
This suggests a positive interest rate differential in favor of Australia, potentially supporting a stronger AUD relative to the CAD.
Higher interest rates in Australia attract yield-seeking capital, increasing demand for AUD versus CAD.
Bond Yield Differential
The 10-year Australian government bond yield is currently near 4.161%, compared with about 3.087% for Canadian 10-year bonds.
Higher Australian yields relative to Canadian yields offer additional attraction for investors toward AUD-denominated assets.
This yield gap supports the AUD against the CAD through carry trade and investment inflows.
#AUDCAD

AUDCAD 4HR PERSPECTIVE the Reserve Bank of Australia (RBA) cash rate is currently steady at 3.60%. The decision reflects the RBA's cautious approach amid inflation still being slightly above the 2–3% target range, ongoing resilience in the labor market, and uncertainty in global economic conditions
The RBA Governor is Michele Bullock.
AU10Y=4.161%
the Bank of Canada (BOC) policy interest rate is 2.50%. This followed a 25 basis points cut in the September 17, 2025 meeting, part of a series of rate reductions to support a weakening Canadian economy. The BOC's next policy decision is scheduled for October 29
The Governor of the Bank of Canada is Tiff Macklem, who continues to lead the central bank's monetary policy efforts through these adjustments.
This dovish stance reflects the BOC’s focus on economic support amid external pressures like U.S. tariffs and slowing growth.
CA10Y=3.0875
Interest Rate Differential
As of October 2025, the Reserve Bank of Australia (RBA) cash rate is approximately 3.60%, while the Bank of Canada (BOC) policy rate is lower at around 2.50% but expected to cut further.
This suggests a positive interest rate differential in favor of Australia, potentially supporting a stronger AUD relative to the CAD.
Higher interest rates in Australia attract yield-seeking capital, increasing demand for AUD versus CAD.
Bond Yield Differential
The 10-year Australian government bond yield is currently near 4.161%, compared with about 3.087% for Canadian 10-year bonds.
Higher Australian yields relative to Canadian yields offer additional attraction for investors toward AUD-denominated assets.
This yield gap supports the AUD against the CAD through carry trade and investment inflows.
#AUDCAD

BEARISH SENTIMENT I'm expecting price to come back to this level marked out then sell from that level, its an aggressive entry for me … I don't need any other further confirmation on this kind of setup

AUDCAD: Long Trade with Entry/SL/TP
AUDCAD
- Classic bullish formation
- Our team expects pullback
SUGGESTED TRADE:
Swing Trade
Long AUDCAD
Entry - 0.9144
Sl - 0.9133
Tp - 0.9167
Our Risk - 1%
Start protection of your profits from lower levels
Disclosure: I am part of Trade Nation's Influencer program and receive a monthly fee for using their TradingView charts in my analysis.
❤️ Please, support our work with like & comment! ❤️

AUDCAD-BUY-ConfimrationAUDCAD / Bull Mode in Daily Chart.
It is good time to buy.
SL : 0.91600
TP : 0.92500 (You may close earlier)

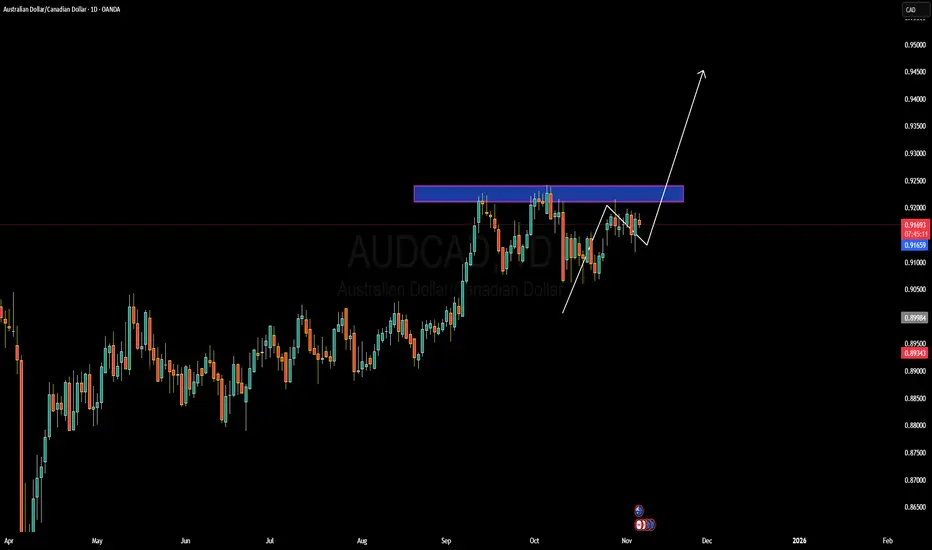
AUDCAD Forming Bullish ContinuationAUDCAD is showing strong signs of a potential bullish continuation as price consolidates just below a key resistance zone around the 0.9200 region. The market has maintained higher lows, reflecting steady buyer interest and a gradual shift in sentiment toward the upside. If the pair manages to break above this resistance with strong momentum, it could confirm a breakout structure, opening the door for a rally toward the 0.9350–0.9400 levels in the coming sessions. The technical picture supports the idea of accumulation, with the market forming a bullish flag-type pattern before continuation.
From a fundamental perspective, the Australian dollar remains relatively supported as the Reserve Bank of Australia maintains a firm tone on inflation and continues to assess the impact of its prior tightening measures. Meanwhile, the Canadian dollar has been weighed down by weaker oil prices and softening domestic demand, which have limited the Bank of Canada’s ability to maintain a hawkish stance. The diverging central bank outlooks and commodity performance are creating a favorable backdrop for further AUD strength against the CAD.
As long as AUDCAD holds above the 0.9100 support region, buyers are likely to maintain control, with the next key level of interest being the 0.9250 zone. A confirmed breakout above resistance would strengthen bullish conviction and align with the broader upward trend that has been building since mid-year. This setup remains technically and fundamentally aligned for potential continuation, making it a pair to keep on the radar for bullish opportunities in the near term.
AUDCAD – Market OverviewPrice has broken out of the previous descending structure and is now respecting the new ascending trendline. The recent pullback held around the 0.382–0.50 Fibonacci zone, showing demand. Price is now reacting around the 0.618 equilibrium level, which is the key decision point.
Holding above the trendline and 0.618 favors continuation.
A break back below 0.50 signals deeper correction.
Key Levels:
• Support: 0.382–0.50
• Decision Zone: 0.618
• Upper Target: 0.786
Bias: Neutral until reaction confirms direction.
Tags: #AUDCAD #Forex #PriceAction #Fibonacci #4H

AUDCAD November 2025 fundamental analysisAustralian Dollar (AUD): Inflation Surprise Supports Hold
Reserve Bank of Australia Stance
The Australian Dollar received a powerful boost from the September quarter inflation data released on October 29, which delivered a significant upside surprise. Headline CPI accelerated to 1.3% quarter-on-quarter and 3.2% year-on-year, well above the RBA's 2-3% target midpoint. More importantly, the RBA's preferred trimmed mean measure climbed 1.0% quarterly (beating 0.8% expectations and the RBA's August forecast of 0.6%), pushing the annual rate to 3.0%—the first uptick since December 2022.
RBA Governor Michele Bullock had explicitly stated earlier in the week that a 0.9% quarterly rise in trimmed mean inflation would be viewed as a "material miss". At 1.0%, the threshold was decisively crossed. Bullock also described the labor market as "a little tight" despite unemployment rising to 4.5%, and emphasized the RBA's unwillingness to "leap at a single number".
Rate Cut Expectations Pushed Back
The inflation surprise has dramatically reshaped rate cut expectations. The November 4 meeting confirmed the decision to hold rates steady for the moment, and the first 25 basis point cut has been delayed from February 2026 to May 2026. This represents a stark shift from earlier expectations for near-term easing. The RBA cash rate remains at 3.60%, providing a substantial yield advantage over other major central banks.
November Outlook: Very Bullish
The Australian Dollar is the clear standout for November strength. AUD/USD surged to a three-week high of 0.6607 following the inflation data, and technical analysis suggests further upside potential toward 0.6706. The currency benefits from multiple tailwinds: delayed rate cuts relative to other central banks, particularly the Fed; buoyant risk sentiment following the preliminary US-China trade framework; and strong commodity prices, including copper near three-month highs. Against the weaker commodity currencies like CAD and NZD, the Australian Dollar is exceptionally well-positioned.
Canadian Dollar (CAD): Economic Headwinds and Continued Easing
Bank of Canada Policy
The Bank of Canada delivered another 25 basis point rate cut at its October 29 meeting, bringing the policy rate to 2.25%. This continues an aggressive easing cycle that has seen rates reduced by 225 basis points since June 2024, from a peak of 4.50% to the current 2.75%. Markets are pricing in current easing for the October meeting despite recent data showing 60,000 employment gains and headline inflation rising to 2.4%.
Economic Challenges
The BoC's dovish stance is driven by persistent concerns about the Canadian economic outlook. The third-quarter Business Outlook Survey showed that uncertainty around trade policy continues to weigh heavily on investment and hiring plans. The "future sales" indicator dropped back into negative territory for the first time in 2025, and 63% of firms expect either unchanged or reduced workforce levels—levels historically associated with unemployment rates of 7.3% or higher.
Canada's terms of trade have deteriorated significantly, with crude oil prices falling to multi-month lows. WTI crude is trading around $59-60 per barrel, down from earlier highs, removing a key pillar of support for the loonie.
November Outlook: Bearish
The Canadian Dollar faces a challenging November. USD/CAD has moved higher to the 1.40 handle, and while some analysts expect a return to 1.38 by year-end driven primarily by USD weakness, the path may be slow with potential spikes to 1.41. The loonie is expected to underperform against most G10 currencies, given the BoC's continued easing path and Canada's vulnerability to weak energy prices.
Verdict
Given these grave fundamental divergences between AUD and CAD the current assessment for AUD/CAD is a clear BUY .

Aoudad looking for buy if it correct more upsidei'am looking for buy Audcad mid. term until it break 0.92433

[AUDCAD] Trade ideaAdding small size on this trade already in profit, I am playing the same scenario and for me this level is the one to reverse long otherwise my play is compromised.
Great Trade !

Market outlook 11.04.2025 Clean set up for London session, took a trade on gold securing 3rr Could be more if i hold it longer. PATIENT is the key and let the set up come to us.

AUDCAD — 1H Chart AUDCAD — 1H Chart 📈
Price has formed a double bottom at a key level, but I missed that entry.
Once a new Break of Structure (BOS) is confirmed, I’ll look to buy and target the next zone.
🎯 Buy Target → 0.91433
OANDA:AUDCAD

AUDCAD Is Going Down! Short!
Here is our detailed technical review for AUDCAD.
Time Frame: 2h
Current Trend: Bearish
Sentiment: Overbought (based on 7-period RSI)
Forecast: Bearish
The market is testing a major horizontal structure 0.920.
Taking into consideration the structure & trend analysis, I believe that the market will reach 0.916 level soon.
P.S
We determine oversold/overbought condition with RSI indicator.
When it drops below 30 - the market is considered to be oversold.
When it bounces above 70 - the market is considered to be overbought.
Like and subscribe and comment my ideas if you enjoy them!
