A Short Setup On the NZDCAD and NZDUSDThe outlook for the NZD against the CAD is becoming increasingly bearish, with a combination of diverging fundamentals and a technical break on the chart suggest further downside is likely.
The bearish sentiment is largely driven by different economic and monetary policy expectations for the two countries.
Diverging Central Banks:
New Zealand central bank RBNZ has made dovish remarks last monetary policy announcement, it cut its interest rate in an effort to jumpstart a faltering economy. Unlike the Bank of Canada, which is adopting a more wait-and-see approach. With Canadian inflation near target and its economy more robust, the interest rate spread should favor the CAD.
Economic Performance Gap:
New Zealand's economy is displaying signs of stress, with domestic demand slowing and unemployment increasing. Although Canada's economy is also slowing, it seems to be on track for a softer landing, aided by a more stable labor market and a housing sector that has surprised to the upside.
The story is straightforward: a central bank actively easing policy to help a soft economy (New Zealand) compared with a central bank on hold with a more stable economy (Canada). That divergence provides a bearish outlook for the NZD/CAD.
The Chart Validates the Bearish Scenario
Established Downtrend: The pair has been making consecutively lower highs. This is a classic technical formation that is a clear signal that sellers are in charge and that buying momentum is disappearing with every attempt at a rally.
Critical Support Break: The most significant recent development was the definitive break of a key support level in the 0.8115 area. This level had held on multiple occasions since June, but the breakdown of this level likely paves the way for a more decline.
Support Turns Resistance: Since the breakdown, price has pulled back slightly higher to test this former broken support area. if price cannot retake this level, it confirms the breakdown.
Downside Targets: Now that the bearish structure is in place, the potential initial target is in the 0.8020-0.8030 area. This area corresponds with Fibonacci retracement and extension levels.
Bottom line
When technical and fundamental analysis converge, it forms a high-conviction trade. The underlying narrative of diverging monetary policies offers the "why" of NZD weakness , while the technical breakdown on the chart provides potential future price action.
With the RBNZ's easing cycle and the clear bearish price structure on the chart, the path of least resistance for NZD/CAD appears to be lower. Not being able to break the new resistance around ~0.8115 would most likely see the pair decline towards the first target area of 0.8020-0.8030 in the next couple of weeks.
Remember, nothing is guaranteed in this market... trade with care.
Trade ideas

Bullish bounce off?NZD/CAD is falling towards the support level that aligns with the 61.8% Fibonacci retracement and could bounce from this level to our take profit.
Entry: 0.80937
Why we like it:
There is a pullback support that lines up with the 61.8% Fibonacci retracement.
Stop loss: 0.80659
Why we like it:
There is a swing low support.
Take profit: 0.81631
Why we like it:
There is a pullback resistance that lines up with the 78.6% Fibonacci retracement.
Enjoying your TradingView experience? Review us!
Please be advised that the information presented on TradingView is provided to Vantage (‘Vantage Global Limited’, ‘we’) by a third-party provider (‘Everest Fortune Group’). Please be reminded that you are solely responsible for the trading decisions on your account. There is a very high degree of risk involved in trading. Any information and/or content is intended entirely for research, educational and informational purposes only and does not constitute investment or consultation advice or investment strategy. The information is not tailored to the investment needs of any specific person and therefore does not involve a consideration of any of the investment objectives, financial situation or needs of any viewer that may receive it. Kindly also note that past performance is not a reliable indicator of future results. Actual results may differ materially from those anticipated in forward-looking or past performance statements. We assume no liability as to the accuracy or completeness of any of the information and/or content provided herein and the Company cannot be held responsible for any omission, mistake nor for any loss or damage including without limitation to any loss of profit which may arise from reliance on any information supplied by Everest Fortune Group.

NZD-CAD Local Pullback! Sell!
Hello,Traders!
NZD-CAD made a sharp
Bullish move up and hit
A horizontal resistance
Of 0.8130 and the pair
Failed to break the level
So we are locally bearish
Biased and we will be expecting
A local bearish correction
On Monday!
Sell!
Comment and subscribe to help us grow!
Check out other forecasts below too!
Disclosure: I am part of Trade Nation's Influencer program and receive a monthly fee for using their TradingView charts in my analysis.

NZDCAD APPROACHES SUPPORT LEVELHere’s the Daily timeframe Chart of NZDCAD. Technically, we can see how price is declining to a support level. We have a bullish sentiment on NZDCAD therefore we are waiting for price to shift from intraday bearish to intraday bullish to help us make a buy entry.


Im looking for buy setups.Those who are passionate about trading know that this is a tough business. What you have to understand is that the predictions people are making regarding the price movement directions are based on probabilities. There is no such thing as 100 percent direction in the market, and that is because the market can turn against you or your direction at any time it wants. The reason doesn't even matter; it could be the news of some geopolitical changes, oil cut production or war, or many other factors that could impact the financial market. If you have one or more good reasons that the price will follow a certain direction, all you have to do is take a small risk entry in your direction with a good risk-to-reward ratio and just wait and see how the market will perform. A trader could have 1 good reason or a few reasons why his bias is up or down. The reasons could be based on particular studies, past behavior, fundamentals, technical analysis, or certain observations. The important part for you to understand is that the market is in a continuously changing process; this means that yesterday's prediction, today, could be irrelevant. The market does not have to follow your analysis. You have to follow the market, observe its changes, and react accordingly to them! I hope some of you will find this helpful. Good luck!

NZDCAD ~ White Bear. Tech.It's the second time that the trend make retracement on Fibos 50.
But it look still price going down.
We got a few levels to check bellow. (Marked grey areas).
Have a profitable day!

NZDCAD Long Swing Trade - A Setup OANDA:NZDCAD Long Swing Trade - A Setup
Entry: 0.80246 - 0.80800
TP: 0.81915
This is good trade.
Don't overload your risk like Greedy gambler!!!
Be Disciplined Trader, what what you can afford.
Use proper risk management.
Disclaimer: Trading is risky, only idea, not advice.

short idea for nzdcadaccording to my analysis nzdcad is forming a head & shoulder pattern, on the shorter time frame this pair making LHs and LLs, fundamentally CAD data is expecting to be bullish, seasonality of this pair is also bearish.
Bullish bounce off?NZD/CAD is reacting off the pivot which is an overlap support and could bounce to the 1st resistance.
Pivot: 0.8169
1st Support: 0.8124
1st Resistance: 0.8236
Risk Warning:
Trading Forex and CFDs carries a high level of risk to your capital and you should only trade with money you can afford to lose. Trading Forex and CFDs may not be suitable for all investors, so please ensure that you fully understand the risks involved and seek independent advice if necessary.
Disclaimer:
The above opinions given constitute general market commentary, and do not constitute the opinion or advice of IC Markets or any form of personal or investment advice.
Any opinions, news, research, analyses, prices, other information, or links to third-party sites contained on this website are provided on an "as-is" basis, are intended only to be informative, is not an advice nor a recommendation, nor research, or a record of our trading prices, or an offer of, or solicitation for a transaction in any financial instrument and thus should not be treated as such. The information provided does not involve any specific investment objectives, financial situation and needs of any specific person who may receive it. Please be aware, that past performance is not a reliable indicator of future performance and/or results. Past Performance or Forward-looking scenarios based upon the reasonable beliefs of the third-party provider are not a guarantee of future performance. Actual results may differ materially from those anticipated in forward-looking or past performance statements. IC Markets makes no representation or warranty and assumes no liability as to the accuracy or completeness of the information provided, nor any loss arising from any investment based on a recommendation, forecast or any information supplied by any third-party.

NZD/CAD: 3-Step Rocket Booster Strategy Signals Bearish NZD/CAD: Rocket Booster Strategy Signals Bearish Momentum 🚀⬇️
The Rocket Booster Strategy is pointing to potential downside pressure on NZD/CAD, with three key indicators lining up for a bearish move.
1️⃣ Stochastic (14,3,3 Smoothed) – Overbought to Downturn
The Stochastic Oscillator (14,3,3, smoothed) recently turned down from overbought territory. This signals exhaustion in the
bulls and an increased likelihood of sellers taking control. When stochastic rolls over from high levels, it often marks the beginning of a corrective wave.
2️⃣ Balance of Power (BOP) – Bears Gaining Control
The Balance of Power indicator has flipped into negative territory, suggesting sellers are dominating order flow. This
aligns with the stochastic shift and adds confirmation that downside momentum could accelerate.
3️⃣ EMA Alignment – Bearish Bias Confirmed
Price action has broken below the 50 EMA and is now testing levels under the 200 EMA. This alignment indicates that short-
term and long-term sentiment are bearish. With the recent gap down, the EMAs are acting as resistance instead of support, further strengthening the bearish case.
📉 What This Means
With stochastic rolling over, BOP in negative territory, and EMA alignment confirming the trend, NZD/CAD looks set for a deeper
pullback. Traders using the Rocket Booster Strategy should watch for continuation signals below the recent gap level, while keeping an eye on support near prior swing lows.
⚠️ Disclaimer
This analysis is for educational purposes only and should not be considered financial advice. Always test strategies in a simulation
account first and apply proper risk management before trading live capital.
👉 Action Step: Track NZD/CAD around the broken EMA levels. If sellers continue to defend these areas, momentum could accelerate toward the next support zone.
Rocket Boost This Content To Learn More

Potential bearish drop?NZD/CAD has rejected off the resistance level which is an overlap resistance that aligns with the 38.2% Fibonacci retracement and could drop from this level to our take profit.
Entry: 0.81942
Why we like it:
There is an overlap resistance level that aligns with the 38.2% Fibonacci retracement.
Stop loss: 0.82363
Why we like it:
There is a swing high resistance.
Take profit: 0.81277
Why we like it:
There is a multi-swing low support that lines up with the 78.6% Fibonacci projection.
Enjoying your TradingView experience? Review us!
Please be advised that the information presented on TradingView is provided to Vantage (‘Vantage Global Limited’, ‘we’) by a third-party provider (‘Everest Fortune Group’). Please be reminded that you are solely responsible for the trading decisions on your account. There is a very high degree of risk involved in trading. Any information and/or content is intended entirely for research, educational and informational purposes only and does not constitute investment or consultation advice or investment strategy. The information is not tailored to the investment needs of any specific person and therefore does not involve a consideration of any of the investment objectives, financial situation or needs of any viewer that may receive it. Kindly also note that past performance is not a reliable indicator of future results. Actual results may differ materially from those anticipated in forward-looking or past performance statements. We assume no liability as to the accuracy or completeness of any of the information and/or content provided herein and the Company cannot be held responsible for any omission, mistake nor for any loss or damage including without limitation to any loss of profit which may arise from reliance on any information supplied by Everest Fortune Group.

NZDCAD ShortsNZDCAD is reaching the daily price of interest and should short for the rest of the trading session today. Wait for price to spike then short. A bearish flag pattern can be seen here.

NZDCAD: Very Bullish Price Action 🇳🇿🇨🇦
NZDCAD is testing a key intraday/daily horizontal support.
It holds strongly for now, managing to break a resistance line
of a falling wedge pattern on an hourly time frame.
I believe that the price may rise and reach at least 0.819
❤️Please, support my work with like, thank you!❤️
I am part of Trade Nation's Influencer program and receive a monthly fee for using their TradingView charts in my analysis.

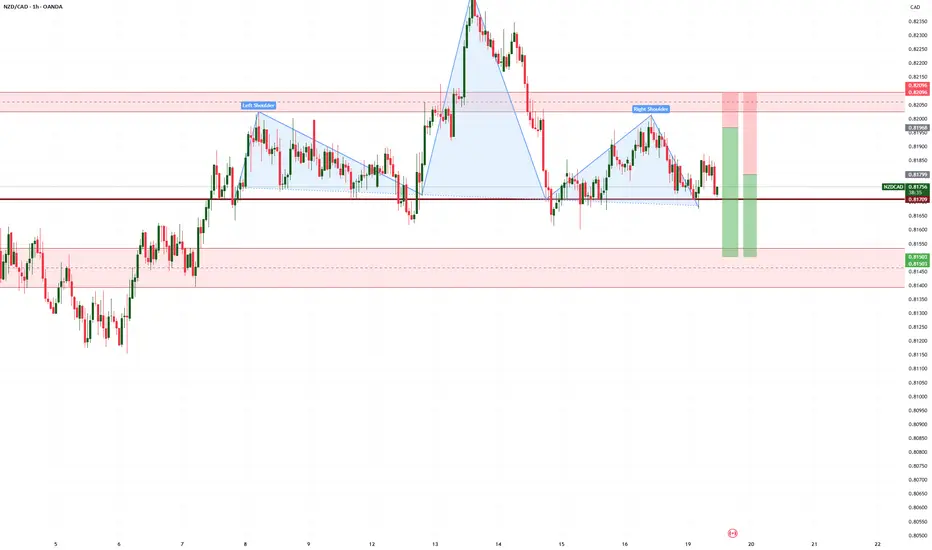
NZDCAD--SHORT-- it seems "Head and shoulder" pattern is about to form.
--looking at the left shoulder, forming of "right shoulder" may take a couple of days.

NZDCAD Long Trade CorrectionOANDA:NZDCAD Long trade, with my back testing, NZDCAD need to correct it self to given profit target.
This is good trade.
Don't overload your risk like Greedy gambler!!!
Be Disciplined Trader, what what you can afford.
Use proper risk management
Looks like good trade.
Lets monitor.
Use proper risk management.

Bullish bounce off?NZD/CAD is falling towards the pivot, which acts as an overlap support that aligns with the 61.8% Fibonacci retracement and could bounce to the 1st resistance.
Pivot: 0.81698
1st Support: 0.81245
1st Resistance: 0.82364
Risk Warning:
Trading Forex and CFDs carries a high level of risk to your capital and you should only trade with money you can afford to lose. Trading Forex and CFDs may not be suitable for all investors, so please ensure that you fully understand the risks involved and seek independent advice if necessary.
Disclaimer:
The above opinions given constitute general market commentary, and do not constitute the opinion or advice of IC Markets or any form of personal or investment advice.
Any opinions, news, research, analyses, prices, other information, or links to third-party sites contained on this website are provided on an "as-is" basis, are intended only to be informative, is not an advice nor a recommendation, nor research, or a record of our trading prices, or an offer of, or solicitation for a transaction in any financial instrument and thus should not be treated as such. The information provided does not involve any specific investment objectives, financial situation and needs of any specific person who may receive it. Please be aware, that past performance is not a reliable indicator of future performance and/or results. Past Performance or Forward-looking scenarios based upon the reasonable beliefs of the third-party provider are not a guarantee of future performance. Actual results may differ materially from those anticipated in forward-looking or past performance statements. IC Markets makes no representation or warranty and assumes no liability as to the accuracy or completeness of the information provided, nor any loss arising from any investment based on a recommendation, forecast or any information supplied by any third-party.

Bearish reversal off multi swing high resistance?NZD/CAD is rising towards the resistance level, which is a multi-swing high resistance that aligns with the 100% Fibonacci projection, and could drop from this level to our take-profit target.
Entry: 0.82560
Why we like it:
There is a multi swing high resistance that aligns with the 100% Fibonacci projection.
Stop loss: 0.83266
Why we like it:
There is a swing high resistance that 145% Fibonacci extension.
Take prorit: 0.81920
Why we like it:
There is an overlap support level that aligns with the 38.2% Fibonacci retracement.
Enjoying your TradingView experience? Review us!
Please be advised that the information presented on TradingView is provided to Vantage (‘Vantage Global Limited’, ‘we’) by a third-party provider (‘Everest Fortune Group’). Please be reminded that you are solely responsible for the trading decisions on your account. There is a very high degree of risk involved in trading. Any information and/or content is intended entirely for research, educational and informational purposes only and does not constitute investment or consultation advice or investment strategy. The information is not tailored to the investment needs of any specific person and therefore does not involve a consideration of any of the investment objectives, financial situation or needs of any viewer that may receive it. Kindly also note that past performance is not a reliable indicator of future results. Actual results may differ materially from those anticipated in forward-looking or past performance statements. We assume no liability as to the accuracy or completeness of any of the information and/or content provided herein and the Company cannot be held responsible for any omission, mistake nor for any loss or damage including without limitation to any loss of profit which may arise from reliance on any information supplied by Everest Fortune Group.

NZDCADprice is in a range area and now we reach to a supply zone and RSI is overbought so we consider risk and enter...

NZDCAD Sell Opportunity1. Trade Setup
Entry Price: ~0.8235
Stop Loss (SL): ~0.82645 (about 29 pips above entry)
Take Profit (TP): ~0.81138 (about 121 pips below entry)
Risk-to-Reward Ratio: ~1:4 — this is favorable if the setup plays out.
2. Price Action Context
Price had a strong bullish push before entry, likely hitting a previous resistance area (near 0.8240–0.8260).
The short entry appears to be taken at or just after price tapped into that resistance, possibly anticipating a reversal.
Candles leading up to entry show upward momentum, so the trade depends heavily on that resistance holding.
3. Support & Resistance Zones
Immediate Resistance: 0.8240–0.8260 (where SL is placed, marking the breakout invalidation zone).
First Support: 0.8210 (minor intraday level).
Major Target Support: 0.8113 (TP zone, possibly a demand area from earlier price action).
4. Risk Factors
Strong bullish momentum into entry could mean price might test or slightly break resistance before dropping.
If NZD or CAD news is upcoming, volatility could shake the trade.
5. Trade Idea Logic
Likely based on supply zone rejection or the overbought pullback idea.
Good R:R, but the trade relies on a sharp reversal after a strong push — this type of setup works best if there are bearish confirmation candles or divergence.

NZDCAD Short opportunityOn the four hour time frame, we broke structure and price is suggesting a bullish run, we are over extended on the oscillators, and suspect we will come down to area where price pushed from on the break. Not as clean as the previous set ups but I still think we have a good probability we will return to this area even if we push up. I set the SL just above the next high that we would need to break to continue bullish run.
If we are wrong about bullish run, then price will go our direction all the same. I would take additional entries if we close above current entry and layer maybe 2-5 positions per candle close with SL's at previous highs. Use your best judgement.

Bullish bounce?NZD/CAD is falling towards the pivot, which acts as a pullback support that lines up with the 50% Fibonacci retracement and could bounce to the 1st resistance.
Pivot: 0.81602
1st Support: 0.81199
1st Resistance: 0.82135
Risk Warning:
Trading Forex and CFDs carries a high level of risk to your capital and you should only trade with money you can afford to lose. Trading Forex and CFDs may not be suitable for all investors, so please ensure that you fully understand the risks involved and seek independent advice if necessary.
Disclaimer:
The above opinions given constitute general market commentary, and do not constitute the opinion or advice of IC Markets or any form of personal or investment advice.
Any opinions, news, research, analyses, prices, other information, or links to third-party sites contained on this website are provided on an "as-is" basis, are intended only to be informative, is not an advice nor a recommendation, nor research, or a record of our trading prices, or an offer of, or solicitation for a transaction in any financial instrument and thus should not be treated as such. The information provided does not involve any specific investment objectives, financial situation and needs of any specific person who may receive it. Please be aware, that past performance is not a reliable indicator of future performance and/or results. Past Performance or Forward-looking scenarios based upon the reasonable beliefs of the third-party provider are not a guarantee of future performance. Actual results may differ materially from those anticipated in forward-looking or past performance statements. IC Markets makes no representation or warranty and assumes no liability as to the accuracy or completeness of the information provided, nor any loss arising from any investment based on a recommendation, forecast or any information supplied by any third-party.

Bearish Gameplan Activated – NZD/CAD Heist Operation💣 NZD/CAD “Kiwi vs Loonie” Forex Vault Robbery Heist Plan 🔫💰
Bearish Plan | Multiple Limit Orders | Scalping/Swing Style
🧠💼 Welcome to another high-stakes Thief Trader Heist – this time we're targeting the NZD/CAD vault. The Loonie's got weakness in its wings, and the Kiwi’s already flapping into the trap zone. Let's rob this pair clean!
📉 ENTRY – THE BREAK-IN
💼 "We ain't knocking... we entering ANY PRICE LEVEL!"
Layer your sell limit orders like traps in a museum – closest to recent highs on the 15m/30m/1H zones. Precision is profit. 🧨
🛑 STOP LOSS – EXIT ROUTE IF CAUGHT
🔐 0.81800 — placed at the swing high (4H chart level) for clean cutouts. Adjust based on your lot size & how many bags you carry 🧳📊
🎯 TARGET – VAULT LOCATION
🏁 0.80400 — that’s where we grab the loot and disappear like ghosts!
🎯 Day traders aim here.
🎯 Scalpers escape quicker with trailing SLs – grab and vanish!
⚙️ STRATEGY – THE THIEF’S TOOLKIT
🔹 Scalping? Only short!
🔹 Swinging? Ride the bearish tide 🌊
🔹 Use price traps, liquidity zones, fake breakouts – we exploit retail psychology 😈
🔹 Heist based on momentum, reversal patterns, exhaustion candles 🕵️♂️
📉 Sentiment shows retail stuck long 🪤
📈 Institutions flipping short 👀
📉 Trend = weak Kiwi, stronger Loonie boost from commodities
🚨 NEWS ALERT – STAY IN SHADOWS
Avoid high-impact news like CPI, BoC or RBNZ shocks. Thieves don’t rob during spotlight hours 🔦📉
🔥 Hit BOOST 💥 if you’re riding with the THIEF GANG 🔥
👑 Let’s make this plan viral, hit likes, share it, and rob the market clean 💰💸
Stay stealthy. Stay rich. Stay Thief. 🐱👤🕵️♂️💼
