Weekly WatchlistWe have a very clean downward channel on this pair, and the price has now reached the top of the channel.
According to a reactive strategy, it’s easy to open a short position in the direction of the trend down to the bottom of the channel.
If you want to be more certain, wait for the oscillators to also confirm the downward move.
On the other hand, if the price manages to break above the channel, since we’re trading with the trend, as I’ve marked on the chart with arrows, the price must give us at least two confirmations of bullish momentum before entering, so we don’t get trapped by a fake breakout.
Trade ideas

NZDCAD: Long Trading Opportunity
NZDCAD
- Classic bullish pattern
- Our team expects retracement
SUGGESTED TRADE:
Swing Trade
Buy NZDCAD
Entry - 0.8008
Stop - 0.8000
Take - 0.8021
Our Risk - 1%
Start protection of your profits from lower levels
Disclosure: I am part of Trade Nation's Influencer program and receive a monthly fee for using their TradingView charts in my analysis.
❤️ Please, support our work with like & comment! ❤️

Break of a Strong trend line on Higher timeframethe trend line has been a resistance for more than touches and it has eventually broke the trend line ,hence its now our support . Now we are seeing a tight flag to confirm a strong buying pressure

Update on NZDCADIn our weekly watchlist and recent nightly analyses, our bias on this pair has been bearish, waiting for a valid trigger to enter a short position.
No trigger was issued, and then we saw a strong bullish candle break through resistance.
For now, this candle doesn’t change anything for us — it moves against the overall trend, and one impulsive candle is not enough to switch our bias from sellers to buyers.
We will only turn bullish if the market forms a clear bullish structure, not just a single breakout.
Also, if price falls back inside the channel, that alone becomes a new short trigger for us.

NZDCAD NZDCAD going short with 1:2 RR as overall it is in a downtrend with a strong pullback and confirmation to go short.

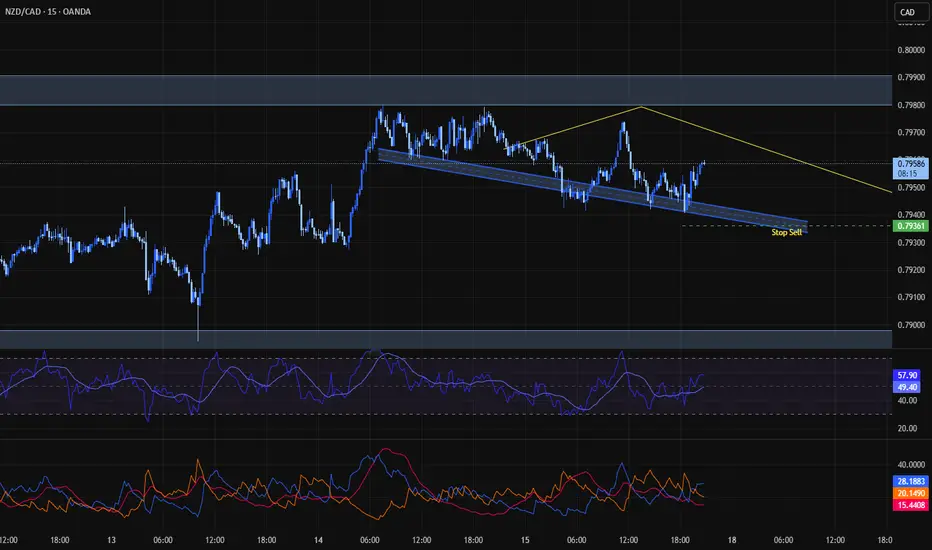
Update on the watchlist analysis NZDCADThe price is moving according to our watchlist analysis. Right now, there are **two options**:
1. Take a **risky short entry** immediately.
2. Use the **predefined sell stop** we set earlier.


Sell NZDCADBearish pressure for today although had a bull recovery last few days but under pressure and selling today

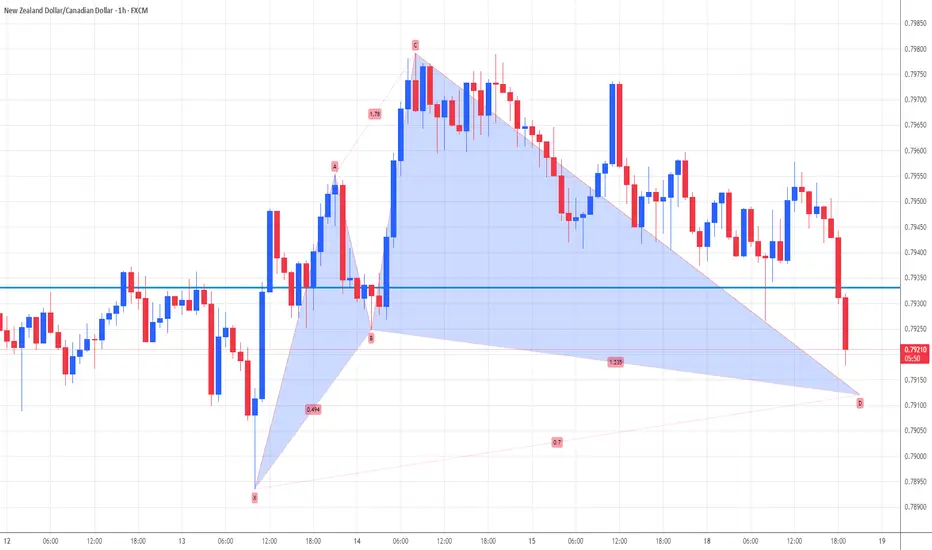
NZDCAD AnalysisCycle is bearish in the higher timeframe, and this move is basically a correction followed by another drop — forming a lower high in the bigger cycle.
Even though we’re analyzing on the 1H timeframe, we’re actually catching the **last part of the move in the higher-timeframe cycle** to get an earlier entry.
So you can say our analysis and entry are done **across multiple cycles — a true multi-timeframe approach.
The trendline we marked is valid, and a **break + pullback** can give us a clean entry trigger toward our first target.
The second entry option is a bit more **risky**, since it’s without a confirmed pullback and is based on a **sell stop.
Each method has its own pros and cons, and once price reaches the first target we will reassess the setup.
The entire market and its movements are under our close watch.

NZDCADAccording to the current quarter, price has been below the average. There was a sign of weakness on the week on 11/16/25 and since then, price has some bullish momentum going on. I want to see if price can test the current target. If not, remember that trading is simply a game of probabilities. It's not much to grab according to my target but I have to stick to my strategy.

NZDCAD BEARISH BIAS|SHORT|
✅NZDCAD NZDCAD rejected the 2H supply after collecting buy-side liquidity, forming strong bearish displacement. With order flow shifting lower, price is expected to drive toward the sell-side liquidity at the marked target zone. Time Frame: 2H
SHORT🔥
✅Like and subscribe to never miss a new idea!✅

NZDCAD: Short Trade Explained
NZDCAD
- Classic bearish formation
- Our team expects fall
SUGGESTED TRADE:
Swing Trade
Sell NZDCAD
Entry Level - 0.7912
Sl - 0.7921
Tp - 0.7894
Our Risk - 1%
Start protection of your profits from lower levels
Disclosure: I am part of Trade Nation's Influencer program and receive a monthly fee for using their TradingView charts in my analysis.
❤️ Please, support our work with like & comment! ❤️

NZDCAD AnalysisThis pair, like the previous ones, has hit our target. You could take a long position up to the top of the channel, but since there’s only one day left in the week, I prefer not to open a position.
We’ll review it in next week’s watchlist and set the entry trigger then.

NZD/CAD BEARS ARE STRONG HERE|SHORT
Hello, Friends!
The BB upper band is nearby so NZD-CAD is in the overbought territory. Thus, despite the uptrend on the 1W timeframe I think that we will see a bearish reaction from the resistance line above and a move down towards the target at around 0.788.
Disclosure: I am part of Trade Nation's Influencer program and receive a monthly fee for using their TradingView charts in my analysis.
✅LIKE AND COMMENT MY IDEAS✅

NZDCAD SHORT Market structure bearish on HTFs DW
Entry at Both Weekly and Daily AOi
Weekly Rejection at AOi
Previous Weekly Structure Point
Daily Rejection at AOi
Previous Structure point Daily
Around Psych Level 0.80000
H4 Candlestick rejection
TP: WHO KNOWS!
Entry 105%
REMEMBER : Trading is a Game Of Probability
: Manage Your Risk
: Be Patient
: Every Moment Is Unique
: Rinse, Wash, Repeat!
: Christ is King.

Update and review of NZDCADThis pair has also hit the targets of both triggers — the one we marked at the start of the week and the one mid-week — and it moved very nicely.

NZDCAD Wave Analysis – 19 November 2025
- NZDCAD reversed from resistance zone
- Likely to fall to support level 0.7850
NZDCAD currency pair recently reversed down from the resistance zone between the resistance level 0.7950, 20-day moving average and the lower trendline of the recently broken down channel from July.
The downward reversal from this resistance zone accelerated the active impulse wave iii – which belongs to the impulse waves 3 and (3).
Given the clear daily downtrend, NZDCAD currency pair can be expected to fall further to the next support level 0.7850, which reversed the rice sharply in April.

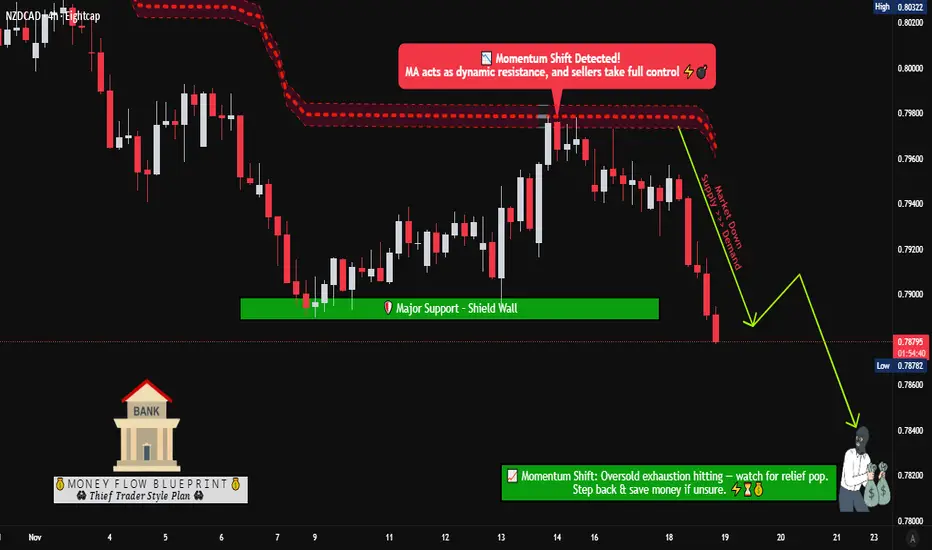
Will NZD/CAD Extend Lower? Bearish Structure and Level Guide🎯 NZD/CAD BEARISH SWING TRADE | Multi-Layer Entry Strategy 📉
💱 Asset Overview
Pair: NZD/CAD (New Zealand Dollar vs Canadian Dollar)
Market: Forex
Trade Type: Swing Trade (Bearish Setup)
Timeframe: Multi-day to Multi-week
📊 Technical Analysis & Trade Setup
🔴 Bearish Confirmation Signals:
✅ Moving Average pullback indicating trend reversal
✅ Strong support level breakout confirmed
✅ Price action showing distribution pattern
✅ Momentum shifting to sellers' control
🎯 TRADE EXECUTION PLAN
📍 Entry Strategy: "THIEF Layering Method"
Multi-Limit Order Approach (Scaling into position):
🔹 Layer 1: Sell Limit @ 0.79500
🔹 Layer 2: Sell Limit @ 0.79250
🔹 Layer 3: Sell Limit @ 0.79000
💡 Note: You can add more layers based on your capital allocation and risk management strategy. This layering approach helps average your entry price and reduces timing risk.
🛑 Stop Loss Management
Thief's SL: 0.79600
⚠️ IMPORTANT DISCLAIMER:
Dear Ladies & Gentlemen (Thief OG's) - This is MY stop loss level based on my strategy. YOU MUST adjust your SL according to:
Your own risk tolerance
Your account size
Your trading strategy
Your position sizing
Trading is YOUR responsibility. Manage your risk accordingly!
🎯 Take Profit Target
Primary Target: 0.78200
📍 Target Reasoning:
Strong historical support zone
Oversold conditions expected
Potential bull trap area - ideal profit-taking zone
⚠️ IMPORTANT DISCLAIMER:
Dear Ladies & Gentlemen (Thief OG's) - This is MY target based on technical analysis. YOU decide when to take profits based on:
Your profit goals
Market conditions
Your trading plan
Risk-reward ratio
Secure your profits at YOUR comfort level!
🔗 Related Pairs to Watch (Correlation Analysis)
📈 Correlated USD Pairs:
1️⃣ NZD/USD (Kiwi Dollar Index)
Direct correlation with NZD/CAD
If NZD/USD weakens → supports our bearish NZD/CAD trade
Watch for: RBNZ policy signals, New Zealand economic data
2️⃣ USD/CAD (Loonie)
Inverse correlation with NZD/CAD
If USD/CAD strengthens → CAD strength supports our trade
Key factors: Oil prices (CAD is commodity-linked), BoC policy
3️⃣ AUD/CAD (Aussie/Loonie)
Strong correlation (both antipodean currencies)
Similar risk-on/risk-off behavior
Watch: Commodity prices, China economic data
4️⃣ AUD/NZD (Trans-Tasman Cross)
Shows relative strength between similar economies
If trending down → NZD weakness confirmed
Key for: Regional risk sentiment
🔑 Key Fundamental Factors to Monitor:
🇳🇿 New Zealand Drivers:
RBNZ interest rate decisions
Dairy prices (major export)
GDP & employment data
China economic health (largest trading partner)
🇨🇦 Canadian Drivers:
Bank of Canada policy stance
Crude oil prices (Canada's major export)
US economic data (largest trading partner)
Employment & inflation figures
🌍 Global Risk Sentiment:
Commodity price trends
Risk-on vs risk-off flows
US Dollar strength/weakness
Global growth outlook
⚡ Risk Management Reminders:
✔️ Never risk more than 1-2% of your account per trade
✔️ Use proper position sizing across all layers
✔️ Monitor correlations - avoid overexposure to similar trades
✔️ Set alerts for key technical levels
✔️ Be prepared to adjust if fundamentals shift
Trade at your own risk. Only invest capital you can afford to lose.
🔔 Follow for More Trade Ideas | 👍 Like if You Find Value | 💬 Share Your Thoughts Below!
Good luck, Thief OG's! Trade safe, trade smart! 💰📊

Update on NZDCAD analysis.This pair, according to our analysis, got rejected from the top of the channel.
For those who missed the initial move, we marked a zone where we suggested placing a sell stop to avoid missing the continuation of the trend.
In any case, everyone should now be in profit on this position, and our target is the bottom of the channel.

NZDCAD⬆️ Buy Entry: 0.79320
⏹️ Stop Loss: 0.78800
*️⃣ Take Profit-1: 0.79940
*️⃣ Take Profit-2: 0.80220

NZDCAD Analysis – Weekly Watchlist UpdateIn our weekly watchlist analysis, the plan was to trade inside the range.
At the start of the week, price dropped and then quickly pulled back — these small fluctuations are normal during early-week market conditions.
According to our original scenario, the outlook is still valid:
We can look for a sell setup at the top of the range, but only with confirmation.
A buy-stop above the trendline, where price previously bounced, also remains a valid protective plan.
If price breaks above the range and confirms the breakout, our current analysis becomes invalid, and we will update the outlook accordingly.