NZDCAD LongWe are awaiting for the Retest of the bullish order block. if it does not get violated we enter after that CISD ((Change in the State of Delivery) candle. Let see how it goes
Trade ideas

NZD/CAD BULLS WILL DOMINATE THE MARKET|LONG
Hello, Friends!
NZD/CAD downtrend evident from the last 1W red candle makes longs trades more risky, but the current set-up targeting 0.814 area still presents a good opportunity for us to buy the pair because the support line is nearby and the BB lower band is close which indicates the oversold state of the NZD/CAD pair.
Disclosure: I am part of Trade Nation's Influencer program and receive a monthly fee for using their TradingView charts in my analysis.
✅LIKE AND COMMENT MY IDEAS✅

NZDCADJust identified a potential continuation setup,price is trading lower, and a retest of structural resistance supports a bearish move. Executing with conviction.

Bullish bounce off?NZD/CAD has bounced off the support level, which is a pullback support that aligns with the 38.2% Fibonacci retracement and could bounce from this level to our take profit.
Entry: 0.8107
Why we like it:
There is a pullback support that aligns with the 38.2% Fibonacci retracement.
Stop loss: 0.8034
Why we like it:
There is a pullback support level.
Take profit: 0.8238
Why we like it:
There is a pullback resistance level.
Enjoying your TradingView experience? Review us!
Please be advised that the information presented on TradingView is provided to Vantage (‘Vantage Global Limited’, ‘we’) by a third-party provider (‘Everest Fortune Group’). Please be reminded that you are solely responsible for the trading decisions on your account. There is a very high degree of risk involved in trading. Any information and/or content is intended entirely for research, educational and informational purposes only and does not constitute investment or consultation advice or investment strategy. The information is not tailored to the investment needs of any specific person and therefore does not involve a consideration of any of the investment objectives, financial situation or needs of any viewer that may receive it. Kindly also note that past performance is not a reliable indicator of future results. Actual results may differ materially from those anticipated in forward-looking or past performance statements. We assume no liability as to the accuracy or completeness of any of the information and/or content provided herein and the Company cannot be held responsible for any omission, mistake nor for any loss or damage including without limitation to any loss of profit which may arise from reliance on any information supplied by Everest Fortune Group.

NZDCAD-BULLISH IDEANZDCAD is in bull run as it broked its descending channel and crossed its 0.5 fib level.

Bullish 4Hr Entry Top down analysis: weekly, Daily, 4hr. Textbook trade. I waited for the impulse move and then entered on the retracement.

NZDCAD WILL GROW|LONG|
✅NZDCAD Price reacted from the daily demand level after a clean liquidity sweep below equal lows. Smart money buyers are now targeting buy-side liquidity near 0.8155. Time Frame 4H.
LONG🚀
✅Like and subscribe to never miss a new idea!✅

NZD/CAD Pair Poised for a Powerful Breakout!
The NZD/CAD has consistently moved sideways, forming a classic consolidation pattern. But here’s the twist—it often fakes a breakout before surging upward with force. That’s exactly what we’re seeing now: a deceptive dip followed by a strong bullish momentum.
📈 Based on current price action, we anticipate a continued rally toward the key targets outlined in the chart. The breakout is real this time—and it’s gaining steam.
Stay sharp. The move is unfolding.
---

NZD-CAD Free Signal! Buy!
Hello,Traders!
NZDCAD taps into demand and holds structure, with Smart Money accumulation pointing to higher pricing. Imbalance fills hint at continuation toward premium levels.
-------------------
Stop Loss: 0.8105
Take Profit: 0.8158
Entry: 0.8136
Time Frame: 3H
-------------------
Buy!
Comment and subscribe to help us grow!
Check out other forecasts below too!
Disclosure: I am part of Trade Nation's Influencer program and receive a monthly fee for using their TradingView charts in my analysis.

NZD/CAD: This Hard As Stone Support Area Will Be Our Next TargetHere is my 4H NZD/CAD chart, this will be my third time to enter from this area of support. If u take a closer look u will see how strong and stubborn this support area and it pushes the price very high each time it comes near it, so I will enter a buy trade once the price is near it and it gives me a bullish price action. I will be targeting from 100 to 150 pips in this trade.

Bears Trapped - Bulls Coil for Breakout📊 **To view my confluences and linework:**
Step 1️⃣: Grab the chart
Step 2️⃣: Unhide Group 1 in the object tree
Step 3️⃣: Hide and unhide specific confluences one by one
💡 **Pro tip:** Double-click the screen to reveal RSI, MFI, CVD, and OBV indicators alongside divergence markings! 🎯
Title: 🎯 NZD/CAD: Bears Trapped - Bulls Coil for Breakout
The Market Participant Battle:
Bears pushed NZD/CAD down to 0.805 (point 2), establishing what they thought was firm control. However, at point 4 (around 0.812), we're witnessing a classic liquidity grab and bear trap. The sellers who drove price down are now getting squeezed as price closes above the initial breakout level (point 1). Bulls have absorbed all selling pressure at this critical zone, forming a higher high with full bullish body candles that signal institutional accumulation. The expected return is a continuation to 0.817-0.820 as bears are forced to cover shorts and bulls establish momentum for a sustained upside move.
Confluences:
Confluence 1: Linear Regression Channel (Points 1→3) ✅
Your analysis shows an uptrending linear regression channel from point 1 to point 3. Using this angle, you've captured 4 candles at point 4, showing price respecting this mathematical projection. This isn't coincidence - it's geometry and regression math working in harmony. The channel acts as a dynamic support structure, and point 4's reaction demonstrates bulls using this mathematical framework as a launch pad. The fact that price respected this angle precisely suggests institutional algorithms are aligned with this uptrend trajectory.
Confluence 2: Fixed Range Volume Profile (Points 1→3) ✅
The FRVP from points 1-3 reveals point 4 pierced through the value area high (VAH) and value area low (VAL), then rejected upward. This is textbook liquidity grab behavior - price swept below value to trigger stops and trap bears, only to immediately reverse. This rejection signals a potential liquidity grab before continuation, indicating smart money accumulated positions below fair value before pushing price higher. The volume profile shows this area was contested, making the reversal more significant.
Confluence 3: Anchored VWAP from Point 1 ✅
Point 4 touched the 1st standard deviation of the anchored VWAP before closing above it. This is bullish price action - the initial deviation touch often represents maximum discount pricing before institutional players step in. Price closed above VWAP, and now there's potential for a pullback to VWAP before continuation upward. The AVWAP serves as a magnet, and being above it suggests bulls have regained control of the average institutional position.
Confluence 4: Fibonacci Retracement (Points 2→3) ✅
Your fib retracement from point 2 to point 3 shows point 4 touched the 0.705 level before moving up. This is the logical retracement zone in a normal uptrend - not the typical 0.618 or 0.5, but rather a deeper institutional accumulation zone. The 0.705 level often represents where smart money adds to positions before the next leg up. This retracement holding validates the trend structure and suggests the bullish move from point 2 to point 3 is legitimate and not a false breakout.
Confluence 5: Price Action Structure ✅
Point 3 closed above point 1, confirming point 2 as a valid market structure base. At point 4, we see a bearish candle getting bullish pressure followed by a full bullish body candle closing with a higher high. This is classic absorption and reversal pattern - sellers were absorbed completely, and buyers overwhelmed them with conviction. The fact that a full bullish body formed (not a wick-heavy candle) shows institutional-level buying, not retail speculation.
Web Research Findings:
- **Technical Analysis:** Current technical outlook shows mixed signals with some analysts calling for bullish bounces from support around 0.806, while overall weekly/monthly ratings lean bearish. The RSI at 50.4 suggests neutral territory, but ADX at 54.43 indicates a strong trend is forming . Your setup aligns with the bullish bounce thesis from key support.
- **Recent News/Economic Calendar:** RBNZ recently lowered the OCR to 3.25% and held it there as of July 2025, with inflation expected to return to the 2% midpoint by early 2026. Elevated export commodity prices and lower interest rates are supporting recovery in the NZ economy . Bank of Canada lowered rates to 2.50% in September 2025, with next decision October 29th. Core inflation has been around 3%, and there's an easing bias with potential for further cuts .
- **Analyst Sentiment:** TradingView community shows mixed sentiment with some calling for bullish bounces from current support levels around 0.806-0.808, while others expect bearish continuation. Several analysts highlight this as a "hard as stone" support area that has pushed price higher multiple times .
- **Interest Rate Impact:** The interest rate differential is narrowing (RBNZ at 3.25%, BoC at 2.50%), with both banks in easing cycles. The RBNZ's stance is that lower rates will support economic recovery with elevated export prices , which could support NZD strength. However, BoC's aggressive cutting (currently at 2.50% with potential to reach 2.00-2.25% by year-end) may lead to CAD weakness, supporting your bullish NZD/CAD thesis.
- **Commodity Correlation:** Both NZD and CAD are commodity currencies - NZD tied to dairy/agricultural products, CAD to oil. Commodity currencies have been influenced by Chinese bond yields recently, with tight correlations observed. NZD's agricultural export prices remain elevated per RBNZ statements .
Layman's Summary:
In simple terms, both New Zealand and Canada are cutting interest rates, but Canada is cutting more aggressively (2.50% vs 3.25%). This means the Canadian dollar might weaken faster than the NZ dollar. New Zealand is benefiting from high prices for its dairy and meat exports, which brings money into the country. Your trade is trying to catch NZD/CAD at a spot where it's bounced before (around 0.812) and ride it up to 0.817-0.820. The charts show multiple technical reasons why this bounce could work - price hit important mathematical levels (regression channel, Fibonacci), volume shows buyers stepped in at this exact spot, and the price action shows sellers got trapped. The big risk is that both central banks are still cutting rates due to economic weakness, and if global trade tensions worsen or if Canada's economy stabilizes faster than expected, this trade could reverse. Next major event is October 29th (BoC decision) - if they signal more cuts, CAD could weaken further helping your trade.
Machine Derived Information:
- **Image 1 (2H Chart with Fib Levels):** Shows price structure from point 1 (baseline) to point 2 (low at ~0.8055), point 3 (high at ~0.813), and point 4 (current reaction zone ~0.812). Multiple horizontal Fibonacci levels visible at 0.62, 0.705, and 0.79. Linear regression channel drawn from 1→3. - **Significance:** Demonstrates price is at confluence of fib 0.705 retracement and linear regression support. - **AGREES ✔**
- **Image 2 (2H Chart with VWAP):** Same timeframe showing anchored VWAP from point 1, with visible VWAP deviation bands. Point 4 shows interaction with 1st standard deviation band. - **Significance:** AVWAP touch at point 4 represents institutional "fair value" test, with price now trading above VWAP suggesting bullish control. - **AGREES ✔**
- **Image 3 (2H Chart with Volume Profile):** Shows Fixed Range Volume Profile from points 1→3 with cyan/pink volume bars on left side showing high/low volume areas. Point 4 clearly pierces through value area zones then rejects higher. - **Significance:** Liquidity grab through value area followed by rejection confirms smart money accumulation pattern - bears trapped below value. - **AGREES ✔**
- **Image 4 (2H Chart Clean View):** Cleaner view of price structure with horizontal line at ~0.812 extending from point 4. Shows full bullish body candle formation at point 4 after bearish pressure. - **Significance:** Price action confirms absorption pattern - bearish candle absorbed, followed by decisive bullish close with full body (not wick-heavy), indicating institutional buying. - **AGREES ✔**
- **Image 5 (2H Chart with Channels):** Shows three colored regression channels (blue, pink/red, green) forming a converging pattern at current price (point 4). This is the "geometry and linear regression math" you referenced. - **Significance:** Multiple timeframe channels converging at point 4 creates high-probability reaction zone - when different mathematical projections align, institutional algorithms often respect these levels. - **AGREES ✔**
Actionable Machine Summary:
All five images show the same story from different technical angles: Point 4 (current price ~0.812) represents a multi-confluence zone where linear regression geometry, volume profile value areas, anchored VWAP deviation, and Fibonacci retracement all align. The price action (bearish candle getting overwhelmed by full bullish body) confirms this isn't just theoretical - actual buying occurred at this exact level. The converging channels in Image 5 are particularly significant because they represent different timeframe projections meeting at one point, which increases the probability of institutional algorithm participation. For execution, this means: 1) Entry around 0.812 has strong mathematical and volume-based support, 2) Initial stop below 0.810 (below VWAP and volume profile VAL) protects against invalidation, 3) First target at 0.817 (near point 3 high), extended target at 0.820 if momentum continues, 4) The multi-confluence nature means even if price pulls back slightly, these levels should hold on retest.
Conclusion:
**Trade Prediction: SUCCESS ✅**
**Confidence: MEDIUM-HIGH**
**Key Reasons for Success:**
1. **Multi-Confluence Technical Alignment:** Five distinct technical confluences (linear regression channel, FRVP value area, AVWAP 1st deviation, Fibonacci 0.705, converging channels) all align at point 4 around 0.812 - this creates a high-probability zone
2. **Price Action Confirmation:** Full bullish body candle after bearish absorption shows institutional-level buying, not retail speculation
3. **Volume Profile Liquidity Grab:** FRVP shows classic bear trap pattern - price swept below value area to trigger stops, then immediately reversed showing smart money accumulation
4. **Structural Validation:** Point 3 closed above point 1, confirming point 2 as valid base - uptrend structure intact
5. **Interest Rate Differential Tailwind:** BoC cutting more aggressively (2.50%) than RBNZ (3.25%) with potential for further BoC cuts creates fundamental support for NZD/CAD upside
**Key Risks:**
1. **Both Central Banks in Easing Mode:** Both RBNZ and BoC cutting rates due to economic weakness - this creates two-sided risk if sentiment shifts
2. **October 29th BoC Decision Risk:** Major catalyst ahead - if BoC surprises by holding or signaling pause in cuts, CAD could strengthen against your position
3. **2H Timeframe Constraints:** Setup is on 2-hour charts - this is relatively short-term and susceptible to intraday volatility or news-driven whipsaws
4. **Mixed Analyst Sentiment:** While your support level is recognized, weekly/monthly technical ratings still show bearish bias - you're taking a contrarian position
5. **Commodity Currency Volatility:** Both currencies tied to commodity prices and Chinese economic data - any negative surprise from China could hit both but affect positioning
**Risk/Reward Assessment:**
Entry: ~0.812
Stop Loss: Below 0.810 (below VWAP and value area low) = ~20 pips risk
Target 1: 0.817 = ~50 pips reward (2.5:1 R/R)
Target 2: 0.820 = ~80 pips reward (4:1 R/R)
The R/R is favorable, and the multi-confluence technical setup provides strong justification. However, the 2H timeframe means this is more of a swing trade (1-3 days) rather than position trade.
**Final Recommendation: TAKE THE TRADE WITH CAUTION ⚠️**
This is a technically sound setup with five aligned confluences and clear price action confirmation. The risk/reward is favorable, and the bear trap pattern at point 4 is textbook. However, given the October 29th BoC decision upcoming, consider taking partial profits at 0.817 (first target) and managing the remainder with a trailing stop. The Medium-High confidence (not High) reflects the 2H timeframe constraints, mixed fundamental picture (both banks easing), and upcoming catalyst risk. If price pulls back to test 0.812 again after initial move up, that would be a high-confidence add location as it would confirm the level. Scale in with proper position sizing given the timeframe and event risk.
**Bottom Line:** Bears got trapped at 0.812, bulls have established control with volume and price action confirmation. Multi-confluence technical setup supports 50-80 pip upside to 0.817-0.820. Take the trade, but manage around October 29th BoC decision risk. 🎯

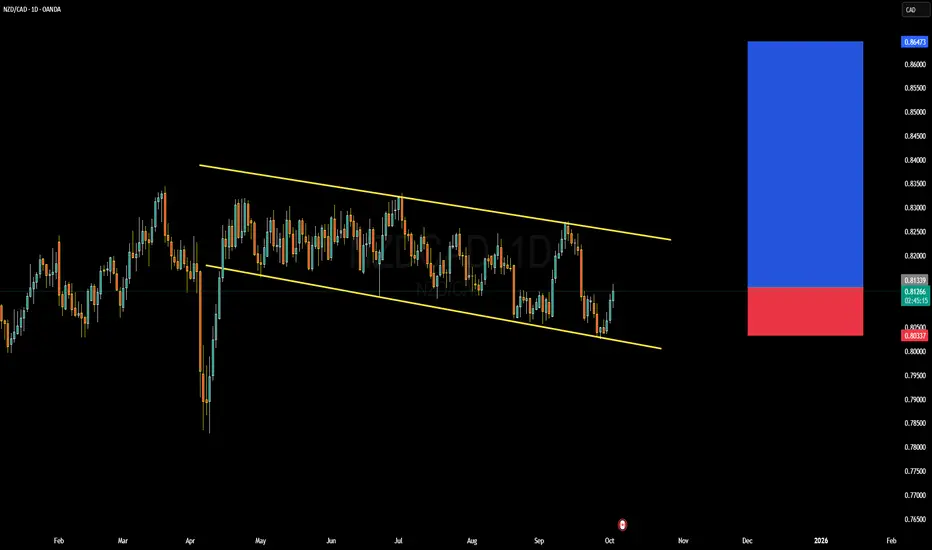
NZDCAD Forming Falling WedgeNZD/CAD is currently holding near a structural demand zone, after a sustained downtrend in recent months. Price has shown multiple rejections of lower levels, forming a potential accumulation base—this hints at a possible swing reversal if bulls step in with conviction. On the upside, the key pivot zone around 0.85-0.86 becomes resistance to watch for a breakout. If broken, price could target 0.860+ as the next clean supply area.
Fundamentally, both New Zealand and Canada are commodity exporters, which ties their currencies closely to global commodity trends. The NZD tends to benefit from softness in CAD when energy prices weaken, and vice versa. At present, global demand for oil is under pressure, which is a headwind for CAD. Meanwhile, New Zealand’s economy is exhibiting moderate resilience, and dairy export strength may lend supportive tailwinds to NZD. These dynamics slightly favor NZD in the cross.
With technical structure and macro tailwinds aligned, the risk/reward is better skewed toward a long entry from the demand zone, provided price holds and shows bullish confirmation (e.g. a strong reversal candle). I’d place stop below the recent swing low and scale into potential breakout above resistance. But if price breaks down decisively below the demand shelf, the bearish bias resumes and invalidates the bullish thesis.
NZDCAD: Short-Term Bullish Move After BreakoutNZDCAD: Short-Term Bullish Move After Breakout
Yesterday, NZDCAD broke out of a strong zone and, after retesting support near 0.8065, the price bounced and resumed a bullish move.
This could turn into either a larger rally or just a corrective move, since the NZD still shows overall weakness.
However, a correction was expected, as the NZD had been oversold for some time.
In the short term, I expect NZDCAD to face resistance at 0.8115 first, followed by 0.8145.
From a fundamental perspective, there’s no major driver behind this move — so it’s best to watch how price action develops.
You may find more details in the chart!
Thank you and Good Luck!
❤️PS: Please support with a like or comment if you find this analysis useful for your trading day❤️

NZDCAD: Bearish Forecast & Outlook
The charts are full of distraction, disturbance and are a graveyard of fear and greed which shall not cloud our judgement on the current state of affairs in the NZDCAD pair price action which suggests a high likelihood of a coming move down.
Disclosure: I am part of Trade Nation's Influencer program and receive a monthly fee for using their TradingView charts in my analysis.
❤️ Please, support our work with like & comment! ❤️

NZD/CAD SHORT 4HHello
short on this pair on 4h
better entry in 5 mn whit break of structure and retest
happy day
thank you

Bullish momentum building?NZD/CAD has reacted off the pivot which acts as a pullback support and could potentially rise to the 1st resistance.
Pivot: 0.81142
1st Support: 0.80640
1st Resistance: 0.81973
Disclaimer:
The above opinions given constitute general market commentary, and do not constitute the opinion or advice of IC Markets or any form of personal or investment advice.
Any opinions, news, research, analyses, prices, other information, or links to third-party sites contained on this website are provided on an "as-is" basis, are intended only to be informative, is not an advice nor a recommendation, nor research, or a record of our trading prices, or an offer of, or solicitation for a transaction in any financial instrument and thus should not be treated as such. The information provided does not involve any specific investment objectives, financial situation and needs of any specific person who may receive it. Please be aware, that past performance is not a reliable indicator of future performance and/or results. Past Performance or Forward-looking scenarios based upon the reasonable beliefs of the third-party provider are not a guarantee of future performance. Actual results may differ materially from those anticipated in forward-looking or past performance statements. IC Markets makes no representation or warranty and assumes no liability as to the accuracy or completeness of the information provided, nor any loss arising from any investment based on a recommendation, forecast or any information supplied by any third-party.

NZDCAD FREE SIGNAL|SHORT|
✅NZDCAD Price has tapped into the supply level after a corrective push, rejecting inefficiency and signaling continuation lower. ICT perspective suggests targeting liquidity resting below recent lows. Time Frame 4H.
—————————
Entry: 0.8115
Stop Loss: 0.8135
Take Profit: 0.8085
Time Frame: 4H
—————————
SHORT🔥
✅Like and subscribe to never miss a new idea!✅

NZDCAD - Bullish Momentum returningNZDCAD is showing signs of finally reversing a longer term down trend.
Indecisiveness will be likely result in large volatility ranges in the lower timeframe.

NZDCAD → A false breakthrough will trigger a decline FX:NZDCAD is forming a countertrend correction with the aim of retesting key resistance and the liquidity zone amid a global downtrend.
A reaction to the support zone is forming. The price is recovering, but within the global downtrend. The countertrend movement may end in the resistance zone of 0.811 - 0.8125
The global trend is downward, but we are seeing a rebound within the retest of the channel support. There is a fairly large pool of liquidity ahead, which is capable of stopping the price from rising at a high speed. A false breakout of 0.811 - 0.8125 could trigger a decline.
Resistance levels: 0.811 - 0.8125
Support levels: 0.8056, 0.8030
A false breakout, consolidation below the specified zone, and a price close below the level could trigger a further decline.
Best regards, R. Linda!

NZDCAD LongWe have a CRT candle in 1 day. We are hoping to buy thids pair to tohe top of that CRT candle. Lets see how it goes

NZDCADThis is another setup on my watchlist. I see price trending upward.if momentum holds, a clean retest followed by continuation would offer a solid entry.

NZDCAD Set To Fall! SELL!
My dear friends,
My technical analysis for NZDCAD is below:
The market is trading on 0.8065 pivot level.
Bias - Bearish
Technical Indicators: Both Super Trend & Pivot HL indicate a highly probable Bearish continuation.
Target - 0.8053
Recommended Stop Loss - 0.8072
About Used Indicators:
A pivot point is a technical analysis indicator, or calculations, used to determine the overall trend of the market over different time frames.
Disclosure: I am part of Trade Nation's Influencer program and receive a monthly fee for using their TradingView charts in my analysis.
———————————
WISH YOU ALL LUCK

NZDCAD 4H Timeframe – Technical & Fundamental AnalysisNZDCAD 4H Timeframe – Technical & Fundamental Analysis
Fundamentals:
The New Zealand economy is showing signs of broadening slowdown, according to BNZ high-frequency data. Trade performance is expected to weigh on growth in coming quarters, and the HYEFU (Half-Year Economic and Fiscal Update) points toward weaker outlook ahead. With inflation trending down, the RBNZ may shift toward a more dovish stance, reducing NZD’s attractiveness.
Meanwhile, Canada’s July GDP posted a +0.2% rebound after months of contraction, signaling underlying strength in the Canadian economy. This resilience could provide support for CAD relative to NZD.
Technicals:
Price broke below the major key support at 0.80600, signaling weakness.
Following the breakout, price consolidated and accumulated sell positions under this level.
A possible liquidity grab above 0.80600 may occur before resuming the bearish move.
Our point of interest lies below 0.80560, aligning with the bearish structure and fundamentals.
📌 Trading Plan (4H Bias – Bearish):
Point of Interest (POI): 0.80560 (Sell Stop)
Stop Loss (SL): 0.81100 (above liquidity zone)
Take Profit 1 (TP1): 0.79410
Take Profit 2 (TP2): 0.78800
📌 Disclaimer: This is not financial advice. Always wait for proper confirmation before executing trades. Manage your risk wisely and trade what you see—not what you feel.
