NZDCAD – Kiwi Momentum Builds, Eyeing 0.8320NZDCAD has rallied hard after breaking its bearish structure, and momentum remains firmly with the bulls. The pair is consolidating just under 0.8250, suggesting another leg higher could be in play. With the New Zealand dollar supported by commodity optimism and firm domestic data, while the Canadian dollar struggles under softer growth and oil market volatility, the backdrop favors continued upside.
Current Bias
Bullish – Trend is intact above 0.8190, with bulls targeting higher resistance levels.
Key Fundamental Drivers
New Zealand: Positive economic momentum (recent uptick in building consents and commodity prices) underpins NZD.
Canada: Weak labor market data and rising BoC rate-cut expectations weigh on CAD.
Commodities: Oil’s pullback limits CAD strength, while dairy and agricultural stability lend some support to NZD.
Macro Context
Interest rates: The RBNZ is less dovish than the BoC, keeping relative support under NZD.
Economic growth: Canada is slowing, while NZ shows resilience despite global headwinds.
Commodity flows: Oil softness pressures CAD, while NZ’s export-linked economy benefits from steady demand.
Geopolitical themes: Tariff risks and global risk sentiment swings influence commodity currencies, but CAD remains more exposed to downside via oil.
Primary Risk to the Trend
A sharp recovery in oil prices or a hawkish surprise from the Bank of Canada could reverse NZDCAD gains.
Most Critical Upcoming News/Event
BoC September decision & commentary – critical for CAD direction.
NZ GDP and RBNZ forward guidance – key for sustaining NZD momentum.
Leader/Lagger Dynamics
NZDCAD is more of a lagger, responding to moves in broader NZD crosses (like NZDUSD or EURNZD) and CAD drivers (oil, USDCAD). However, it can lead other CAD crosses if BoC policy expectations shift sharply.
Key Levels
Support Levels: 0.8190, 0.8145
Resistance Levels: 0.8270, 0.8320
Stop Loss (SL): 0.8145 (below key support and recent structure)
Take Profit (TP): 0.8320 (major upside target)
Summary: Bias and Watchpoints
NZDCAD bias is bullish, with SL at 0.8145 and TP at 0.8320. The Kiwi is supported by firmer domestic data and RBNZ credibility, while CAD weakness stems from soft jobs, BoC cut expectations, and oil struggles. The key risk is a CAD rebound on oil or a BoC surprise. Traders should watch the upcoming BoC decision and NZ data releases for confirmation. If momentum holds, a clean break of 0.8270 could open the door toward 0.8320.
Trade ideas

NZDCAD H1NZDCAD has been bullish and currently pulling back to the famous 0.5-0.618 fib.
Confluences:
- Price forming HHs & HLs
- Price pulling back to 0.5 fib
- Price in ascending channel
- Price in sync with RSI

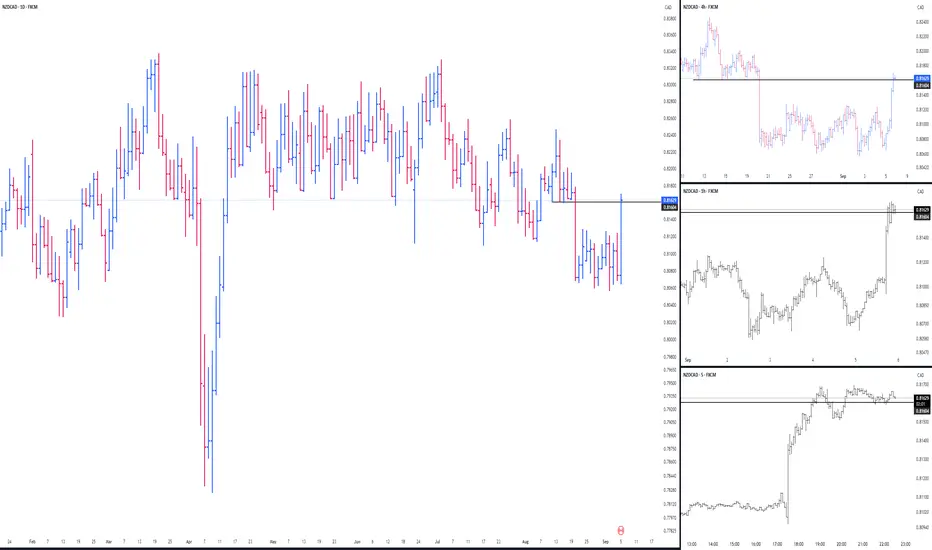
NZDCAD: Confirmed Break of Structure 🇳🇿🇨🇦
NZDCAD violated a major daily supply cluster and closed above that.
The broken structure turns into a potentially significant demand zone now.
With a high probability, a strong bullish movement will follow from that.
Next goal - 0.83
❤️Please, support my work with like, thank you!❤️
I am part of Trade Nation's Influencer program and receive a monthly fee for using their TradingView charts in my analysis.

Applying the Nx BIAS indicator to NZDCAD After my latest thread about the 🛡️ Nx BIAS 🛡️ indicator for determining market bias, I decided to take a scalp trade as a backtesting exercise on the NZDCAD pair.
Entry details:
Defined the DOL and Invalidation levels using the Nx Bias indicator on the 1H timeframe.
Identified the area of interest and executed the entry on the 1m timeframe for the same pair.
Next steps and forward testing:
I will be testing this indicator more extensively. The main goal is to rely solely on it for bias determination under live market conditions to evaluate its real-time performance, moving beyond backtesting results.
Disclaimer: Do Your Own Research (DYOR).
Best regards,
Note: The indicator is not yet available and will be released soon under the name Nx Candle Bias.
NZD/CAD – Short Setup on False BreakoutThe pair is moving inside a descending channel. Price is now trying to move above the upper boundary.
The plan is that the market may form a false breakout above the previous highs and the channel line, and then return back into the blue range.
📌 Plan: establish a short position in the 0.826–0.8265 zone once a BC is confirmed.
Stop-loss: very wide, beyond 0.829
Take-profit: quoter-line of the channel around 0.8195
Risk/Reward: about 1:2
💡 Rationale: the descending channel structure remains intact. A breakout followed by a quick return would provide a clean short entry with limited risk.

NZDCAD - Expecting Bullish Continuation In The Short TermH1 - Strong bullish momentum.
No opposite signs.
Until the two Fibonacci support zones hold I expect the price to move higher further.
If you enjoy this idea, don’t forget to LIKE 👍, FOLLOW ✅, SHARE 🙌, and COMMENT ✍! Drop your thoughts and charts below to keep the discussion going. Your support helps keep this content free and reach more people! 🚀
--------------------------------------------------------------------------------------------------------------------

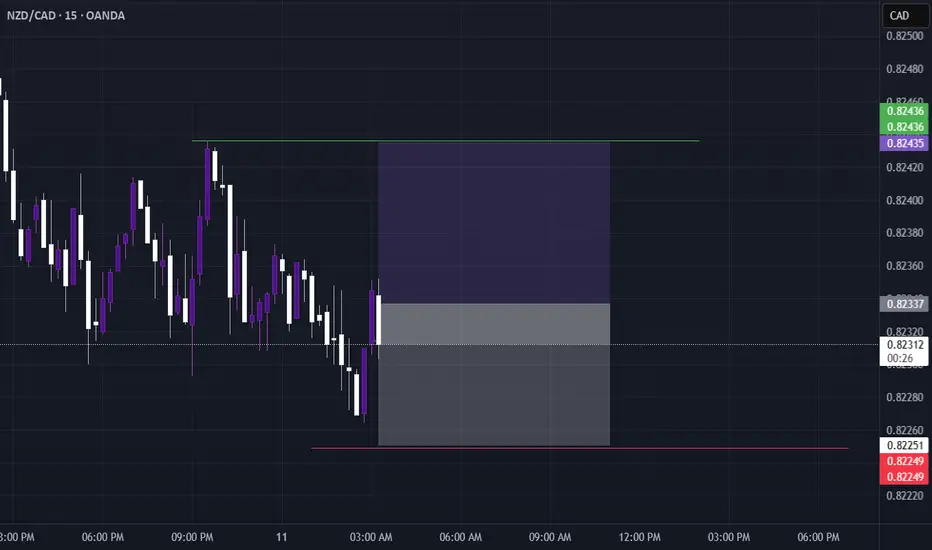
NZDCAD: Short-Term Trading SetupNZDCAD: Short-Term Trading Setup
NZDCAD created a new price high indicating for a growth on the bullish momentum.
We are looking at for a short term bullish movement given that the trend is bullish since Friday.
The previous candles are all green and the breakuot should support further.
Key Targets:
0.8243
0.8260
You may find more details in the chart!
Thank you and Good Luck!
❤️PS: Please support with a like or comment if you find this analysis useful for your trading day❤️


NZDCAD Short
ENTRY Market: 0.82052
SL 0.82358
TP 0.81746
The asset is currently overvalued versus the dollar index. I expect a short-term retracement.

NZDCAD: Trading Signal From Our Team
NZDCAD
- Classic bearish pattern
- Our team expects retracement
SUGGESTED TRADE:
Swing Trade
Sell NZDCAD
Entry - 0.8230
Stop - 0.8238
Take - 0.8216
Our Risk - 1%
Start protection of your profits from lower levels
Disclosure: I am part of Trade Nation's Influencer program and receive a monthly fee for using their TradingView charts in my analysis.
❤️ Please, support our work with like & comment! ❤️

NZDCAD Will Go UP!
HI,Traders !
#NZDCAD is trading in a
Local uptrend and the pair
Made a local correction
But will soon retest a
Horizontal support of 0.81257
From where we will be expecting
A further move up as we
Are locally bullish biased !
Comment and subscribe to help us grow !

Chronex | NZDCAD • LONG • Conviction • HighHello Guys!
🎯 90 % mechanical | Just your entry model
No trend-line art, no gut calls. Just a repeatable institutional process delivered every day at London Open
Context:
🧠 What Chronex does (bird’s-eye view)
- Scans all 28 major FX pairs every session.
- Ranks each currency’s relative strength / weakness from multi-TF data.
- Pairs strongest vs. weakest to create a tight outlook list.
- Adds built-in risk filters → posts one clean table: *Direction · Conviction · Entry zone · SL*.
📍 Today’s Playbook:
Risks
1. Do we have economic high impact news release?
2. Any higher-timeframe counter-trend zones?
3. Has better zone above/below?
Verdict:
💬 Drop questions, challenge the outlook, or share your own setups below!

NZD/CAD BEST PLACE TO SELL FROM|SHORT
Hello, Friends!
NZD-CAD uptrend evident from the last 1W green candle makes short trades more risky, but the current set-up targeting 0.812 area still presents a good opportunity for us to sell the pair because the resistance line is nearby and the BB upper band is close which indicates the overbought state of the NZD/CAD pair.
Disclosure: I am part of Trade Nation's Influencer program and receive a monthly fee for using their TradingView charts in my analysis.
✅LIKE AND COMMENT MY IDEAS✅

Bullish rise?NZD/CAD is falling towards the pivot and could potentially rise to the 1st resistance, which acts as a swing high resistance.
Pivot: 0.81917
1st Support: 0.81633
1st Resistance: 0.82550
Disclaimer:
The above opinions given constitute general market commentary, and do not constitute the opinion or advice of IC Markets or any form of personal or investment advice.
Any opinions, news, research, analyses, prices, other information, or links to third-party sites contained on this website are provided on an "as-is" basis, are intended only to be informative, is not an advice nor a recommendation, nor research, or a record of our trading prices, or an offer of, or solicitation for a transaction in any financial instrument and thus should not be treated as such. The information provided does not involve any specific investment objectives, financial situation and needs of any specific person who may receive it. Please be aware, that past performance is not a reliable indicator of future performance and/or results. Past Performance or Forward-looking scenarios based upon the reasonable beliefs of the third-party provider are not a guarantee of future performance. Actual results may differ materially from those anticipated in forward-looking or past performance statements. IC Markets makes no representation or warranty and assumes no liability as to the accuracy or completeness of the information provided, nor any loss arising from any investment based on a recommendation, forecast or any information supplied by any third-party.

NZD/CADWith the overall trend down and price stalling at pivot resistance R1, NZD/CAD is likely to drop
#fxutrading

NZDCADprice break Accumulation Box my entry between the fib level 0.50% to 0.618%.
EP:0.81319
SL:0.80572
TP:0.82066
RRR 1:1

NZD-CAD Will Go Down! Sell!
Hello,Traders!
NZD-CAD already made a
Retest of the horizontal
Level of 0.8170 from where
We are already seeing a
Bearish reaction so we
Will be expecting a
Further bearish move down
Sell!
Comment and subscribe to help us grow!
Check out other forecasts below too!
Disclosure: I am part of Trade Nation's Influencer program and receive a monthly fee for using their TradingView charts in my analysis.

NZDCAD Will Go Lower! Short!
Take a look at our analysis for NZDCAD.
Time Frame: 1D
Current Trend: Bearish
Sentiment: Overbought (based on 7-period RSI)
Forecast: Bearish
The price is testing a key resistance 0.817.
Taking into consideration the current market trend & overbought RSI, chances will be high to see a bearish movement to the downside at least to 0.808 level.
P.S
Overbought describes a period of time where there has been a significant and consistent upward move in price over a period of time without much pullback.
Disclosure: I am part of Trade Nation's Influencer program and receive a monthly fee for using their TradingView charts in my analysis.
Like and subscribe and comment my ideas if you enjoy them!

NZD/CAD LONG FROM SUPPORT
NZD/CAD SIGNAL
Trade Direction: long
Entry Level: 0.807
Target Level: 0.814
Stop Loss: 0.803
RISK PROFILE
Risk level: medium
Suggested risk: 1%
Timeframe: 12h
Disclosure: I am part of Trade Nation's Influencer program and receive a monthly fee for using their TradingView charts in my analysis.
✅LIKE AND COMMENT MY IDEAS✅

NZD_CAD LOCAL SHORT|
✅NZD_CAD price went up sharply
But a strong resistance level was hit at 0.8170
Thus, as a pullback is already happening
And a move down towards the
Target of 0.8140 shall follow
SHORT🔥
✅Like and subscribe to never miss a new idea!✅

LP usuli bilan #SellSell below the 0.81604 price level.
The position was opened too far from the zone, and the price broke through the zone with a strong impulse. This indicates that the price may have already exhausted its daily momentum, and a pullback could be expected!
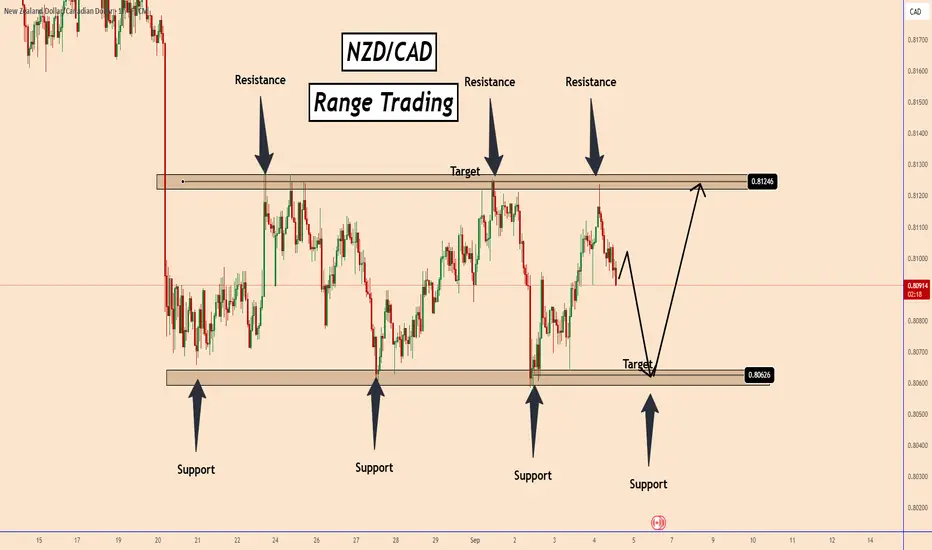
NZDCAD – Range Resistance in Play!📌 NZDCAD has been moving within a clear range structure between support and resistance zones on the 1H timeframe.
Price is now approaching the upper resistance area, where sellers have consistently stepped in to cap bullish momentum.
If this level holds, we could see a bearish reversal, driving price back toward the support zone near the lower boundary of the range.
This setup offers a classic opportunity to trade the swing from resistance back into support.
⚠️ Always remember: patience pays. Let the market come to you.
📚 Always follow your trading plan regarding entry, risk management, and trade management.
Good luck!
All Strategies Are Good; If Managed Properly!
~Richard Nasr

NZDCAD: Stuck in a Range And Showing Signs of a DropNZDCAD: Stuck in a Range And Showing Signs of a Drop
NZDCAD has been moving sideways for a while, trading between 0.8060 and 0.8125. This has created a clear range pattern.
Each time price hits the bottom of the range, it bounces up. And each time it reaches the top, it pulls back down.
Right now, the pair looks ready to move lower again. The reaction has already started, and the chart suggests a possible drop toward 0.8060.
You may find more details in the chart!
Thank you and Good Luck!
❤️PS: Please support with a like or comment if you find this analysis useful for your trading day❤️