Dollar Faces Major Golden Ratio CorrectionRecent GDP data puts the dollar into uptrend(rise from 3.3% to 3.8% ) reaching around 98.7 and hit a Major Fibonacci 0.618 Correction and Multi-month highs.
The Dollar can be expected to correct at the 0.5 ratio (around 97 ) of the recent trend along with the trendline. If the dollar sentiment is to follow the rate cuts, we will see the dollar to the downside and stocks, crypto and commodities to the upside.
The Fed has recently announce a possibility of two more rate cuts happening this year Q4 of 2025. The cut is stays at 25 bps rather than the expected 50 bps . Some investors say it is not enough to bring positivity to the market.
Traders, what are your thoughts?
Trade ideas

Bearish drop?The US Dollar Index (DXY) is reacting off the pivot which aligns with the 61.8% Fibonacci retracement and could drop to the 1st support which acts as a multi-swing low support.
Pivot: 98.63
1st Support: 96.61
1st Resistance: 100.19
Disclaimer:
The above opinions given constitute general market commentary, and do not constitute the opinion or advice of IC Markets or any form of personal or investment advice.
Any opinions, news, research, analyses, prices, other information, or links to third-party sites contained on this website are provided on an "as-is" basis, are intended only to be informative, is not an advice nor a recommendation, nor research, or a record of our trading prices, or an offer of, or solicitation for a transaction in any financial instrument and thus should not be treated as such. The information provided does not involve any specific investment objectives, financial situation and needs of any specific person who may receive it. Please be aware, that past performance is not a reliable indicator of future performance and/or results. Past Performance or Forward-looking scenarios based upon the reasonable beliefs of the third-party provider are not a guarantee of future performance. Actual results may differ materially from those anticipated in forward-looking or past performance statements. IC Markets makes no representation or warranty and assumes no liability as to the accuracy or completeness of the information provided, nor any loss arising from any investment based on a recommendation, forecast or any information supplied by any third-party.

DxyI want to see dxy to drop in price till mid of this week, in order to activate sell bias in most of Usd major pair and some cryptos

DXY to come lower then go long Clear demand zone labelled.
Clear potential FVGs need filling
Clear liquidty to target

DXY DOLLAR INDEX What is the DXY?
The DXY (U.S. Dollar Index) is a weighted index that measures the value of the United States dollar (USD) relative to a basket of six major foreign currencies: the euro (EUR), Japanese yen (JPY), British pound (GBP), Canadian dollar (CAD), Swedish krona (SEK), and Swiss franc (CHF). The euro has the largest weight in the index, around 57.6%, making it the most influential currency in the DXY.
The DXY provides a broad gauge of the USD’s international value and is frequently used by traders and analysts to assess dollar strength.
Correlation of DXY with US10Y (U.S. 10-Year Treasury Yield)
The U.S. 10-year Treasury yield (US10Y) and the DXY often have a positive correlation.
Higher US10Y usually signals stronger U.S. economic growth and/or expectations of higher Federal Reserve interest rates, making U.S. Treasury securities more attractive to investors. This leads to increased demand for USD, causing the DXY to strengthen.
Rising yields increase the return on dollar-denominated assets, attracting capital inflows and boosting the dollar’s value relative to other currencies.
Conversely, when US10Y falls, it often indicates weaker economic sentiment or looser monetary policy, which tends to weaken the dollar and lower the DXY.
Strength of the U.S. Dollar and DXY Relationship
The DXY directly reflects the strength or weakness of the U.S. dollar in the global forex market.
A rising DXY means the USD is strengthening against other major currencies, indicating increased purchasing power and greater global dollar demand.
A falling DXY implies the USD is weakening, reducing its relative value versus other currencies.
The DXY is impacted by the interest rate differentials, economic growth expectations, geopolitical events, and risk sentiment affecting capital flows in and out of the U.S.
The DXY is a key barometer for the dollar’s relative strength, and its movement often aligns with changes in US10Y due to the economic and yield attractiveness
IF THE INDEX CORRECTS IN THIS WEEKLY CANDLE EXPECT A LONG POSITION .
WATCH EURUSD,AUDUSD,GBPUSD,USDJPY.
#DXY #US10Y

dxy xau opportunity dxy looking like a long and xau will short itself to the shitter fyi thats about it cuh look at the bearish fvg and break of trend neckline that is showed with my painting skills

DXY - FROM THE WEEKLY CHART TO THE H4 CHART - WHAT TO EXPECTThe DXY Index has been going up since Jerome Powell speech after FOMC on 17 September 2025 and has continued its bullish trend since then, looking at the weekly chart this may be headind to an important resistance in the 101.395 area if the index succesfully breaks the 100.040 level of resistance, data will dictate its next move
I expect the index to test the 97.700 - 97.500 level of support early in the week and raise gradually to 100.040
Once there we have the following options:
- Poor usd data = selloff of the index on the way to the previous lows
- Strong usd data = break of the 100.040 level of resistance and the index reaching the weekly resistance 101.395
BE REACTIVE AND NOT PREDICTIVE

US Dollar Flexes, Look For on 99.05Sunday War Map –
A weekly candle this strong leaves a mark. The dollar printed a 96.77 low to 98.18 high—a full-bodied bullish bar that demands respect.
Macro
This week is stacked with U.S. data that can shake the pullback narrative:
Tue 30 Sep – JOLTS & Consumer Confidence: first look at hiring demand and household mood.
Wed 1 Oct – ISM Manufacturing PMI: factory pulse and price pressures.
Thu 2 Oct – Durable Goods & Trade Data: capital-expenditure clues.
Fri 3 Oct – Non-Farm Payrolls & Hourly Earnings: the heavyweight. A hot jobs print could delay the December Fed-cut story (futures still price ~70% odds).
Technical Targets
Expect an early-week pullback as traders digest that massive weekly bar.
Two liquidity pools we’ve tracked for months were cleared last week; two upside targets still in play 98.2 and 98.3 remain before the chart reaches a true “bearish-range discount.”
Keep eyes on the 99.05 volume node—a well-defined supply zone where cross-market reactions (EUR, gold, crypto) could spike.
The dollar controls the tempo. Wait for the market to come to your levels; don’t chase the last candle.

DXYDXY is in correction and can give us some more sideways before any push up.
Disclosure: We are part of Trade Nation's Influencer program and receive a monthly fee for using their TradingView charts in our analysis.

DXY outlook from 29th sept to 3rd oct 2025The DXY has shown signs of longs even when the FED cut rates. the last quarter may actually be bullish for the US dollar.
it has been forming large buy candles on the daily timeframe in the previous week. this may not be a sign that we are bullish but also the market has failed to close below the FVG on the weekly time frame from July ever since it traded into it.

DXYThe Dollar Index (DXY) is currently rising within a flat corrective structure. Wave C may complete around the 100 zone, which serves as a key resistance level. Once this area is reached, a strong bearish reversal could follow. Traders should be cautious of potential exhaustion in the upward move and prepare for selling opportunities once confirmation appears.

Dollar Index Holding Up But GBPUSD Might Change That...Dollar = Relative Game, Not Absolute
Dollar Index isn’t just the USD — it’s USD vs a basket (mainly EUR, JPY, GBP).
If the Fed cuts but ECB, BOE, and BOJ are also leaning dovish, the relative advantage doesn’t change; USD stays steady.
The dollar has been consolidating because macro signals are mixed (Fed easing vs US resilience, inflation uncertainty, global growth divergence), and the euro/yen/GBP balance out.
The market is waiting for a clear catalyst — usually a Fed decision, inflation report, or geopolitical shock to break the range.

$DXY longsFor next week I’ll be focusing on dollar longs since we got a 4H swing trend BOS and a lot of descending highs left open.
Favoring positions on #EURUSD and #GBPUSD.
Will keep you updated. #FOREX

DXYThe U.S. Dollar Index (DXY) maintains a bearish bias after breaking key support levels. Markets are pricing in a less aggressive Fed, mixed economic data, and rising risk appetite, all of which limit demand for the USD as a safe haven.
🔑 Key Factors
Monetary policy: The Fed no longer shows the hawkish tone of 2022–2023; rate cuts are expected in the coming quarters, reducing the dollar’s appeal.
Macro data: Inflation is more under control and signs of economic cooling → fewer arguments to keep rates high.
Market sentiment: Flows into stocks and crypto reflect greater risk appetite, reducing USD demand.
External factors: The ECB and BoJ are showing signs of tightening → the interest rate differential with the U.S. narrows, cutting the dollar’s advantage.

DXY 4H🔹 Overall Outlook and Potential Price Movements
In the charts above, we have outlined the overall outlook and possible price movement paths.
As shown, each analysis highlights a key support or resistance zone near the current market price. The market’s reaction to these zones — whether a breakout or rejection — will likely determine the next direction of the price toward the specified levels.
⚠️ Important Note:
The purpose of these trading perspectives is to identify key upcoming price levels and assess potential market reactions. The provided analyses are not trading signals in any way.
✅ Recommendation for Use:
To make effective use of these analyses, it is advised to manually draw the marked zones on your chart. Then, on the 15-minute time frame, monitor the candlestick behavior and look for valid entry triggers before making any trading decisions.

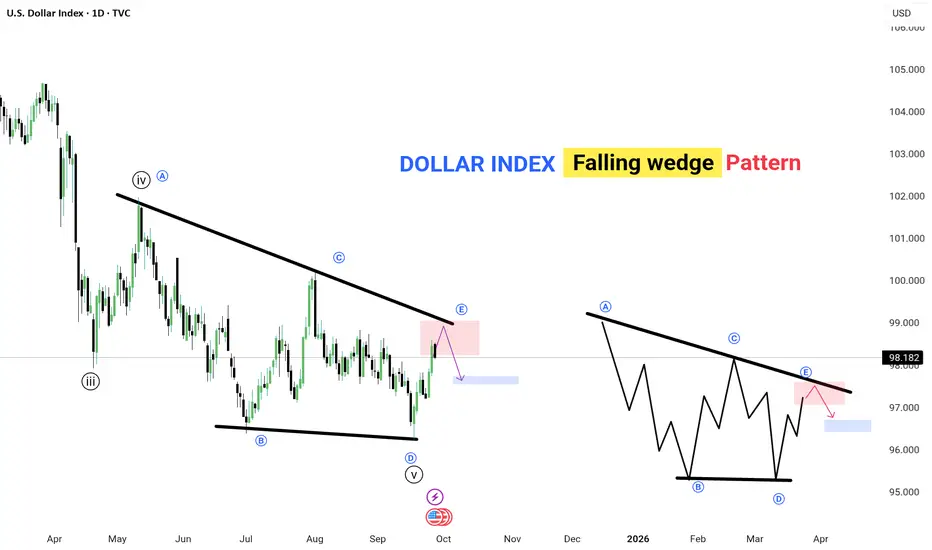
DOLLAR INDEX – Falling Wedge Pattern📉 The Dollar Index is forming a falling wedge, a classic reversal pattern.
🔹 Price is approaching the upper trendline resistance (point E).
🔹 Expect a potential pullback toward the support zone (highlighted in blue).
🔹 Pattern repeats: After E, a corrective dip is likely before the next move.
✅ Key Points:
Falling wedge usually signals trend reversal or continuation.
Watch for breakout confirmation above resistance for bullish continuation.
Current focus: resistance zone near 98–98.2, then potential drop to 96–97 support.
💡 Lesson: Patience pays — wait for clear rejection or breakout before trading this setup.
---
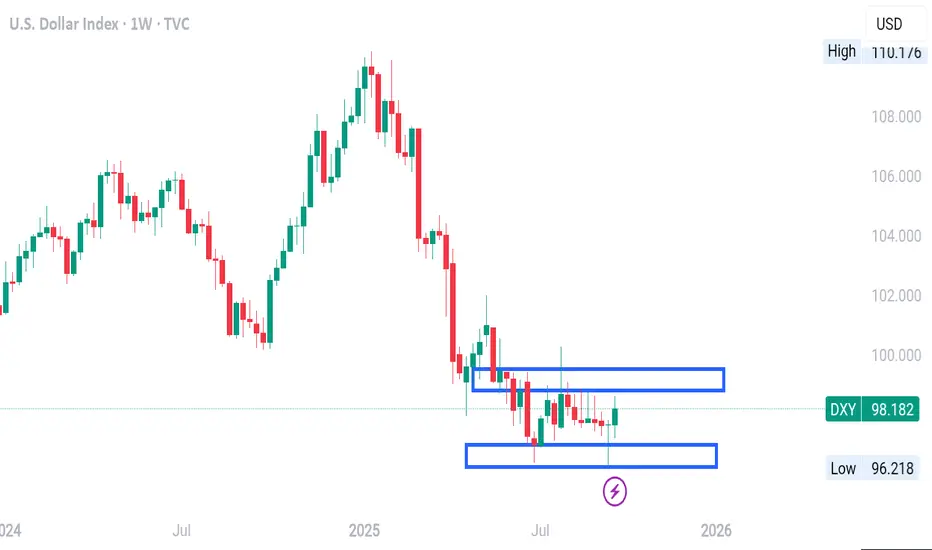
DOLLAR INDEX WEEKLY TIMEFRAME ANALYSIS Looking at the chart (USD Index, Weekly timeframe):
1. Current Context
Price has been in a clear downtrend from the highs above 110.
Recently, it has moved sideways between 96.90 – 99.30 (the two boxed ranges you marked).
Current weekly candle is green, showing a short-term attempt to bounce.
2. Key Zones
Resistance zone: 98.53 – 99.34 (upper box). Price has repeatedly failed to close above this region.
Support zone: 96.92 – 96.12 (lower box). Buyers have stepped in here multiple times to prevent deeper falls.
3. Directional Bias
Macro bias (weekly structure): Still bearish, because the overall trend is lower and price is consolidating near the bottom after a strong selloff.
Immediate/short-term bias: Neutral to slightly bullish, since the last candles show rejection of the lower end (around 97) and price is pushing back up toward resistance at 98.50+.
4. What to Watch
If price breaks and closes above 99.34, bias shifts bullish with room toward 100.95.
If price rejects the 98.5–99.3 zone again and rolls over, expect continuation lower toward 96.00 and potentially 95.30.
👉 Summary:
Bias is bearish overall, but short-term corrective bullish as price moves within the range. Directional confirmation will come only when price breaks out of either the 99.30 resistance or the 96.12 support.
DXYDXY Bearish Outlook
COT positioning confirms sellers are in control, showing bearish sentiment.
Market structure also points lower with lower highs and lower lows.
As long as this structure holds, bias remains bearish.

DXY Showing signs of strength as we can see in weekly TF price rejects this weekly area and confirms reversal through doji candle on a weekly TF fed is not supposed to cut rates in next meeting there are possibilities that dollar can regain its strength
price did not break below the previous week low..

DXY ( Doller Index ) I expect to see the dollar index begin to rise from these areas. The wave will take months, perhaps even two years, to reach the upward target

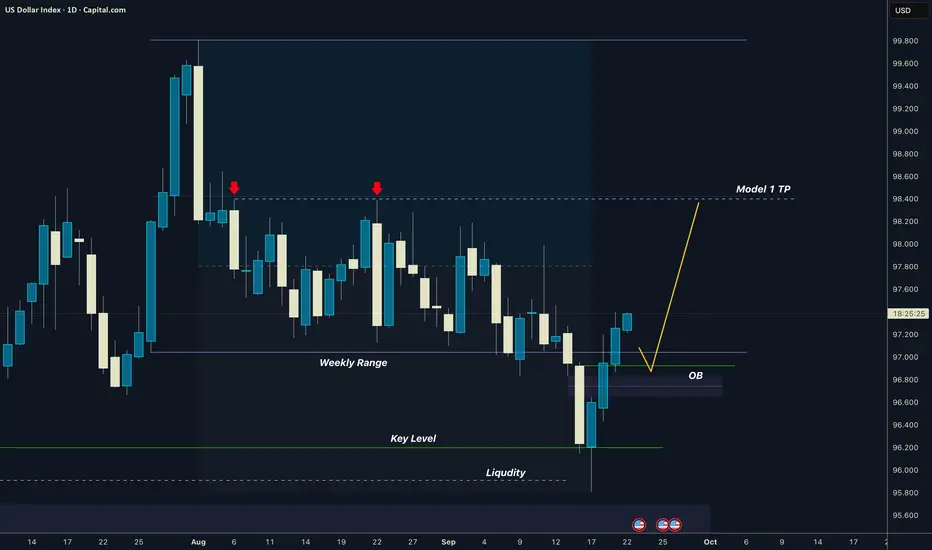
Dollar I Weekly Range I 50% Target I Model 1GM Traders, we have seen price has been accumulating thru the whole august, now it dipped bellow the range and strongly rejected and created OB. It has change to to go to 50% of that range where is doouble top liquidity which.
Have a great trading week !!
David Perk aka Dave FX Hunter
DXY (US Dollar Index) 2H chart.DXY (US Dollar Index) 2H chart, you can see my drawn a breakout setup with targets marked.
Here’s the breakdown:
Current price: ~97.42
Trendline breakout setup is shown, with bullish continuation in mind.
First target point is marked around 98.00
Second target point is marked around 98.60
✅ So the bullish targets are:
TP1: 98.00
TP2: 98.60

Dollar Index Holds Firm on Fed CautionFundamental approach:
- DXY edged higher this week amid firmer US data and cautious Fed rhetoric that tempered aggressive easing bets. Risk sentiment was mixed, with markets awaiting core PCE for policy cues, supporting the dollar on rate differentials and data resilience.
- Stronger jobless claims and an upgraded Q2 GDP print underpinned the greenback, while Fed speakers highlighted divisions over the pace of additional cuts, limiting the index's downside.
- DXY could stabilize or firm if core PCE surprises, while a soft print may rekindle cut expectations and weigh on the dollar.
Technical approach:
- DXY broke the descending trendline and retested the key resistance at around 98.60. The index is around EMA21, and it is awaiting an apparent breakout to determine the upcoming trend.
- If DXY breaks above EMA21 and key resistance at 98.60, the index may retest the following resistance at 100.
- On the contrary, failing to close above 98.60 may lead the index to retest EMA78 or the following support at around 97.15.
Analysis by: Dat Tong, Senior Financial Markets Strategist at Exness
