nasdaq buyhi evryone the nasdaq index can rise to the specifed target. please don't forget capital managment
Market insights

NDX today is the day.🚀 Today is the day that marks a before and after. ⚡️🔥
We haven’t even tasted true tech-sector FOMO yet — not even close.
Right now we’re sitting in the same extreme fear zone we saw back in early April…
and you know exactly what happened next. 😉
Google is leading the charge, showing the path the entire index is meant to follow.
And tonight, NVIDIA provides the fuel ⛽🔥
The rest of the market will move to its rhythm — like an orchestra waiting for the conductor.
Make no mistake:
🎄🚀 A massive Christmas rally is coming.
The kind that leaves you speechless.
The kind people remember for years.
The kind that turns disbelief into FOMO… and FOMO into vertical candles.
Buckle up.
The real move is just beginning. 😉
🔥🚀📈
#TechRally #NVIDIA #GoogleLeading #FearToFOMO #SantaRally #MarketShift #NextLegUp

US100 (NASDAQ) - LONG IDEANAS hit its major support level and seems to be respecting that level, NASDAQ shifted its internal structure looking good to buy at the current price. Do your own analysis before taking any trade, this isn't a financial advise.

NAS100 Trade Secured 1500 PipsSet up played out perfectly BOS on the 1h during London session, fail to sweep SSL, 5m engulfing/CISD, to target BSL/PDH


Long Opportunity on NAS100Any thought on this NAS100 setup? The double bottom was formed on 1hr timeframe and broke the neckline. Looking for the long opportunity after any confirmation of this retest at the neckline

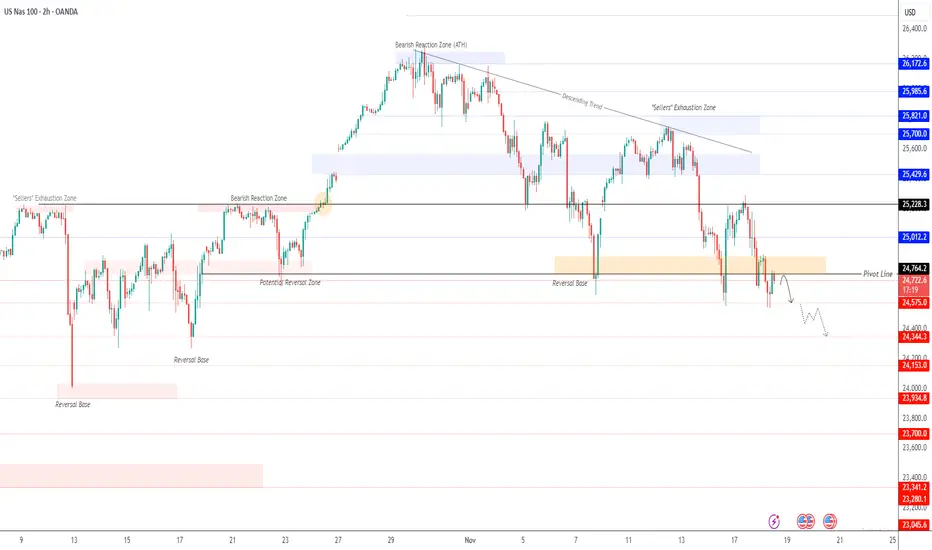
Nasdaq Slips as Traders Brace for Nvidia EarningsUSNAS100 | Overview
Traders remain firmly in risk-off mode as concerns grow over stretched AI and tech valuations ahead of Nvidia’s earnings, set for release after tomorrow’s market close.
Nvidia shares are already down about 1% in premarket trading, reflecting cautious sentiment across the tech sector.
At the same time, investors are watching for the resumption of key U.S. economic data, including the jobs report due Thursday, after recent shutdown-related delays.
There is growing worry that incoming data may discourage the Fed from delivering further rate cuts, adding pressure to equity markets.
Technically:
USNAS100 continues to trade under bearish pressure, and as long as the price remains below 24760, the downtrend is expected to continue toward 24575.
A break below 24575 would open the next bearish targets at 24340 and 24150.
To shift into bullish movement, the index must close a 1H candle above 24880, which would signal a rebound toward 25010 and 25230.
Key Levels
Pivot Line: 24760
Support: 24575 · 24340 · 24150
Resistance: 24880 · 25010 · 25230
NASDAQDO YOU KNOW WHATS BEHIND THIS OR OTHER IDEAS?? in bio..
Preferably suitable for scalping and accurate as long as you watch carefully the price action with the drawn areas.
With your likes and comments, you give me enough energy to provide the best analysis on an ongoing basis.
And if you needed any analysis that was not on the page, you can ask me with a comment or a personal message.
Enjoy Trading ;)

NAS100 Trade Set Up Nov 19 2025Price is still overall bearish on the 4h and daily but price just broke structure on the 1h so i would want to see a sweep of SSL, close above and internal IFVG/CISD to target PDH/BSL

NSDQ100 under pressure ahead o Nvidia earningsThe tech-led selloff continues to intensify, with the S&P 500 logging a 4th straight decline and NASDAQ-100 futures under pressure again this morning. The core drag remains AI valuation fatigue, with the Magnificent 7 down nearly 8% from their October highs and edging toward correction territory. Weak macro data and disappointing earnings added to the risk-off tone, pushing the VIX up to 24.7, its highest in weeks, signaling elevated demand for downside protection in mega-cap tech.
Global equities are sitting at one-month lows as investors reassess whether the massive AI capex cycle will truly deliver near-term returns. That leaves Nvidia’s earnings after the bell as the pivotal catalyst: analysts expect >50% revenue growth, but with stretched positioning and fragile sentiment, the reaction may hinge more on guidance and sustainability of data-center demand rather than headline beats.
Political noise is also picking up but has limited direct intraday impact on NDX for now. Trump’s White House meeting with Saudi Arabia and hints about his shortlist for the next Fed Chair add background uncertainty, though markets will focus more on how the Fed leadership outlook may influence the 2025–26 rate path.
Bottom line for NDX traders:
Sentiment remains fragile, volatility is elevated, and the near-term direction will heavily depend on Nvidia earnings. A strong print could stabilize AI/tech momentum; a miss or cautious outlook risks accelerating the correction in the mega-cap complex.
Key Support and Resistance Levels
Resistance Level 1: 25093
Resistance Level 2: 25290
Resistance Level 3: 25510
Support Level 1: 24278
Support Level 2: 24095
Support Level 3: 23910
This communication is for informational purposes only and should not be viewed as any form of recommendation as to a particular course of action or as investment advice. It is not intended as an offer or solicitation for the purchase or sale of any financial instrument or as an official confirmation of any transaction. Opinions, estimates and assumptions expressed herein are made as of the date of this communication and are subject to change without notice. This communication has been prepared based upon information, including market prices, data and other information, believed to be reliable; however, Trade Nation does not warrant its completeness or accuracy. All market prices and market data contained in or attached to this communication are indicative and subject to change without notice.

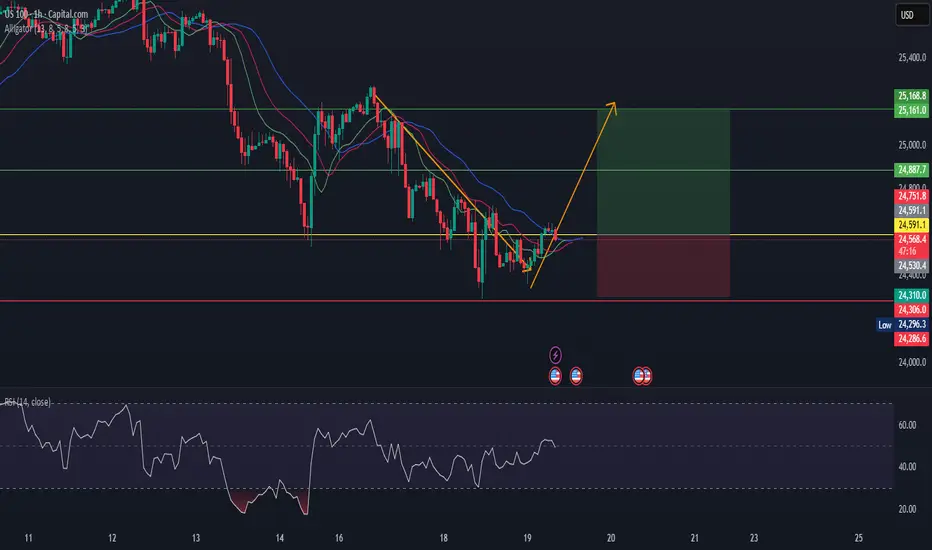
US100US100 is in reversal mode.
As per my analysis.
Alligator direction change to upward.
bullish divergence also made.
See here strong buy indicatin.
Buy at CMP.
NASDAQ 100
Sells
The market is showing clear signs of bearishness, evidenced by consecutive breaks of previous lows and sustained higher-timeframe downside momentum. With the daily timeframe continuing to push lower—breaking both the previous weekly low and the current daily low—the broader structure supports further selling pressure.
On the 4-hour (240) timeframe, momentum remains bearish, and price continues to form lower highs, reinforcing the downside bias. Although the market is currently ranging, this consolidation appears corrective rather than reversal-based. Because of this, I anticipate the market will likely continue selling, targeting lower pricing levels on the asset.

US100 – Missed Entry, but the Structure Was Perfect. Market Structure
The overall trend remains bearish. Price broke strongly below the previous Order Block, confirming sellers are still in control.
2. Order Block + Volume
The bearish OB was formed by a strong impulsive candle with high volume — a clear footprint of smart money. Price retraced but missed the entry zone by just a few points.
3. Liquidity
Before the major drop, price swept the liquidity above and instantly reversed. A classic pattern: liquidity grab → OB retest → sell-off.
4. Retest Logic
Even though the entry was missed, the V-Shark OB structure remained perfectly valid. When you follow the right logic, another opportunity always comes — no need to FOMO.
Conclusion
A missed entry doesn’t mean a bad analysis. It simply means the market didn’t offer the exact fill. Discipline over impulse — always.
Disclaimer
For educational purposes only. Not financial advice.
#VNShark #VSharkOB #OrderBlock #SmartMoneyConcept #PriceAction #Volume #Liquidity #US100 #NASDAQ #TradingView

Market Watch: NASDAQ at a Critical JunctureToday, all eyes are on the NASDAQ as we head into a key earnings release. The index is approaching a pivotal short-term level — the 55-day moving average at 24,091, which aligns closely with the August high of 23,969. With the daily RSI nearing oversold territory around 30, there's a strong chance this level could hold on the initial test.
But here's the catch: the weekly chart is flashing warning signs.
🔍 The weekly RSI has already topped out, suggesting momentum is fading. If the 55-day MA doesn't hold, we could see a deeper pullback toward the 55-week moving average at 22,035, which also aligns with the late 2024 high of 22,222.
This level could be the litmus test for the broader bull trend. A weekly close below it would be a major technical breakdown — and let’s not forget, the NASDAQ often leads the S&P.
Stay sharp. The next few sessions could be decisive.
Not trading advice

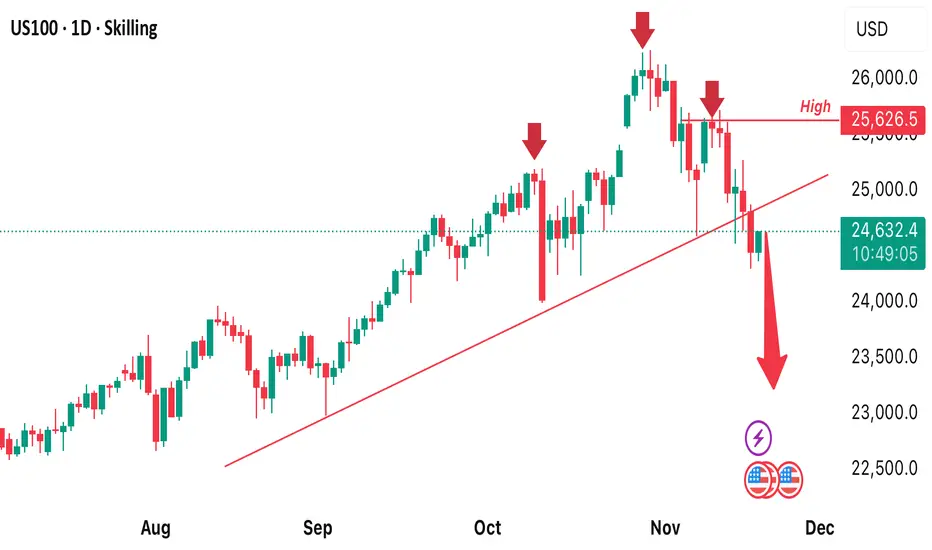
US100 DAILY CHARTNASDAQ100 has a tendency to make a new low. We can see how price has been bearish for couple of days now. I expect price to drop lower therefore, a sell opportunity is envisaged
NAS100 – Bullish Shift After LL → HL Structure Change (15M)
Price created a final Lower Low (LL) followed by a clean Higher Low (HL), signaling the start of a trend shift.
Market broke short-term structure with a fresh Higher High, confirming bullish intent.
EMAs are compressing and starting to fan upward, showing building momentum.
RSI is trending above the mid-line, supporting continued upside pressure.
A small FVG (Fair Value Gap) below may act as support if price retests.
Trade Plan
Buy Zone: 24,600 – 24,630
Take-Profit (TP): 24,783.3
Stop-Loss (SL): 24,548 – 24,566 (below FVG + EMA cluster)
Why This Setup Makes Sense
Clear structure transition from bearish to bullish.
Fresh HH confirms continuation potential.
EMAs aligned upward with improving momentum.
Clean upside liquidity target at 24,783.
Invalidation
Break and close below 24,548 invalidates the bullish structure.

NAS100 Algo-Driven Breakout & Volatility Matrix# 🚀 NAS100 19th Nov 2025: 🐂 Algo-Driven Breakout & Volatility Matrix 📊
Asset Class: NAS100 (CFD SPOT) | Price: 24,472 | Time: 10:25 AM UTC+4
Executive Summary
Bias: 🐂 Bullish Continuation / Momentum Breakout
Signal: 🟢 Long on Consolidation Break
Confidence: ⭐ High (Volume Confirmation)
Technical Analysis Methodology
Trend: The macro structure remains strongly bullish with price action respecting the ascending channel on the 4H timeframe. Intraday (15m/1H) reveals a Bullish Pennant contracting near all-time highs. 📈
Momentum: RSI (14) hovers at 58.0, indicating room for upside expansion before reaching overbought territory. ⚡
Volatility: Bollinger Bands are squeezing on the 1H chart, a precursor to a high-volatility expansion. VWAP is currently at 24,450, acting as dynamic support. 🌊
Patterns: A Cup and Handle formation is visible on the 1H chart, with the handle currently testing the 24,450 support zone. A successful breakout targets the 24,600 psychological barrier. ☕
Key Levels
🛑 R2: 24,650 (Fib Extension 1.618)
🚧 R1: 24,580 (Recent Swing High)
📍 Pivot: 24,472 (Current Price / POC)
🛡️ S1: 24,420 (EMA 50 / Handle Low)
🧱 S2: 24,350 (Key Structural Support)
Actionable Trade Plan
Strategy: Momentum Breakout & Trend Continuation 🚀
Entry 1 (Breakout): Buy > 24,510 (Volume Confirmation)
Entry 2 (Pullback): Buy @ 24,425 - 24,440
Stop Loss: 24,380 (Below S1/Invalidation Point)
Take Profit 1: 24,580 🎯
Take Profit 2: 24,640 🎯
Disclaimer: Trading involves risk. This analysis is for educational purposes only.
AI-bubble fears dragged USTEC lower.
Alphabet (GOOGL) CEO Sundar Pichai added to the cautious mood, noting that the current AI boom shows signs of irrationality and warning that no company would be immune if the bubble bursts.
Meanwhile, ADP data showed private-sector jobs falling by roughly 2.5k per week over the four weeks to Nov 1, fueling worries about a labor-market slowdown. Fed Governor Waller reiterated his support for a December rate cut, citing ongoing softness and stagnation in the labor market.
This week’s NFP release may shape expectations for further Fed easing and add to market volatility.
USTEC extended its downtrend, breaking below 24525. The diverging bearish EMAs indicate a potential expansion of the bearish structure.
If USTEC breaks below 24300, the index could decline further toward the next support at 24000.
Conversely, if USTEC closes back above 24525, the index may advance toward the next resistance at 25200.

NASDAQ Signal : US 100 H1 / H4 : long !!!Hello Traders! 👋
What are your thoughts on NASDAQ ?
This correction could offer a buy-the-dip opportunity, with potential for a move back toward the recent highs.
NASDAQ ( US100 ) :
Market price : 24400
Buy limit 1 : 24200
buy limit 2 : 24000
Tp1 : 24600
Tp2 : 25000
Tp 3: 25700
Tp 4 : 26300
SL : 23700
Traders, Don’t forget to like and share your thoughts in the comments! ❤️
Remember this is a position that was found by me and it is a personal idea not a financial advice, you are responsible for your loss and gain.

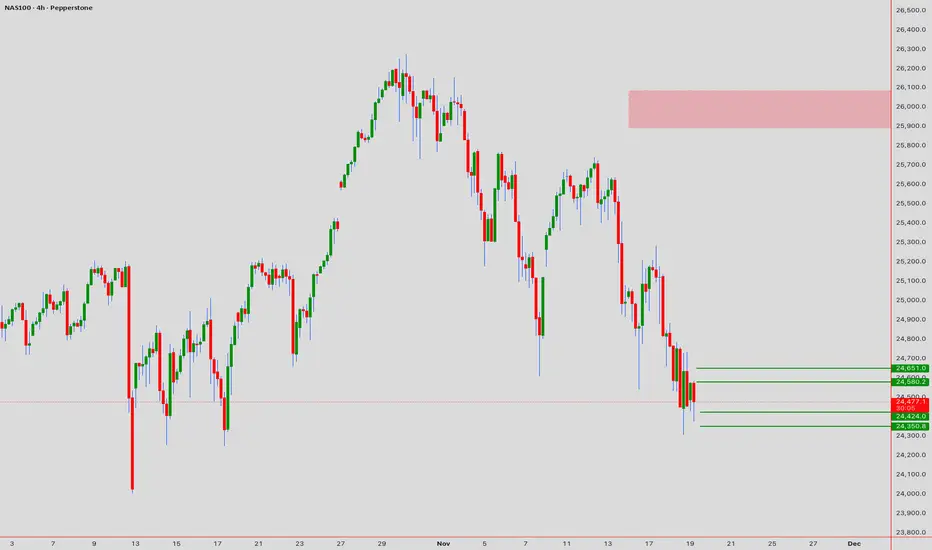
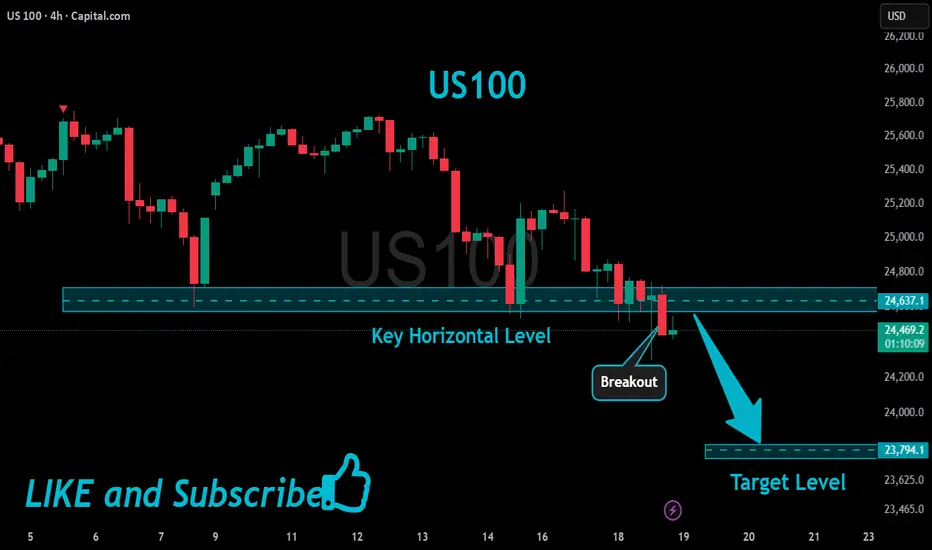
US100 Will Keep Falling!
HI,Traders !
#US100 keeps falling down
And made a strong
Bearish breakout of the key
Horizontal key level of 24637.1
And the breakout is confirmed
So we are bearish biased and
We will be expecting a further
Bearish move down !
Comment and subscribe to help us grow !
Double zig-zag wavecountThe wavecount may be wrong, but I think we are still in wave Y. Maybe it will reach 24300 in it's final move down. Anyway it doesn't look like a reversal, this decline looks corrective.

US100 Resistance Cluster!
HI,Traders !
#US100 made a bullish
Rebound But has now Near hit a resistance
Cluster of the horizontal and
Falling resistance lines
Around 25395.4 area From where we will be
Expecting a bearish move down !
Comment and subscribe to help us grow !

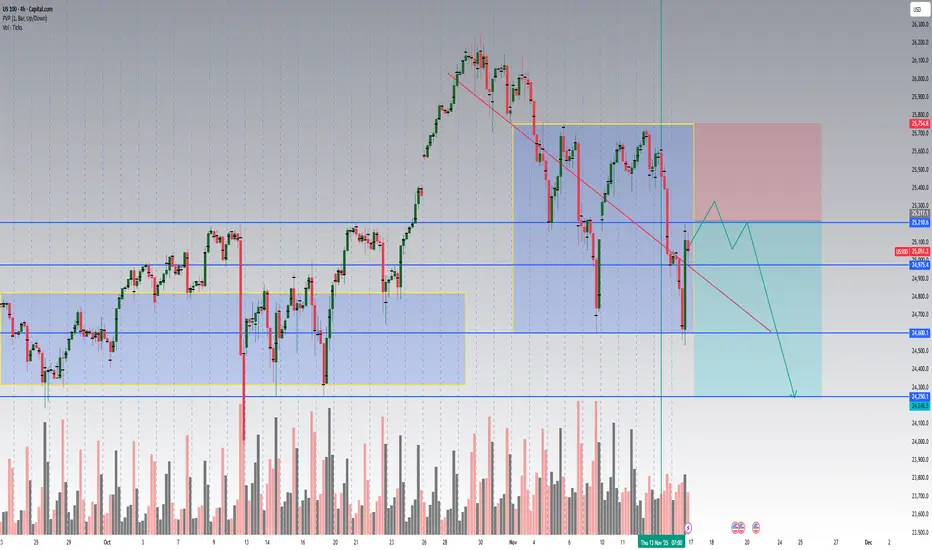
US100 Technical Outlook: Bearish Pullback Inside a Key LiquidityHey traders 👋
The US100 (NASDAQ 100) is currently sitting in a very interesting technical position on the 4-hour chart.
Let’s break it down 👇
🧭 Structure Overview
After a strong bullish leg that peaked near 25,800, the index entered a descending corrective channel.
We’ve now hit an important support cluster around 24,975 – 25,000, which previously acted as a pivot zone.
I’ve mapped two main liquidity boxes (blue & yellow) that show where buyers and sellers built positions during the last phases of consolidation.
Notice how price rejected from the upper boundary of the yellow box twice — confirming short-term supply pressure.
📊 Volume Analysis
Volume has been elevated on each red candle, confirming that this down-move isn’t just a retracement without conviction.
However, the most recent bar shows a strong bullish reaction on higher volume, indicating potential absorption — smart money may be defending the 25K handle.
If we see declining volume on the next two green candles → likely dead cat bounce.
If volume expands again above 25,200 → we might get a break and retest of the red trendline for a short-term continuation toward 25,600–25,750.
🧱 Key Levels
Zone Bias Comment
25 210 – 25 220 Resistance Prior liquidity flip zone, possible rejection area
24 975 – 25 000 Current support Reaction zone, watch for confirmation candle
24 600 Target 1 Measured-move projection
24 250 – 24 300 Target 2 Major daily demand zone / possible higher-low base
🔻 Bearish Scenario (Primary Plan)
Short bias remains valid below 25 210.
Expect a short-term bounce into 25 100–25 200, then rejection.
Targets: 24 600 → 24 250.
Invalidation: close above 25 220 on strong volume (would flip the structure bullish).
🟢 Bullish Alternative
If bulls can close a 4H candle above 25 210 – 25 220 with confirmed volume > previous red bar,
the down-channel breaks, and we may see a fast rally back to 25 600 – 25 750.
⚙️ Strategy Note
This chart is for educational & analytical purposes — not financial advice.
I’ll update if we get confirmation on the next 4-hour candle.
👉 Follow for updates and let me know your view — will the 25K zone hold or break next week?
📅 Summary
Trend: Medium-term uptrend, short-term correction
Bias: Bearish below 25 210
Setup: Channel rejection → continuation toward 24 600 / 24 250
Risk: Volume-based breakout above 25 220
Hit 👍 and follow if you found this breakdown helpful — I post detailed NAS100 / SPX / DAX updates every week with volume-based setups.
Let’s grow the community together 🚀
Would you like me to format it with hashtags and keyword tags (so it ranks better in TradingView search, like #US100 #NASDAQ #TechnicalAnalysis #PriceAction #VolumeProfile)? I can add that next.