US100 trade ideas

NAS SellsNAS - price broke through that last low that was created with momentum pushing past the lowest point (17790) before the highest point (18498) was reached.
That would signify a CHoCH and we are continuing a bearish outlook.
With ICC, after a new low is made in the market (Indication) we can expect a pullback/retracement (Correction), before the continuation.
We will be looking for sells under the 17880 area to the recent lows created (after the correction is completed)

4/16/2024 Nasdaq PerspectivePOI areas for today. I'm waiting for price to take liquidity and react to these areas. I shall personally take entries dependent on how price reacts in these zones. If price takes liquidity on the 1m timeframe in any area and shoots towards a POI, then that POI is more then likely invalidated. If price slows down before reaching a POI, then it's more then likely valid. Trade at your own risk. Good luck today!
Overall predicted move for the day: Bullish

Corrective pattern of wave degree? or a wave higher then correctEsteemed analysts and traders,
I hope this correspondence finds you in good health and high spirits, prepared to tackle the upcoming week with renewed energy. I extend my best wishes for your continued success in all your business endeavors. It is worth noting that success in trading is largely dependent on the consistent definition and adherence to one's own rules.
As a supporter of the Elliott Wave Principle, I consider this methodology an invaluable tool for market analysis. After three years of personal experience, I have developed my approach by combining this principle with meticulous consideration of different market scenarios. I strive to avoid market surprises by maintaining a range of market prospects, which enables me to recognize the market structure forming with 100% accuracy.
I am pleased to share my analysis with you, with the caveat that I do not provide buy or sell signals. My perspective on idea analysis is entirely impartial, and if my analysis meets your standards, it may serve as a guide to making an informed decision.
For your reference and comparison, I have attached my previous analysis of the same market. All the details of my analysis are clearly labeled for ease of comprehension. Nonetheless, familiarity with the Elliott Wave Principle theory would facilitate an understanding of the analytical idea.
My study of the Elliott Wave Principle took nearly three years, during which my understanding and experience with this invaluable tool have grown. My progress thus far is a testament to the legacy of Ralph Nelson Eliot, whose genius has provided the foundation for my achievements. May he rest in peace.
I express my gratitude for your continued support and kindness, and welcome your comments and critiques.
May my analysis be a valuable asset to your business journey, and I remain sincerely yours,
Mr. Nobody

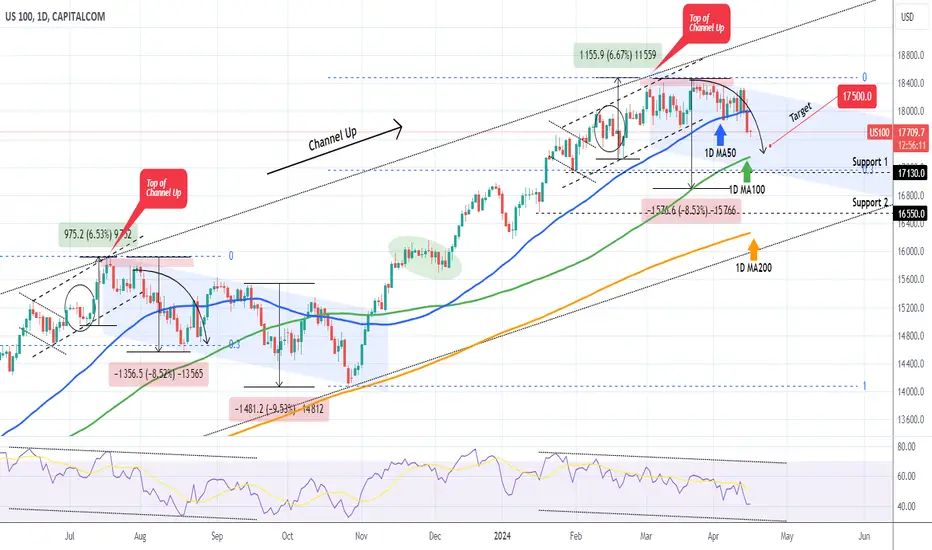
NASDAQ Emphatically below its 1D MA50 after +5 months!Nasdaq (NDX) is on the pull-back process, a correction that we called on our March 12 idea (see chart below) when the index reached the top of its 1 year Channel Up:
Even as recently as last week (see chart below) we called for the ideal sell entry and set a 17500 Target:
As you can see, the index emphatically broke and closed below the 1D MA50 (blue trend-line) yesterday for the first time in more than 5 months (April 04 also closed below it but only marginally). That is technically as strong bearish break-out signal.
The idea now is that we want the index to hit the 1D MA100 (green trend-line), which has been intact since November 06 2023, see how the market reacts and then determine if that is a low or not. Technically if it replicates the August 18 2023 Low, we should be expecting a Low on the 0.3 Fibonacci retracement level at 17,150 at least, which also happens to be just above Support 1.
The decline on the Aug 18 2023 Low was of the -8.52% magnitude, so that gives us a 16900 downside limit. We don't expect the pull-back to go that low though this time. A fair bottom signal can be when the 1D RSI hits 35.00 or the bottom of its Channel Down, similar to what took place on August 18 2023.
-------------------------------------------------------------------------------
** Please LIKE 👍, FOLLOW ✅, SHARE 🙌 and COMMENT ✍ if you enjoy this idea! Also share your ideas and charts in the comments section below! This is best way to keep it relevant, support us, keep the content here free and allow the idea to reach as many people as possible. **
-------------------------------------------------------------------------------
💸💸💸💸💸💸
👇 👇 👇 👇 👇 👇
Correction just around the cornerThese curves look very similar to previous occasion as in start of 2022. There might be new ATHs still, but rough near months may be ahead.

NAS100 MORE SELLS FOR BUY ATTEMPTSNAS100 gave a beautiful push to the downside after triggering the sell limit shared last week. The 4H SC area from yesterday's NY session looks juicy for sells to take her lower.
Price is currently close to tapping the 4H imb, a pull back off that imb towards the sc during london for sells during NY would be ideal.

Bullish trend continues for NAS on HTF
On Weekly timeframe , NAS is in a solid Bullish trend and seems to be forming an ABCD pattern with D point projection at 20500.
As per Seasonal bias of NAS, it is bullish 6/9 times in MAR, 7/9 times in APR (current month) and 6/9 times in MAY so we can expect the Bullish trend to continue.
Overall, if we combine Weekly timeframe analysis and Seasonal bias, it looks like NAS will continue the bullish rally till July 2024.
And for now, its making a Retracement and the two levels to watch are 17430 and 16785.
Let's see how it goes.
Follow your Strategy and Risk Management plan, All the best!
~ Usama

NAS makes a Retracement within the Bullish trend
On Daily timeframe , NAS is making a retracement within Bullish trend. The key levels to watch are 17430 (0.236 Fib) and 16785 (0.382) . When we observe this Bullish trend that started in NOV 2023, every retracement is around the 0.236 Fib level so this it is highly likely that if retracement is to be made, it is made from this level.
On 4hr timeframe , the price was sideways moving in an Horizontal channel and yesterday (APR 15), it breaks out the channel bottom with a strong momentum. The channel lasted about 45 days.
Let's see how it goes.
Follow your Strategy and Risk Management plan, All the best!
~ Usama

NAS100 so today 4/15/16 i predicted price on the 1min tf, about coming to this small area to mitigate the last area of liquidity, and was respected with a 2 pip stoploss, now im expecting a one last touch before heading back up, all technical analysis

NAS100 Weekly Analysis 4/15 4/15 @ 7:09 pm EST
1. Beach Levels
M 7/8 17500
W 6/8 17500
D 5/8 17812.5
4H -1 17734.4
1H -1 17734.4
M30 -1 17734.4
2. Waves
Day: OS Selling
4H: OS Selling
1H: OS Buying
M30: OS Buying
3. Channels
M- Bullish; Near top
W- Bullish; Respected top heading to middle
D- Bullish; B/o downside w r/t
4H- Bearish; Below
1H- Bearish; B/o downside
M30- Bearish; Below
4. Fib
Day Buy Zone
50 @ 16240.7
61.8 @ 15738.9
4H Buy Zone
50 @ 17366.6
61.8 @17103.3
M30 Sell Zone
50 @17944.3
61.8 @17999.5
Price finally broke out of consolidation/below the 4H floor so looking for a nice move to the downside at least to our 4H buy zone or as far down as our day buy zone. Due to waves being OS on lower TF, looking for the price to pull back before continuing with the sell. Looking for price to pullback to M30 golden zone (17944 area)/ top of M30 channel. Once in that zone wait for sell confirmations before entry. Possible sell TPS after pullback @17890 @17812.5 @17734.4 @17679.
If price breaks below 17670, look for sells to @17625 @17565 @17500.
If price breaks above last high/above 18195, look for buys to @18250 @18281.3 @18335 @18415
Opinion: This analysis is for education purposes only and is just my opinion, this is not a trade idea.


Nasdaq Daily Log ChartWhat to do once you realize the CORRECTION has STARTED?
You should know this BEFORE you enter the trade.
#nasdaq #spx #spx #bitcoin

📈 Nasdaq Turns Bearish | Keeping It SimpleHello amazing trader —you are GREAT!— how are you feeling today?
Here we have the Nasdaq (NDX) chart and this chart has something to say.
We will keep it simple because we think simple is best.
➖ Bearish harmonic pattern
👉 We have a rounded top and a top leads to a drop!
Support targets:
1) Around 16,500
2) Near 15,400 with a wick lower.
3) Going for 14,480 and this is a strong support.
We wait for #3 and see how it goes.
It can go lower of course but that one is a strong support.
We go step by step.
Namaste.

NASDAQ is officially Bearish...OANDA:NAS100USD
NASDAQ is officially Bearish...
NASDAQ & NQM is way overdue for a massive correction down
to 16419... I think...

NAS 100 SHORTThe Sell Side of the Market Maker Pattern has begun. Time to take advantage and ride the trend down.

Nasdaq 2024 GuideBeen a long time since I posted! Firing it up with my bigger-picture view of the Nasdaq.
Longer timeframe: Multi-year cup and handle - bullish into year-end
Shorter timeframe: Rising wedge - potential window of weakness around the corner (end of Feb?)
What's actionable about this chart?
- If actively trading watch for a short-term sell signal - close below the wedge/below the prior day/week low depending on your time frame
- Sell/trim into strength around 18k (top of the rising wedge)
- If there's a retest of the multi-year breakout that is a great r/r add/buy spot into year-end
- Fib extension from the 2022 low to the 2021 high measures to 20,650
- A break below 16k would put the bullish year-end thesis at risk
- This chart should have ZERO influence on individual stocks that are set up differently - follow your system
Like the post for more / comment on what you'd like to see more of.
Thanks for reading!

Bullish Divergence for Quick ProfitsWe're attempting to capitalize on a bullish divergence in the Cumulative Delta to capture a rebound following today's significant sales.
This is a trade with a short-term time horizon.

NASDAQ HAS NOW HIT THE LAST TARGET1
2
3
I'm the best, when i was analyzing nasdaq100 3/3 weeks ago, i did not think it will go this far

US 100 - Ranges overview We've gotten a nice big range this Monday to start the week and we've just taken the sellside liquidity.
You can see how the breaker (red box) acted as inverted FVG and sent prices lower today.
IF you weren't able to take any trade or had issues with your trading today don't worry... tomorrow is another day
For all those who managed to ride the wave or take scalps make sure to stick to your risk management and don't get overzealous
Personally taken a scalp long on US 100 from 17931 to 17958.
Entry 17931
TP 17958
SL 17908
Don't run after the MARKET and LET IT COME TO YOU.
Stay safe and never risk more than 1-5% of your capital per trade. The following analysis is merely a price action based analysis and does not constitute financial advice in any form.

nas 100We are still in a scalp correction process and we have the possibility of further correction and return to our second entry point. Profit and TP were saved from the first entry point. We are with the continuation of the correction process.

Nasdaq Pair : NASDAQ
Description :
Rising Wedge as an Corrective Pattern in Long Time Frame
RSI - Divergence
Break of Structure
Completed " 12345 " Impulsive Waves and " ABC " Corrective Waves
Resistance Level
