US100 trade ideas

SELL NASDAQAs you can see the market gave us a BB and confirmed the short move, you can sell and set tp and SL as sat on the chart.
Follow for more.

What if it all ends up dovish?
Fundamentals & Sentiment
NASDAQ100:
- Nvidia holds a strong uptrend
USD:
- Yields & USD are underperforming from yesterday
- The upcoming CPI consensus is lower than the previous
Technical & Other
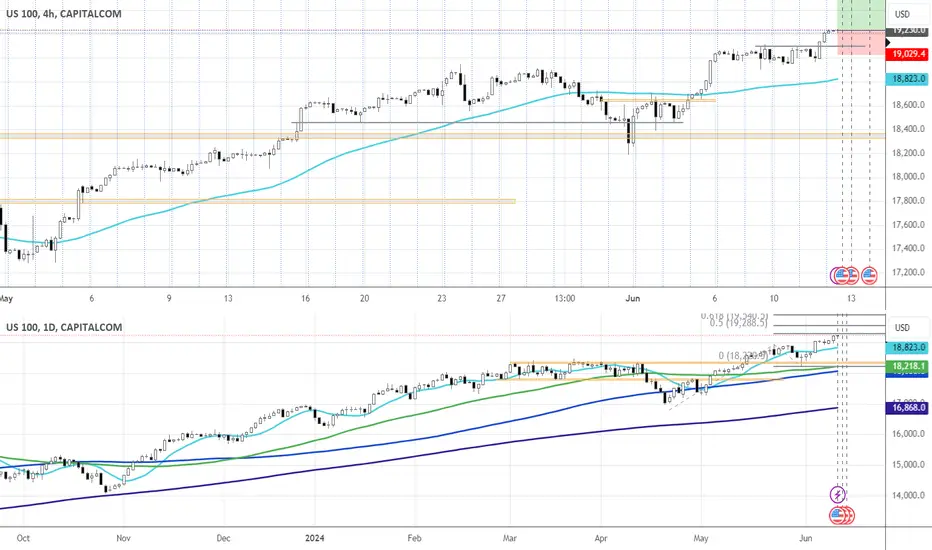
Setup: TC(B)
Setup timeframe: 4h
Trigger: 4h
Medium-term: Up
Long-term: Up
Min target: Fib ext
Risk: 1.04%
*Pretty wide SL as I expect attempts to flush out buyers before CPI release/ heightened volatility at the release. If CPI is at least in line with consensus, I'll keep holding into FOMC. I might hold into FOMC only in case of gains at least 0.5R prior to the event.
US_ Nas_ 100 _ Futures _ Distribution _ Prices _ For _ Quarter 4US_ Nas_ 100 _ Futures _ Distribution _ Prices _ For _ Quarter 4 _ 2024.
I will be calculating 25 years Economy cycle!
$21,073.9
$21,145.1
$22,460.8
$23,898.8
$24,932.4
$28,227.4
$31,623.6
$32,290.6

SELL NASDAQIn the morning I posted to buy NASDAQ, and while waiting for the market to reach our entry it turned out to make us a BB and now we're getting in a short trade.
Follow for more!


US100RSI indicates Bearish Divergence. Which means that at any time the market trend can change to LL and LH.

BUY NASDAQYesterday I posted to buy it but the market didn't reach our BISI so we was forced to enter at a higher price after the news release.
You can set your entry now, SL and TP as sat on the chart.
For further questions, the comments are all yours!
Follow for more!


NAS100 FORECAST
Overview:
- Current Price: 19019, slightly down by 0.11% (-20.2 points).
- Price Action: The index has been in an uptrend since early May, with a recent consolidation phase.
Key Observations:
1. Trend:
- The overall trend is bullish, with higher highs and higher lows forming since early May.
- There was a significant upward movement around mid-May, followed by a correction and another upward push in early June.
2. Recent Price Movement:
- After reaching a high around 19050, the price has pulled back slightly and is currently consolidating just below this level.
- The consolidation near the highs indicates a potential continuation pattern, suggesting that the market might be gathering strength for another move higher.
3. Bearish and Bullish Levels:
- Resistance: The recent high around 19050 is acting as a resistance level. A breakout above this level could signal further bullish momentum.
- Support: The previous swing low around 18600 can be considered a key support level. If the price breaks below this level, it could indicate a potential trend reversal or a deeper correction.
4. Volume and Volatility:
- The chart does not show volume, but the recent price action suggests that volatility has been relatively low in the consolidation phase. Traders will likely watch for an increase in volume accompanying a breakout or breakdown to confirm the move.
Potential Scenarios:
1. Bullish Scenario:
- If the price breaks above the resistance at 19050 with strong momentum and volume, it could continue the uptrend, targeting new highs.
- In this case, the next psychological levels to watch would be around 19100 and 19200.
2. Bearish Scenario:
- If the price fails to break the resistance and falls below the recent consolidation low around 18900, it could signal the start of a correction.
- In this scenario, the next support levels to watch would be around 18700 and 18600.
3. Sideways Movement:
- The price could continue to consolidate between 18900 and 19050, indicating indecision in the market.
- Traders might wait for a decisive breakout or breakdown from this range to determine the next significant move.
Conclusion:
The US NASDAQ 100 index is currently in a bullish trend with a consolidation phase near recent highs. A breakout above 19050 could continue the uptrend, while a breakdown below 18900 might lead to a correction. Traders should watch for volume and momentum to confirm any potential moves.

Long on NAS100. NFP dayNAS has been on a bull run since beginning of the week. a big drop to the downside perceived to be manipulation to pull liquidity and buy at a better price. let's see how it goes
happy and safe trading everyone!!

Targeting All Time HighsLooking to potentially potentially print all time highs again after breaching Mays highs whilst using bullish arrays support price above said level

flat to bullishIm expecting a long move for this monday. yet the week is full of big news, starting with nvda split, which i believe is a buy buy buy more.
then FOMC on wednesday. this as always can make an slow start.


NASNAS100 is in strong bullish trend, most probably chance price will continue it's momentum as price respected the support.

BACK TESTING 23 BEARISHTHERE WAS GAPS IN THE MARKET THAT NEEDED TO BE filled and usually all gaps get filled. this video display a misread in the market because the liquidity was filled despite the gaps. so it came and retested previous low and bullish back to the previous high. wrong analysis

back testing 24 bullishthe market was on a bullish creating new highs, also leaving gaps within the market and as taught by my mentor all gaps must be filled. eventually i knew the market will bearish, but the current trend was upward establishing new highs in the market before it filled the liquidity.

NAS100 Retested from the important support zone1. NAS100 Retested exactly from the support and trendline Liquidity.
2. Now its almost reaching the resistance zone.
3. Once its reached from the resistance we have to wait for a break or retest.
Please follow and support for more updates.

idea to be long in us100 nasdaq 60 % probabilityWe have the original bullish trend and the price is giving us signs of going long in very important areas and today we also have important news

NASDAQ100 INDEX - 4h Technical analysisThe current short-term bullish acceleration on NASDAQ100 INDEX should quickly allow the basic trend to return to bullish. To avoid contradicting the short term, traders may prefer long positions (at the time of purchase) as long as the price remains well above 18,433.66 USD. Short-term buyers will use the resistance located at 18,677.55 USD as an objective. A bullish break in this resistance would boost the bullish momentum. The next bullish objective would then be set at 18,818.44 USD. Crossing this resistance would then open the door for buyers to target 19,062.33 USD. Caution, if there is a return to under 18,433.66 USD, it should not be forgotten that the basic trend is not yet clearly defined. Beware of against the trend sellers, many of whom will certainly benefit from this movement.

Will Nasdaq repeat a measured moveFrom the look of things Nasdaq might just be heading to complete a second leg of a simple measured move.... which will plunge into the 20,000 levels

US 100 Cash CFD _ Under _ Trading _ Venue _ FOREXCOM.US 100 Cash CFD _ Under _ Trading _ Venue _ FOREXCOM.
Advance Stage support is not yet confirmed until we get 1 further support and 2 Retest.
Next retest must hold within the key level of $18,960.8
____________________
Then next ext prices:
$19,120.4
$19,449.7
$19,669.1
$19,797.4
$20,063.4
$20,289.9

