Nasdaq-100: Entry Setup & Pullback in 2026?US100 / Nasdaq-100 long 📈 – today looks like a solid entry opportunity. The volume pool at the ATH from October 30, 2025 is already waiting for me 😏
If I take a bit of a risk, I’d say a short-term dip below 24,500 is possible. For me, though, it’s more likely after checking out the ATH zone, so I see it as a possible scenario for next year. Really excited to see how it plays out!
Happy holidays, everyone! 🎄✨
Market insights

US100 My Opinion! SELL!
My dear subscribers,
US100 looks like it will make a good move, and here are the details:
The market is trading on 25354 pivot level.
Bias - Bearish
Technical Indicators: Both Super Trend & Pivot HL indicate a highly probable Bearish continuation.
Target - 25068
About Used Indicators:
The average true range (ATR) plays an important role in 'Supertrend' as the indicator uses ATR to calculate its value. The ATR indicator signals the degree of price volatility.
Disclosure: I am part of Trade Nation's Influencer program and receive a monthly fee for using their TradingView charts in my analysis.
———————————
WISH YOU ALL LUCK

US100 Free Signal! Sell!
Hello,Traders!
US100 taps into a well-defined horizontal supply zone after a strong bearish displacement, confirming smart money distribution. Price failed to reclaim the supply cluster and is now respecting bearish order flow, with downside liquidity resting below recent lows.
--------------------
Stop Loss: 25,283
Take Profit: 24,891
Entry: 25,123
Time Frame: 4H
--------------------
Sell!
Comment and subscribe to help us grow!
Check out other forecasts below too!
Disclosure: I am part of Trade Nation's Influencer program and receive a monthly fee for using their TradingView charts in my analysis.

US NAS 100DO YOU KNOW WHATS BEHIND THIS OR OTHER IDEAS?? in bio..
Preferably suitable for scalping and accurate as long as you watch carefully the price action with the drawn areas.
With your likes and comments, you give me enough energy to provide the best analysis on an ongoing basis.
And if you needed any analysis that was not on the page, you can ask me with a comment or a personal message.
Enjoy Trading ;)

NASDAQ Awaits Breakout After Support ReboundUSNAS100 – Technical Overview
The price recently reached the 24820 support zone and rebounded exactly as expected.
At the moment, the market is trading in a short-term bullish correction phase, with upside potential toward 25420.
To shift into a full bullish structure, the price must break and close above 25420, which would open the path toward:
→ 25570 → 25830
However, if the price fails to hold above 25100, the bearish scenario will reactivate, targeting:
→ 24820 → 24570
Volatility may remain elevated following the recent macroeconomic releases.
Pivot Line: 25210
Resistance: 25420 · 25570 · 25830
Support: 25100 · 24820 · 24570

Potential bearish drop?US100 has broken through the resistance level, which is an overlap resistance and could drop from this level to our take profit.
Entry: 25,247.45
Why we like it:
There is an overlap resistance level.
Stop loss: 25,543.25
Why we like it:
There is a pullback resistance level.
Take profit: 24,485.92
Why we like it:
There is a pullback support level that aligns with the 78.6% Fibonacci projection.
Enjoying your TradingView experience? Review us!
Please be advised that the information presented on TradingView is provided to Vantage (‘Vantage Global Limited’, ‘we’) by a third-party provider (‘Everest Fortune Group’). Please be reminded that you are solely responsible for the trading decisions on your account. There is a very high degree of risk involved in trading. Any information and/or content is intended entirely for research, educational and informational purposes only and does not constitute investment or consultation advice or investment strategy. The information is not tailored to the investment needs of any specific person and therefore does not involve a consideration of any of the investment objectives, financial situation or needs of any viewer that may receive it. Kindly also note that past performance is not a reliable indicator of future results. Actual results may differ materially from those anticipated in forward-looking or past performance statements. We assume no liability as to the accuracy or completeness of any of the information and/or content provided herein and the Company cannot be held responsible for any omission, mistake nor for any loss or damage including without limitation to any loss of profit which may arise from reliance on any information supplied by Everest Fortune Group.

NASDAQ100 Technical Roadmap for Swing Traders📈 NASDAQ100 Bullish Swing Setup — Pullback to Power Move?
Asset:
NAS100 / US100 — NASDAQ 100 Index 💻📊
Market Type: Index
Trade Style: Swing Trade
📌 Market Plan (Bias):
🟢 Bullish structure confirmed
Price is respecting the Triangular Moving Average (TMA) pullback, signaling continuation strength within the broader uptrend.
🎯 Entry Strategy:
✅ Any Price Level Entry (Layered Approach Allowed)
Layering / Scaling-In Method:
This plan uses a multiple limit order (layering) strategy to optimize average entry during pullbacks.
Buy Limit Layers:
24900
25000
25100
📌 (You may increase or adjust layers based on your own risk and capital allocation)
🛑 Stop Loss (Risk Control):
🔴 Thief SL: 24700
📢 Adjust your stop loss according to your personal risk management and strategy.
This level invalidates the bullish pullback structure if broken.
🎯 Target / Exit Plan:
🟠 Primary Target: 25800
📌 Rationale:
Strong resistance zone
Overbought conditions may appear
Trap potential near highs
Possible corrective move from resistance
💡 Action: Secure profits near resistance — don’t overstay.
⚠️ Risk Disclaimer:
📢 Stop loss and target levels are for educational purposes only.
📢 Always manage risk independently and trade responsibly.
🔗 Related Markets to Watch (Correlation & Confirmation):
📊 US Indices (Direct Correlation):
US30 (Dow Jones) 🏭
→ Strength confirms broad US equity participation
SPX500 (S&P 500) 📈
→ Institutional flow confirmation for NASDAQ strength
💵 USD Index & Rates (Inverse / Indirect Impact):
DXY (US Dollar Index) 💲
→ Strong USD can slow tech upside; weakness supports NAS100
US10Y Treasury Yield 📉
→ Falling yields = bullish for growth & tech stocks
🧠 Risk Sentiment Assets:
BTC/USD ₿
→ Risk-on flows often align with NASDAQ momentum
VIX (Volatility Index) ⚡
→ Rising VIX = caution; falling VIX = trend continuation
💬 Final Note:
📈 Follow structure, respect risk, scale wisely.
🧠 Let price confirm — don’t chase.
👍 If this plan helps your analysis, boost with a like and share your view.

USNAS100 | Bearish Below 25420 After AI Sector ShakeoutUSNAS100 – Technical Overview
After last week’s sharp AI-driven selloff, U.S. equities and bonds are seeing some relief.
Market attention now turns to Tuesday’s payrolls report and China’s latest batch of disappointing economic data, both of which may influence risk sentiment and volatility in tech-heavy indices like the NASDAQ.
Technical Analysis
USNAS100 maintains a bearish momentum while trading below 25420, with downside targets at:
→ 25210 → 24820 (extended bearish continuation)
A short-term correction toward 25420 remains possible.
However, bullish momentum will only activate if a 1H candle closes above 25420, opening the upside toward: → 25570 → 25835
The 25420–25430 zone remains the key pivot area determining directional bias.
Pivot Line: 25430
Support: 25210 · 25080 · 24810
Resistance: 25570 · 25830

NASDAQ100 MARKET OUTLOOK!Price is bearish from the H4 perspective. The key level is broken to the downside confirming a possible bearish trend. All I’m waiting to see is an engulfing pattern and I’ll opt in for a sell. A sell opportunity is envisaged.

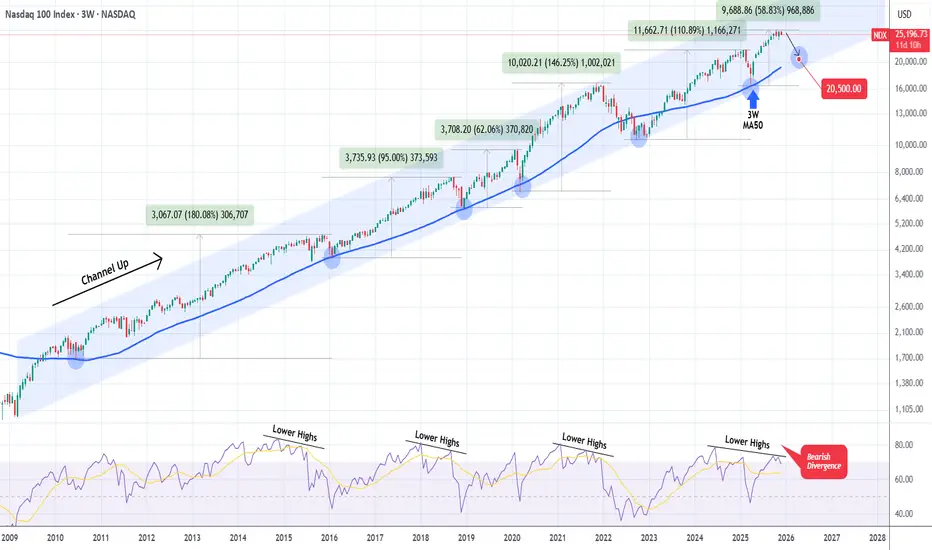
NASDAQ Time to correct hard until it reaches this level again.Exactly 6 months ago (June 20, see chart below), we posted the following analysis on Nasdaq (NDX), which helped us ride the rally following the April 07 2025 market low:
The reasoning behind this was that Nasdaq's low was on its 3W MA50 (blue trend-line), a key Support level which since 2009 and the start of the market's dominant multi-year Channel Up following the 2008 Housing Crisis, has offered 5 perfect long-term buy entries upon contact, only breaking once during the 2022 Inflation Crisis.
Now that the 3W RSI is displaying a Lower Highs Bearish Divergence (against the price's Higher Highs) that has been formed on another 3 prior Cycle Tops, we expect the market to start reversing soon for another cyclical correction. Technically another Bearish Leg for the dominant Channel Up.
Naturally, we expect it to reach at least the 3W MA50 again. Based on its trajectory, it is possible for contact to be made around 20500. Keep in mind again that absolute pricing isn't the important thing here, timing is. The most optimal time to buy based on this high accuracy model, is upon contact with the 3W MA50, regardless of the price it is at, so don't get fixed on 20500, but it is a fair projection based on the trend.
---
** Please LIKE 👍, FOLLOW ✅, SHARE 🙌 and COMMENT ✍ if you enjoy this idea! Also share your ideas and charts in the comments section below! This is best way to keep it relevant, support us, keep the content here free and allow the idea to reach as many people as possible. **
---
💸💸💸💸💸💸
👇 👇 👇 👇 👇 👇
US100 = NASDAQ there is a buy opportunity very soonas my previous analysis on nasdaq i expect a big short but does it started yet ? not certain maybe not yet so as it hits downside of the channel i am considering a buy trade here if it downbrake stop loss. waiting ona shorter time frames reversal or upbrake of the last down movement.

USNAS100 | Breakout Watch Between 25250–25100USNAS100 | Technical Overview
The price is currently consolidating between 25250 and 25100, waiting for a breakout to determine the next direction.
- A 1H candle close below 25100 will signal a bearish continuation toward 24770, with further downside potential toward 24570 and 24360.
- A 1H candle close above 25250 will support a bullish move toward 25430, and if momentum continues, the next target is 25670.
Today’s economic data will likely increase volatility. With inflation cooling and fundamentals improving, the indices market may experience bullish volatility in the short term.
Key Levels
Pivot Zone: 25250 – 25100
Support: 24770, 24570, 24360
Resistance: 25430, 25670, 25830
Bias: Breakout-dependent; fundamentals lean bullish.

USNAS100 | Short Correction Before Bullish ContinuationUSNAS100 | Technical Overview
USNAS100 is undergoing a short corrective move toward the 25360 – 25250 zone.
As long as the price holds above this area, bullish momentum is expected to resume, targeting 25620 and then 25780.
However, a break below 25250 would weaken the structure and open the way for a drop toward 25090.
Key Levels
Pivot Line: 25420
Resistance: 25620, 25830
Support: 25250, 25090

US100 - Short SetupI would love to see this continue it's bearish theme, obviously the stock market open volume is what really drives this instrument. If we can stay in this position and follow a theme as indicated with the path arrows on the chart, this may well be one of the best entries this year!
We have banked a bit of profit now and running this risk free. We may be able to get multiple entries from this original signal, or in the case this resistance zone breaks and we get the remaining position tapped at entry, we have 25,250 sell zone to fall back on.

NAS100 WaveSupport levels from pivot points and multiple moving averages create a technical base that reduces downside risk in the short term.
Volume remains steady, which confirms the reliability of the ongoing trend.
These combined technical factors typically precede price appreciation in the Nasdaq 100 , suggesting the index will likely continue to Declines hortly based on trend-following and momentum-based trading strategies with limited immediate overbought risk.

Nasdaq_BuyNasdaq is moving and creating an upward wave with a net growth of 10%
Due to the formation of a cup pattern, it can move up towards 27777 if the price maintains above 25125.

US100 - Short Position US100 H1
We have a top forming on a previous area of supply, a higher risk trade, but with high risk comes high reward. We have a 10R measured here on this position.
Failing this, we may take a loss and trade towards 25,250 price, major resistance, from here, we will look to recoup any potential loss from this trade and then some, risk management is key as always.

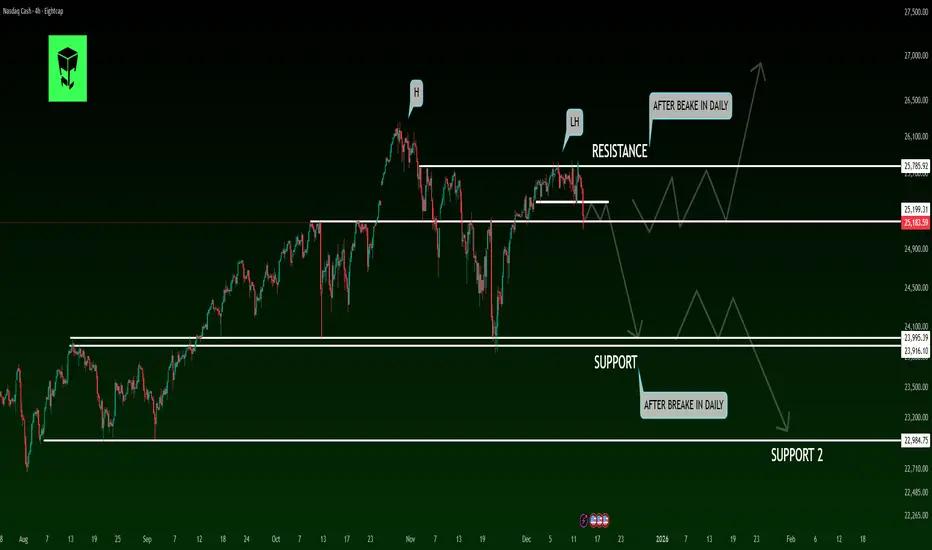
Calm Before the Storm?A Potential Crash Is Forming in US STOCKSHello, I hope you're doing well today. We are going to analyze the Nasdaq index together. The Nasdaq is one of the key U.S. stock indices and consistently offers promising trading opportunities. If you're ready, let's dive into the analysis.
Timeframe: 4H / Daily
🔍 Market Structure Overview
After forming a major High (H) followed by a clear Lower High (LH) near a key resistance zone, the NASDAQ index is showing signs of bullish momentum weakness. Failure to hold and stabilize above this resistance increases the probability of a market phase shift from bullish/ranging to corrective or bearish.
🧱 Key Supply & Demand Zones
🔴 Major Resistance:
Area around 25,750 – 25,900
This zone has rejected price multiple times and is acting as a strong supply area.
🟢 First Support:
Area around 23,950 – 24,050
A daily close below this support would strengthen the bearish scenario.
🟢 Second Support (Support 2):
Area around 22,900 – 23,000
A potential downside target if the first support breaks and weakness continues.
⚠️ Probable Market Scenario
As long as price remains below the main resistance,
the corrective / bearish scenario remains dominant.
A confirmed daily break below the first support could trigger
accelerated selling toward Support 2.
Any bullish moves at this stage may be considered pullbacks into resistance,
rather than the start of a new uptrend.
🧠 Summary
📌 Market structure suggests a weak trend
📌 Sellers are showing strength near highs
📌 Extra caution is required for long positions
📌 Short trades are more favorable only after confirmed breaks
🛑 Disclaimer
⚠️ This analysis is for educational purposes only
⚠️ It is NOT financial advice
⚠️ All trading decisions are made at your own risk
⚠️ Always apply proper risk and capital management
📊 Poll – What’s your outlook?
❓ What do you expect next for NASDAQ?
🔘 Further decline toward lower supports 📉
🔘 Range-bound movement between support & resistance 🔄
🔘 Strong rebound and breakout above resistance 🚀
👇 Share your view in the comments

SET BUY STOP ON 25000 (NAS100) NOW!Broke? You need a trade to set you free? Now this is it, place your buy stop, do not ask me why. Just place your buy stop, hold the trade until January 2026. The rest is history. Thank me later.

Nasdaq 100 extends dropTech trouble causing indices to turn lower on the session as bond yields continue to remain supported. Nvidia and Alphabet led tech lower, causing the Nasdaq 100 to shed over 1%. Keep an eye on Micron Technology earnings after the close. There is growing skepticism about the artificial-intelligence trade, which is why the Nasdaq 100 has under performed in recent days. Keep an eye on it as the selling could gather pace if more support levels break.
By Fawad Razaqzada, market analyst with FOREX.com

NAS100 Bearish SignsNasdaq is also looking ready to continue to correct to the downside. Price is in resistance and targets are in the open gap zone.

NSDQ100 Corrective pullback support at 24820Key Support and Resistance Levels
Resistance Level 1: 25370
Resistance Level 2: 25660
Resistance Level 3: 25866
Support Level 1: 24820
Support Level 2: 24640
Support Level 3: 24430
This communication is for informational purposes only and should not be viewed as any form of recommendation as to a particular course of action or as investment advice. It is not intended as an offer or solicitation for the purchase or sale of any financial instrument or as an official confirmation of any transaction. Opinions, estimates and assumptions expressed herein are made as of the date of this communication and are subject to change without notice. This communication has been prepared based upon information, including market prices, data and other information, believed to be reliable; however, Trade Nation does not warrant its completeness or accuracy. All market prices and market data contained in or attached to this communication are indicative and subject to change without notice.
