NAS100 M30 | Bullish Bounce Off Pullback SupportMomentum: Bullish
Price is currently above the ichimoku cloud.
Buy entry: 25,157.48
- Pullback support
- 61.8% Fib retracement
Stop Loss: 25,041.33
- Overlap support
Take Profit: 25,330.15
- Swing high resistance
High Risk Investment Warning
Stratos Markets Limited (tradu.com/uk ), Stratos Europe Ltd (tradu.com/eu ):
CFDs are complex instruments and come with a high risk of losing money rapidly due to leverage. 70% of retail investor accounts lose money when trading CFDs with this provider. You should consider whether you understand how CFDs work and whether you can afford to take the high risk of losing your money.
Stratos Global LLC (tradu.com/en ): Losses can exceed deposits.
Please be advised that the information presented on TradingView is provided to Tradu (‘Company’, ‘we’) by a third-party provider (‘TFA Global Pte Ltd’). Please be reminded that you are solely responsible for the trading decisions on your account. Any information and/or content is intended entirely for research, educational and informational purposes only and does not constitute investment or consultation advice or investment strategy. The information is not tailored to the investment needs of any specific person and therefore does not involve a consideration of any of the investment objectives, financial situation or needs of any viewer that may receive it. Past performance is not a reliable indicator of future results. Actual results may differ materially from those anticipated in forward-looking or past performance statements. We assume no liability as to the accuracy or completeness of any of the information and/or content provided herein and the Company cannot be held responsible for any omission, mistake nor for any loss or damage including without limitation to any loss of profit which may arise from reliance on any information supplied by TFA Global Pte Ltd.
Market insights

Nas 100Overall Market Context
The Nasdaq 100 (US 100 Cash CFD) is in a strong uptrend on the 4H chart, trading around 25,161 with recent gains. Price has broken above previous resistance and is extending higher after a consolidation phase in Nov–early Dec. The chart shows bullish momentum, with higher highs and higher lows since October.
Indicator Key Insights
Higher Timeframe Bias
Bullish (green background shading from daily EMA 20/50 crossover)
This favors longs on pullbacks. Shorts would be counter-trend unless bias flips.
Anchored VWAP & SD Bands
Current AVWAP: 24,932.66 (+0.92% from price) — price is above VWAP, confirming bullish control.
SD Bands:
±1σ: ~24,328–25,536
±2σ: ~23,724–26,140
±3σ: ~23,120–26,744
Price is near the upper ±2σ band (~26,140 area in recent swing), suggesting mild overextension. Pullbacks to VWAP or lower bands are common mean-reversion opportunities in uptrends.
Volume Profile (Fixed Range from Recent Swing)
POC (Point of Control): 25,114.63 — highest volume node, acting as magnet/support. Price is just above it, reinforcing strength.
Value Area: Wide yellow shading on left — high-volume zone from ~24,800–25,600.
HVN (High Volume Nodes): Yellow highlighted clusters show institutional interest around current levels.
Low-volume nodes below suggest quick drops on breakdowns, but bulls defending POC.
Fibonacci Levels
From recent swing low to high (anchored automatically).
Price near 0.618–0.65 Golden Pocket extension? (orange shading visible). This zone often acts as resistance in extensions or support on pullbacks.
Key retracement levels (dashed lines) for potential pullbacks: 0.382 and 0.5 likely around 25,000–24,800.
Signals & Confluence
Recent signals: Multiple green triangles (buys) with scores of 3 (solid medium confluence).
Last signal: 3 (buy) — triggered on AVWAP cross + proximity to POC/Fib.
No recent red/sell signals visible — all pointing bullish.
Confluence scoring: These "3" signals include AVWAP cross + POC/Fib proximity + HTF alignment, but missing one factor for A+ (score 4–5).
Current Setup & Trade Ideas
Bullish Bias (Primary Scenario)
Long on pullback: Wait for dip to POC (25,114) or AVWAP (24,932) with new buy signal (score ≥3).
Entry: On green triangle near support.
Targets: Upper ±2σ (~26,140) or ±3σ stretch (~26,744).
Stop: Below lower ±1σ or recent swing low.
RR: 2–3:1 easy in trend.
Why strong: Bullish HTF bias + price above VWAP/POC + volume supporting higher.
Bearish Counter-Trend (Lower Probability)
Only if red signal appears at upper ±3σ overextension.
Potential short if price rejects ~26,744 and scores ≥4 sell.
Target: Back to POC or VWAP.
Risky — against HTF bias.
Risks & Notes
Overextension: Price near upper bands — watch for rejection or consolidation.
News catalysts: Nasdaq sensitive to tech earnings, rates, AI hype.
Best trades: Wait for score 4+ with HTF alignment for highest edge.
Timeframe synergy: Check Daily for confirmation — bias remains bullish.
The indicator shows clear bullish control with room for extension, but a healthy pullback to POC/VWAP would offer excellent long entries. Focus on quality over quantity — these confluence setups have delivered consistent edges.
Trade safe!

Temporarily Losing Bullish Momentum I will be looking to sell Nas100
Due to imbalance created
Looking to sell to 25075 ish range

NESDAQ100 - Distribution at the topNESDAQ100 is possibly distributing at the top, with potential HnS pattern in the making, breaking below 24100 will open the door to 22000.

NASDAQNothing serious happening right now for me in markets. Best to wait for more development in upcoming days. US30 is steady, NASDAQ only thing I see is possible SND here but high risk.

USTEC What I am waiting for on US Tech…This is the zone I’m waiting for on Nasdaq. I already have limit orders placed — now we wait and monitor price action
ICMARKETS:USTEC IG:NASDAQ CAPITALCOM:US100 PEPPERSTONE:NAS100 NASDAQ:NDX

MNQ – London Session Context
Key level tested into London.
Bullish only on acceptance above key level with pullback.
Bearish only if failure back below VWAP.
No trades inside chop.
Execution on 1m, context from 15m–1h.

US100 (NDQ): Breakdown Risk Below Neckline — Sellers in ControlSummary :
US100 is showing clear topping behavior after a strong rally, with price now trading below recent highs and pressuring a key neckline support. Momentum favors a continuation lower unless buyers reclaim critical resistance quickly.
Technical Analysis:
The broader trend was bullish, but recent price action shows loss of momentum and distribution. The chart forms a Head & Shoulders / M-top structure, with the neckline around 23,980 already tested and weakly defended.
The last rebound failed to make a higher high, confirming lower high structure. Daily candles show strong bearish bodies from the right shoulder, signaling seller dominance. A clean daily close below the neckline increases the probability of continuation toward the next demand zone.
Fundamental Context:
US equities remain sensitive to Fed rate expectations and macro data (inflation, employment). Any repricing of rate cuts or renewed risk-off sentiment could accelerate downside pressure, especially on tech-heavy indices like US100.
Key Levels to Watch:
Resistance: 25,100 – 25,300 (right shoulder / breakdown zone)
Neckline Support: 23,980
1st Downside Target: 23,000 (major support zone)
Extended Target: 22,500 if selling pressure expands
Takeaway:
Bearish while price remains below 25,100. A confirmed daily close below 23,980 opens the door toward 23,000. Bullish recovery only if price reclaims the neckline and holds above it.
#US100 #Nasdaq #Indices #TechnicalAnalysis #TradingView #MarketStructure


Ganbit note: TS2025.12.19 homework
Ganbit brother share his homework.
In this homework, CISD, MSS, and most importantly TS were marked. Teacher Diva shared her opinion on this work, gave valuable feedback. Hope all that must mention things applied here.
Key:
if downtrend's already known, marking CISD toward current trend is not necessarily.
So, in this circumstance, what to notice?


Us100 correction on progress Super low risk, as we already dipped enough. I can’t say it will work for sure, but it makes sense

NAS100 Trade Set UP Dec 16 2025Price swept PDL and Asia lows already and has inverted a 1h FVG so i will wait for internal 1m-5m bullish structure to target PDH

US100 Liquidity Reaction at Accumulation Box Volume ProfileThis analysis is based on a Volume Profile anchored to the most recent accumulation box in order to isolate the active auction. The goal is to understand whether price is accepting value or rejecting it, rather than attempting to predict direction.
US100 recently attempted to trade above the upper value region but failed to hold acceptance. Price is now rotating back into the composite range, suggesting a transition from expansion to balance.
Volume Profile Perspective
The anchored Volume Profile highlights where the majority of recent transactions occurred. These levels define fair value and serve as decision points for continuation or rotation.
Price is currently interacting with a key acceptance area that has previously acted as both support and resistance. This makes it a critical zone for determining short-term control.
Key Reference Levels
Upper distribution and rejection zone from prior highs
Value acceptance area defined by the anchored profile
Lower value boundary and high-volume support
Lower composite distribution below value
These levels are treated as reaction zones, not precise turning points.
Expected Market Paths
Path One: Continued Rejection and Rotation Lower
If price fails to reclaim acceptance above the value area and continues to form lower highs, rotation toward the lower value boundary becomes the higher probability outcome. Acceptance below value would open the path toward the next lower composite distribution.
Path Two: Reacceptance Into Value
If price reclaims the value area and holds above it with acceptance, rotation back toward the upper distribution becomes likely. In this case, the prior rejection zone would act as the next area to evaluate for continuation or rejection.
Execution Considerations
This environment favors patience and reaction over anticipation. Trades are best evaluated at value boundaries rather than inside the range. Acceptance and rejection should be confirmed through structure and follow-through, not single candles.
This is a contextual market analysis, not a trading signal.
Summary
US100 is currently trading within a decision zone defined by an accumulation-based Volume Profile. The next directional move depends on whether price accepts back above value or continues to reject and rotate lower. Letting the market confirm intent at these levels is critical.

Nasdaq100I'm biased for sell in Nasdaq100. Looking in the weekly TF look sell. Though for the entry I'm skeptical about it, I'm not sure if it will react to the entry area I marked which is the previous structure or it might break the previous structure first before it pushes the market for short. I'll be watching the market movement before I enter the market.

NAS100 H1 | Bearish Reaction Off Pullback ResistanceMomentum: Bearish
Price is currently below the ichimoku cloud.
Sell entry: 25,147
- Strong pullback resistance
- 50% Fib retracement
- 100% Fib projection
Stop Loss: 25,372.80
- Overlap resistance
Take Profit: 24,913.79
- Overlap support
High Risk Investment Warning
Stratos Markets Limited (tradu.com/uk ), Stratos Europe Ltd (tradu.com/eu ):
CFDs are complex instruments and come with a high risk of losing money rapidly due to leverage. 70% of retail investor accounts lose money when trading CFDs with this provider. You should consider whether you understand how CFDs work and whether you can afford to take the high risk of losing your money.
Stratos Global LLC (tradu.com/en ): Losses can exceed deposits.
Please be advised that the information presented on TradingView is provided to Tradu (‘Company’, ‘we’) by a third-party provider (‘TFA Global Pte Ltd’). Please be reminded that you are solely responsible for the trading decisions on your account. Any information and/or content is intended entirely for research, educational and informational purposes only and does not constitute investment or consultation advice or investment strategy. The information is not tailored to the investment needs of any specific person and therefore does not involve a consideration of any of the investment objectives, financial situation or needs of any viewer that may receive it. Past performance is not a reliable indicator of future results. Actual results may differ materially from those anticipated in forward-looking or past performance statements. We assume no liability as to the accuracy or completeness of any of the information and/or content provided herein and the Company cannot be held responsible for any omission, mistake nor for any loss or damage including without limitation to any loss of profit which may arise from reliance on any information supplied by TFA Global Pte Ltd.

NAS100 CeillingSupport levels from pivot points and multiple moving averages create a technical base that reduces downside risk in the short term.
Volume remains steady, which confirms the reliability of the ongoing trend.
These combined technical factors typically precede price appreciation in the Nasdaq 100 , suggesting the index will likely continue to Declines hortly based on trend-following and momentum-based trading strategies with limited immediate overbought risk.

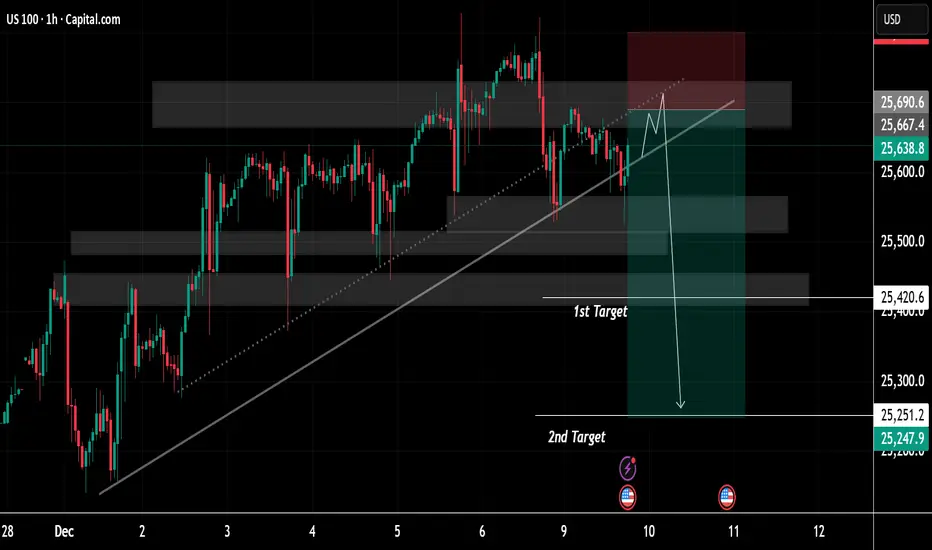
US100 Price Update – Clean & Clear ExplanationUS100 is moving within a broad ascending channel, defined by a long-term diagonal support line that has guided the market’s bullish momentum since late November. Multiple interaction points along this trendline show it has historically acted as a reliable dynamic support zone.
Several shaded horizontal regions highlight key supply and demand zones. These zones reflect areas of repeated institutional activity where price has previously paused, consolidated, or reversed. The upper shaded region represents a resistance cluster where bullish momentum has struggled to sustain continuation, resulting in repeated rejections and wicks to the upside.
The most recent price movement shows the index pushing upward into this resistance band once again, followed by signs of exhaustion. A projected schematic drawn on the chart suggests a potential final liquidity grab—where price may sweep the highs near resistance before reversing. The marked red zone indicates the anticipated rejection area, implying traders may be monitoring this region for a potential bearish shift.
Below, two targets are outlined:
1st Target: Positioned near a mid-range demand zone, aligning with a previous consolidation block. This zone represents the first probable area where price may stabilize or react after a breakdown from the trendline.
2nd Target: A deeper level aligned with a broader structural demand zone. This region marks a significant liquidity pool and a potential magnet for price if bearish momentum continues.
The downward arrow illustrates the conceptual path of a scenario where the ascending trendline is broken decisively, potentially triggering a momentum-driven decline toward these target levels. This depiction emphasizes the importance of trendline integrity and the reaction at the overhead supply zone.
Overall, the chart presents a clean confluence-based structure combining trendline dynamics, supply-demand mapping, and liquidity behaviour—offering a well-organized visualization of a possible medium-term market reversal scenario within a prevailing upward trend.
If You find it helpful please like and comments for this post and share thanks.
US100 SENDS CLEAR BEARISH SIGNALS|SHORT
US100 SIGNAL
Trade Direction: short
Entry Level: 25,351.0
Target Level: 24,524.8
Stop Loss: 25,900.5
RISK PROFILE
Risk level: medium
Suggested risk: 1%
Timeframe: 9h
Disclosure: I am part of Trade Nation's Influencer program and receive a monthly fee for using their TradingView charts in my analysis.
✅LIKE AND COMMENT MY IDEAS✅

H4 Reversal – Failed Breakdown SetupH4: Failed to break lower → breaks H4 high and reclaims major resistance
Entry: H1 bullish market structure

NAS100 Trade Set Up Dec 19 2025Price is making HL on the 1h so if price first sweeps London highs/PDH then comes to sweep SSL/London lows or Asia Lows i will then look for internal 1m-5m IFVG/CISD to take buys higher to higher BSL and supply

BUY ZONE NAS100Good morning traders. The market has confirmed CHoC. Now, we have to wait for retest to the demand zone. Once demand zone is reached, look at lower time frames for a proper buy entry. Trade what you see and not what you feel

NAS100 Trade Set Up Dec 18 2025Price came down to strong demand, bounced off it, and has inverted a 1h FVG so i will wait for a pullback followed by internal 1m-5m IFVG/CISD to take buys to PDL and fib levels
