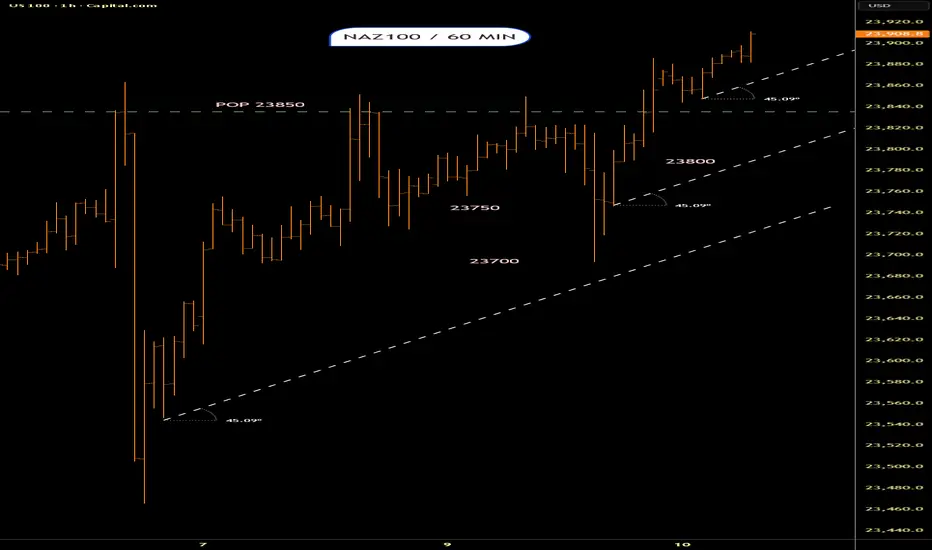
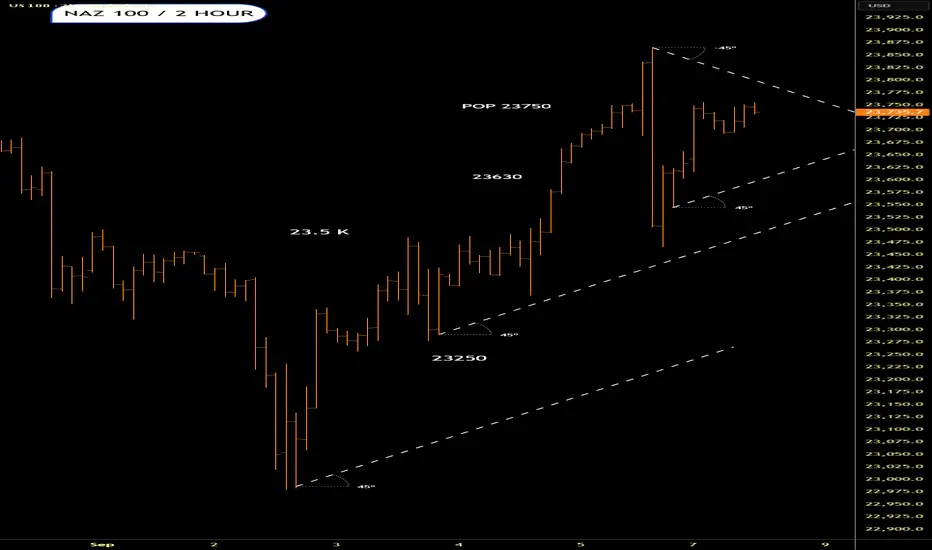
Naz 100 / Wednesday 10th SeptemberIt finally popped that 23850 rez area.Maybe that becomes support.Lets see what happens
US100 trade ideas
NAS100 - Trading Zones and Market SentimentZone 1 – 23,926 – 23,943
This is a critical resistance area sitting just below the all-time high. Sellers are likely positioned here, making it a strong zone for potential rejection. A clean breakout and successful retest, however, would flip the zone into demand and open the path toward fresh highs.
Zone 2 – 23,854 – 23,880
Formed around recent consolidation and breakout structure. Buyers are expected to defend this zone on pullbacks, creating potential long opportunities. If broken decisively, it could turn into resistance, signaling weakening momentum.
Zone 3 – 23,782 – 23,798
A deeper demand level aligned with prior absorption and intraday lows. Likely to attract liquidity sweeps and sharp reactions on first touch. A failure here would shift control back to sellers and suggest a larger corrective move.
Sentiment in US100 Today: Between Optimism and Caution
Retail investors pull back from most Big Tech, except Nvidia and Palantir.
According to Charles Schwab’s STAX activity, retail investors have generally reduced exposure to large-cap tech stocks, with the exception of Nvidia and Palantir, which both saw significant net buying. This points to rising risk appetite, particularly toward select growth names in the tech sector.
Job revision data weakens the economy, but keeps rate expectations alive.
Wall Street remains subdued but continues to lean on the likelihood of a Fed rate cut, after job growth was revised down by nearly 1 million over the past 12 months.
Conclusion: Sentiment in the US100 remains cautiously optimistic, driven by a strong tech sector and dovish Fed expectations but the foundation is fragile, especially in light of weaker economic signals.

NAS100 | Potential Buy Plays - Demand > SupplyPrice has bullish sentiment. Price being at value we could see potential buy plays. We'll wait for a entry signal at our key level and see how it plays out.

Nasdaq-100 Wave Analysis – 9 September 2025
- Nasdaq-100 reversed from the support area
- Likely to rise to resistance level 24500.00
Nasdaq-100 index recently reversed up from the support area between the pivotal support level 23000.00 (which has been reversing the price from July), lower daily Bollinger Band and the 38.2% Fibonacci correction of the upward impulse from June.
The upward reversal from this support zone created the daily Japanese candlesticks reversal pattern Hammer – which started the active impulse wave iii.
Given the clear daily uptrend, Nasdaq-100 index can be expected to rise toward the next resistance level 24000.00 (top of wave 3), the breakout of which can lead to further gains toward 24500.00.


long at support nasim not trading this but i think this is interesting, if 1m holds at entry. think we can pump to this tp. if 1m closes really down. best not enter it as it would be catching daggers. but i would reverse the trade to next zone below. best enter after break, then back up with a wick on top. then enter the short. or middle of the 15m candle body as entry short.

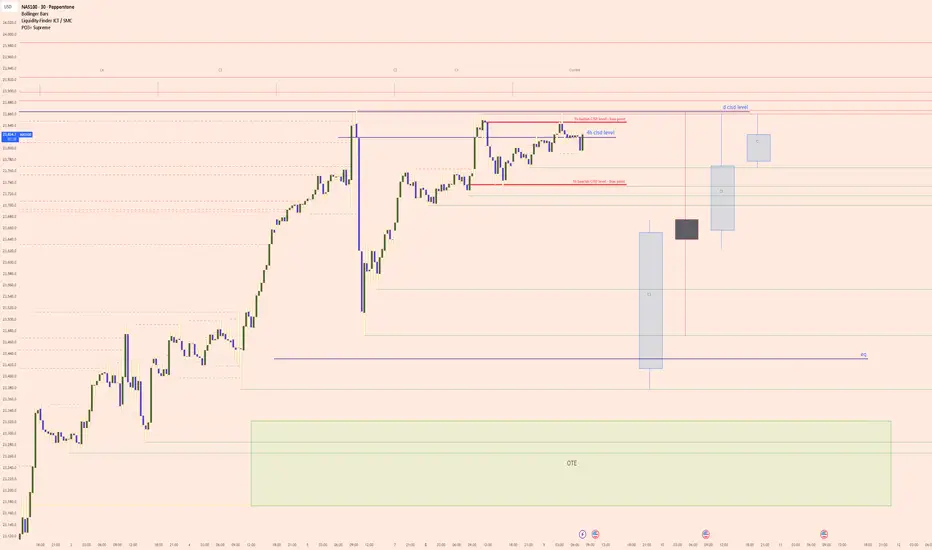
NAS100 (Nasdaq) Key Levels and Probable Draw on LiquidityA clear bullish market structure driven by an aggressive upward displacement.
This energetic move to the upside has created several price inefficiencies, or gaps, which are areas where price delivery was one sided.
Currently, price is consolidating in a premium range, above the equilibrium of the recent impulse leg.
The logical draw on liquidity, or the ultimate target for this bullish momentum, is the distinct old high labeled as the "d cisd level" (Daily change in the state of delivery).
The market is likely reaching for this level to clear out any resting buy side orders.
Before reaching that ultimate target, a retracement is a high probability event.
Price may pull back to rebalance the inefficiency at the "4h cisd level", which should now act as a significant support area.
This would represent a move back into a relative discount, offering a more favorable entry for buyers aiming for the highs.
Should this level fail, a deeper retracement into the larger green zone labeled "OTE" would signify an optimal entry point within the overall bullish leg.
The narrative remains bullish as long as these key lower levels of support are respected.
The alternative path would likely have led to chasing price in a premium, resulting in a poor risk to reward entry. PEPPERSTONE:NAS100 CME_MINI:NQ1! CME_MINI:MNQ1!
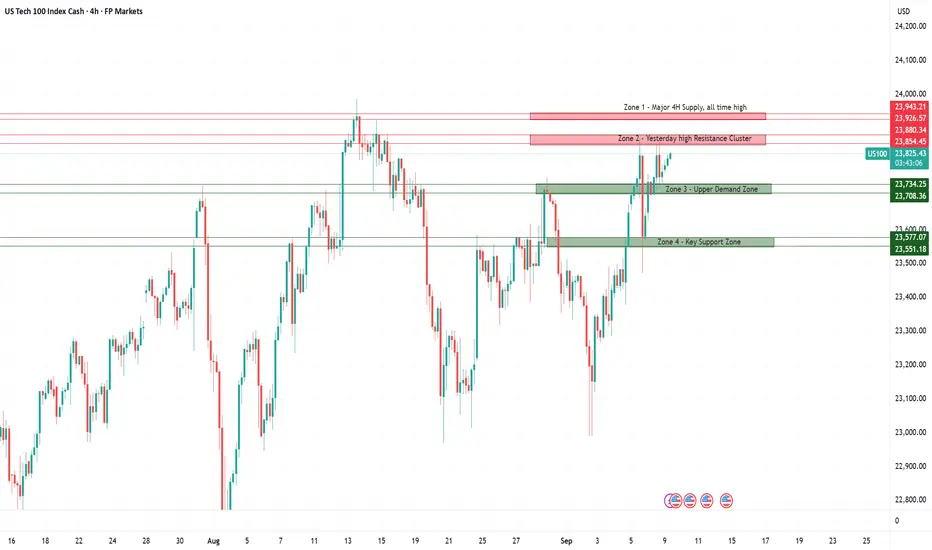
Nasdaq-100: Trading Levels to WatchKey Zones Today
Supply Zones (Red)
Zone 1: 23,926 – 23,943
This is the upper resistance zone, located just below all time high. Sellers are likely positioned here, making it a strong area for potential rejection. A confirmed breakout and retest, however, would indicate buyer strength and could open the path toward new all-time highs.
Zone 2: 23,854 – 23,880
A key intraday supply area with multiple prior rejections. Often acts as a liquidity pool, where failed breakouts can trigger sharp downside moves. A clean break and hold above would flip this zone into short-term support for continuation longs.
Demand Zones (Green)
Zone 3: 23,708 – 23,734
Formed around the recent breakout structure, this zone is expected to attract buyers on pullbacks. A sharp bounce here would confirm demand strength, while a decisive break below flips the area into resistance and could trigger continuation shorts.
Zone 4: 23,551 – 23,577
A deeper support level, aligned with prior consolidation and buyer absorption. Strong bounce potential on first retest, but repeated tests weaken the level. A breakdown here would shift momentum clearly in favor of sellers and open space for a larger downside move.
Nas100 - Cautiously Bullish, Waiting on Momentum
Sentiment in the US100 is cautiously positive but fragile. Large-cap tech continues to support the index, and hopes of imminent Fed rate cuts provide additional tailwinds. Still, the index remains below its all-time high, and uncertainty around economic data and geopolitics keeps investors from going all-in.
In short: there is momentum and optimism, but it rests on a fragile foundation where a single weak data point could quickly shift sentiment.
The red arrow point to a intersection with a resistance The red arrow point to a intersection with a resistance so stay long

Nas100 Trade Set Up Sep 08 2025FX:NAS100
www.tradingview.com
I am overall bullish due to price inverting a 1h FVG and making HH/HL. So i want to see SSL swept followed by a 1m IFVG or RB formed before continuing higher

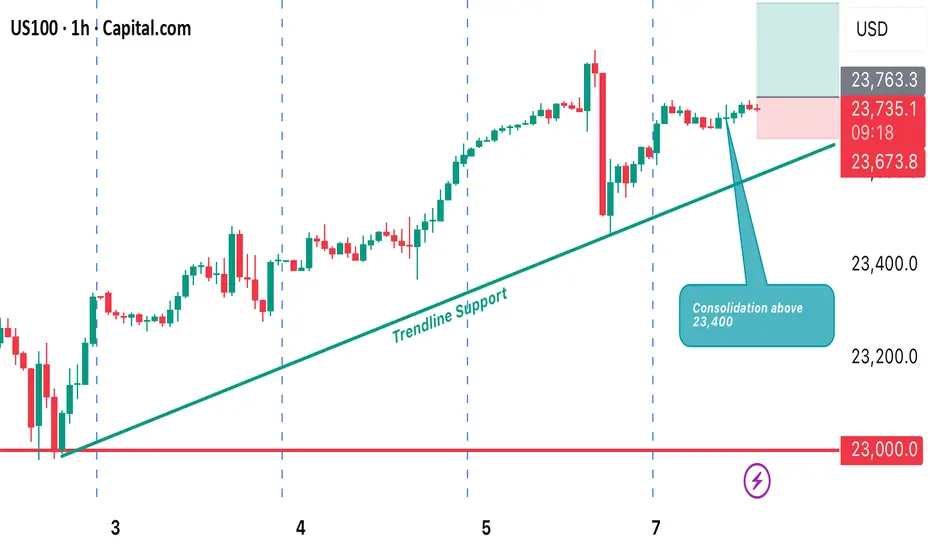
US100 BUY IDEA - H1 CHARTPrice is looking promising for a buy from the current market price. Price is bullish from the higher timeframe. I anticipate more bullish price action to develop away from the current market price. From the intraday perspective.
A narrow Value Area waiting to Break out?NASDAQ seems to be continue Uptrend, It accumulate to ready an break-out!
Its volatility is wide so lets see where will be an retest level?

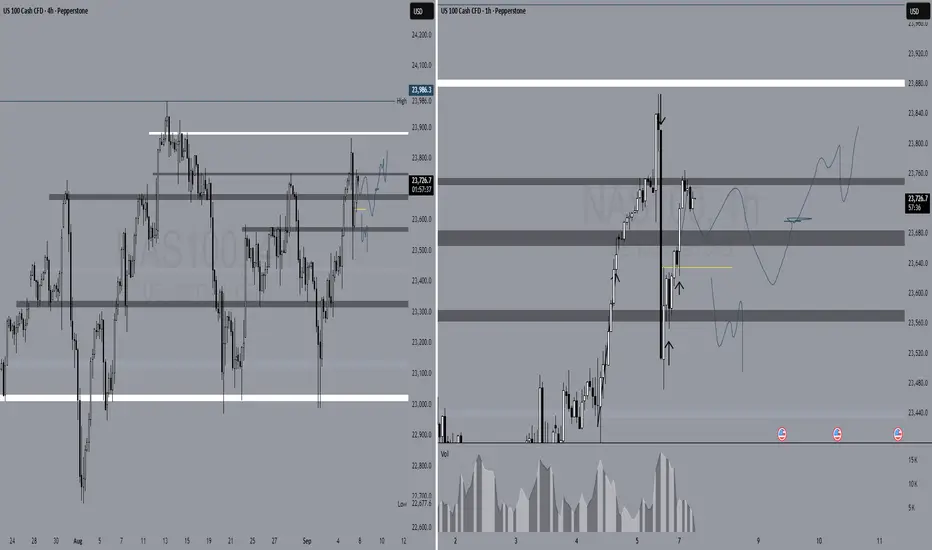
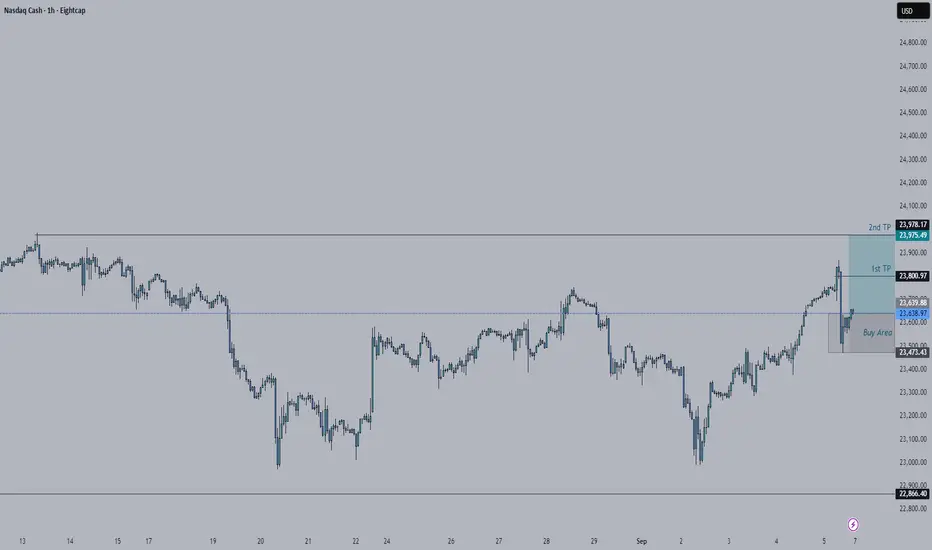
Key levels for us100we are facing an strong liquidity zone then we are not going to go against it even it give us the shake out. now, if it breakt the 23,745 and then it shakes out we can go to the 23900s but, in the case that it breaks 23635 and dont manage to reclaim the 23681 we can expect a fall but i dont see the fall that near. However lets see what tomorrow holds for us. Btw if it shakes out the 23748 we will cover once it reaches 23879 50 to 70% and then the rest we will see how we can add along the way.

Buy zone of Nas100If we start trading inside the triangle again, then there is a possibility sellers will step in the market and push the market lower to the buy zone area. The triangle pattern is a strong indication of sell - however, the overall market structure of Nas100 is bullish, therefore, I will not be taking sells if sellers do step in the market, I will still wait for buy entries.
If the market trades up, and breaks resistance, I will look for buy entries on smaller TF and continue with the bullish momentum.

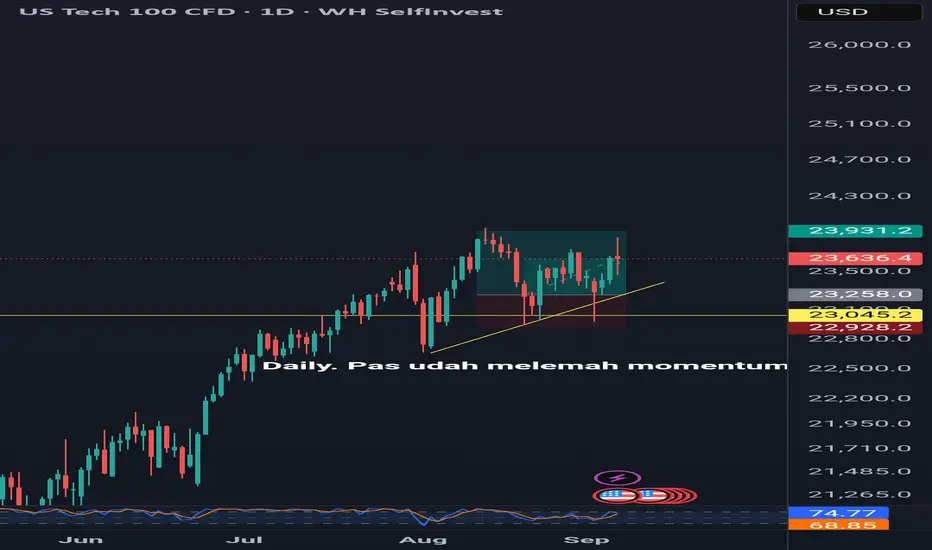
Bottoming, chart patternWe see Nasdaq already hit bottom in price of USD 23.258. We have been entry in that price (althought it has been muted by tradingview because we use indonesia language in description)
My reason for entry is l, he has hit the bottom and see rejection. My TP is in old ATH and my SL in half of my pips.
Three possibilities my setup not in my favor
1. The fed cut interest rate
2. Technically, its reversion pattern
3. It is what it is.
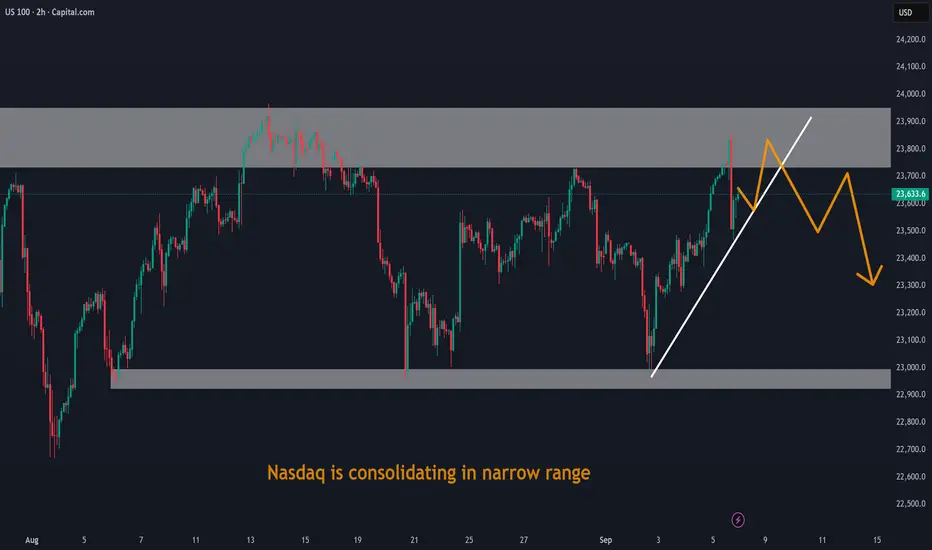
Nasdaq is consolidating in narrow rangeNasdaq is consolidating in narrow range. Waiting for some big fundamental news for breakout
NasDaq Bullish analysisThough the market made a quick sell, I still think the market will continue to the upside and will break the previous structure.
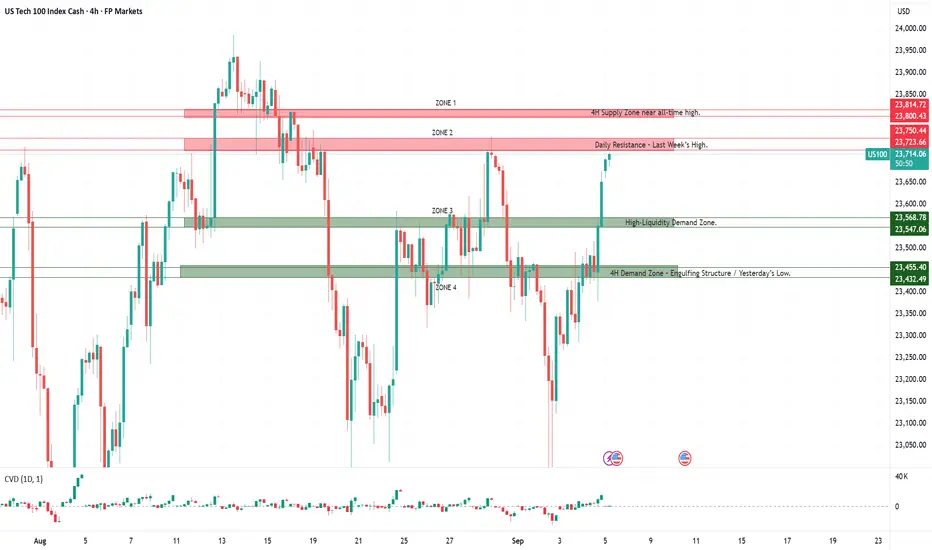
US100 – Today’s Key Trading ZonesHere are today’s trading zones for the US100. The levels are not fixed buy or sell signals, but decision areas where price often accelerates. Rejections can set up counter-trades, while clean breaks and retests can create continuation opportunities.
Zone 1
This area represents a major resistance close to the historical top. Price entering this zone carries a high probability of seller absorption and sharp rejection. A clean breakout and hold above would shift sentiment and open the door for new highs.
Zone 2
A key decision area from previous weekly highs. Often acts as a liquidity pool where breakout traps are common. A strong rejection can offer short opportunities, while a confirmed break and retest may flip the zone into support.
Zone 3
This level has repeatedly attracted strong reactions and carries high resting liquidity. Expect aggressive order flow here – either a sharp bounce for longs or, if broken, a continuation short on retest.
Zone 4
Formed around a strong 4H engulfing pattern and aligned with yesterday’s low. Buyers are likely to defend this level, making it a key intraday demand zone. A decisive break below would indicate seller dominance and could accelerate downside momentum.
Market Sentiment – Cautious Optimism
Overall sentiment in the US100 remains cautiously optimistic, supported by strong performance in Big Tech and expectations of a more dovish Fed. Still, the backdrop is fragile given broader macroeconomic signals, with investors balancing optimism against underlying economic risks.
Big Tech Drives the Market
Large-cap tech stocks led the market higher at record pace. Alphabet surged nearly 9%, Apple advanced 3–4%, and Tesla gained about 1.4%, boosted by a favorable antitrust ruling and strong technical momentum. Alphabet even reached a new record high, underscoring the sector’s ability to lift the entire index.
Macro Data – Mixed but Supportive
Weaker job openings data reinforced expectations of Fed rate cuts, a positive driver for growth stocks as lower bond yields support risk appetite. At the same time, the ISM Services PMI rose to 52.0, marking a third straight month of expansion and showing resilience in the services sector despite manufacturing weakness and a cooling labor market.
NAS100 - Bullish IdeaWaiting for price to essentially reject the London Lows - most likely after news to then make another leg to the upside - It will require some liquidity of the sellers to then flip up - if price does not reject the LL and continues downside - I will wait for lower levels and a close about the London Lows to then take the buy to the upside - heavy news today so will see how it all plays out. So far, I am bullish for the play.

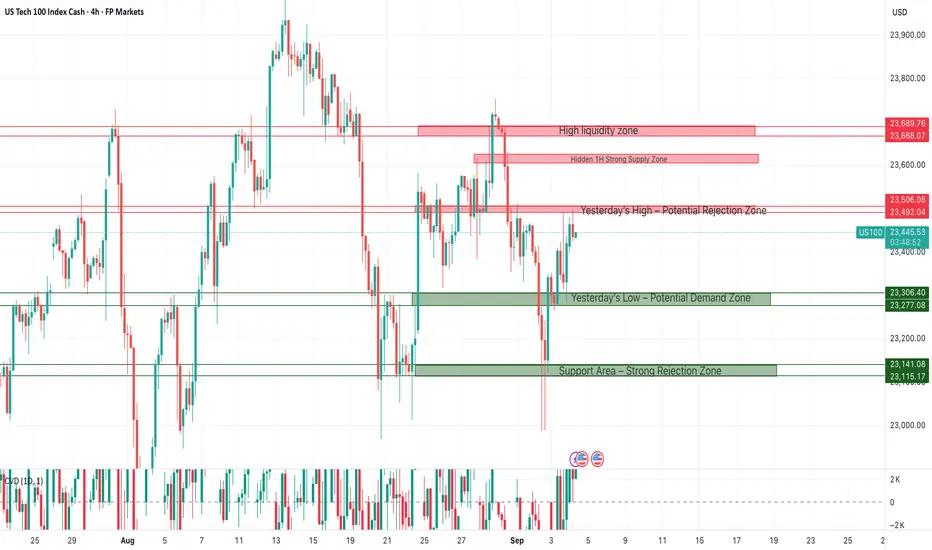
US100 on Shaky Ground – What Traders Should Watch TodayZones in Focus
The marked zones on the chart are not fixed buy or sell levels but decision areas where price is likely to accelerate and create short-term opportunities.
Red zones (potential supply): If price trades into these areas and shows rejection, it can set up short positions. A clean break above, however, flips the zone into potential support, opening the door for continuation longs.
Green zones (potential demand): If price reaches these areas and bounces sharply, it can provide long setups. A decisive break lower, by contrast, turns the zone into resistance, creating opportunities for continuation shorts on a retest.
The framework is built around letting price action on the 5-minute chart confirm the reaction: rejections favor counter-trades, while breakouts and retests favor continuation in the direction of the move.
The Market Is Sending Mixed Signals
The latest JOLTS report showed U.S. job openings falling to 7.18 million in July, below expectations of 7.38 million and down from 7.36 million in June. That makes it the lowest reading in ten months – and for the first time since the COVID era, there are more unemployed workers than available jobs.
For equities, this kind of data is a double-edged sword. On one hand, fewer openings cool the labor market and strengthen the case for earlier Fed rate cuts. On the other, if the trend deepens, it signals weaker economic momentum and risks feeding through to lower earnings growth.
Mood Check: Nasdaq Between Hope and Fear
The mood in the Nasdaq-100 is cautiously optimistic, yet undeniably fragile.
The bright side: Big Tech carried the index higher yesterday, with Alphabet rallying 9% and Apple 3–4%. That added roughly 1% to the Nasdaq-100 and reminded us how concentrated the index still is – a single positive headline can shift sentiment fast. At the same time, falling yields and softer labor data fuel hopes that the Fed may soon move toward cuts, a clear tailwind for growth stocks.
The risk side: Macro signals tell a different story. The ISM confirmed that manufacturing remains in contraction, and JOLTS made clear that the labor market is cooling. Inflation pressure may be easing, but so is economic momentum. That keeps investors defensive, even as the index rallies.
The Bigger Picture
Taken together, US100 sentiment is leaning positive in the near term, but the foundation is shaky. Gains are being driven more by mega-cap strength and expectations of rate relief than by broad economic resilience. Until the macro backdrop turns more convincingly, every rally remains vulnerable.
nas retest longim on fire today, made about 4k usd in the morning session.
but im looking at this one, conditions, looking for uk to dump, then usa to pump back up,
will look at 5 mins candles to see entry. i want to see some wicks or support.
if doesn't dump before USA timezone, i rather stay out as we got 3 news tonight, looking very choppy, likely will stay out of usa market today, just price action and take some small wins here and there.
my scalping im on 7 trading day win streak, about 80% winrate.
