watching 15m chartno news, we pushed pretty down just now. going to watch 1m for entry to short. if 1m close too high won't enter.
Same trade 2 days back, but yesterday was good.
if price goes up here, looking to short it to tp. or half way from 1m high and low.
US100 trade ideas

NSDQ100 ovrsold rebound supported at 23350US equities advanced, with the S&P 500 +0.41%, closing just shy of record highs, as solid US data offset Fed uncertainty. Conference Board consumer confidence (97.4 vs. 96.5 exp) and core capital goods orders (+1.1% vs. +0.2% exp) signaled resilience, while the Richmond Fed index (-7 vs. -11 exp) improved.
Focus today is Nvidia earnings, which could be pivotal for NASDAQ 100 given its AI leadership and sensitivity to US-China trade tensions. Asian tech strength overnight reflects bullish positioning ahead of results.
Meanwhile, hedge funds are running record shorts in VIX, betting on low volatility—an extreme stance that has historically preceded sharp market moves, something to watch around Nvidia’s release.
In the UK, BoE’s Mann argued for keeping rates high for longer, but impact is limited for US tech trading focus.
For NASDAQ 100: near-record highs, tech sentiment riding on Nvidia, but positioning risk in volatility markets could amplify any surprise.
Key Support and Resistance Levels
Resistance Level 1: 23700
Resistance Level 2: 23830
Resistance Level 3: 23920
Support Level 1: 23350
Support Level 2: 23250
Support Level 3: 23100
This communication is for informational purposes only and should not be viewed as any form of recommendation as to a particular course of action or as investment advice. It is not intended as an offer or solicitation for the purchase or sale of any financial instrument or as an official confirmation of any transaction. Opinions, estimates and assumptions expressed herein are made as of the date of this communication and are subject to change without notice. This communication has been prepared based upon information, including market prices, data and other information, believed to be reliable; however, Trade Nation does not warrant its completeness or accuracy. All market prices and market data contained in or attached to this communication are indicative and subject to change without notice.

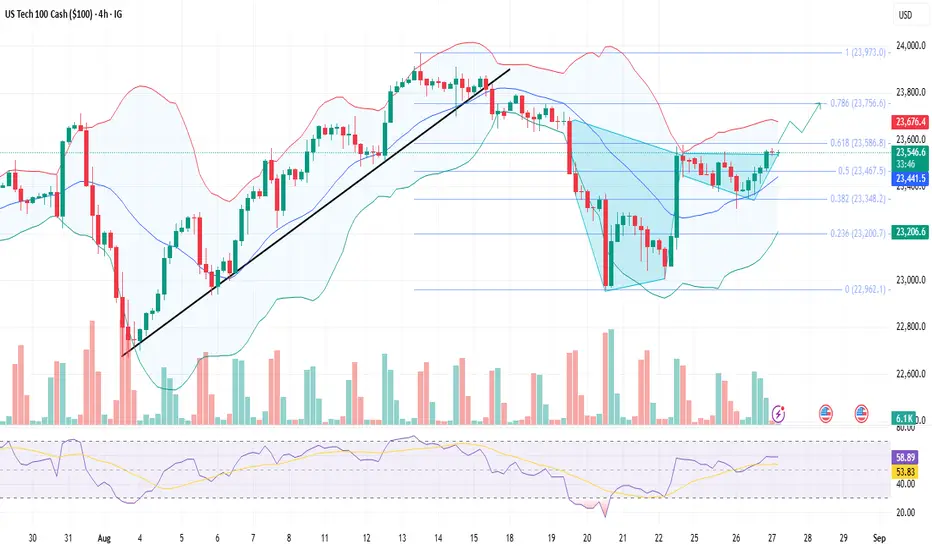
Nasdaq Intraday AnalysisOn the chart, Nasdaq is consolidating above crucial psychological support of 23500, creating a bullish cup & handle pattern
However, the prices despite Governor Cook's news failed to break the 0.618 Fib level (23586),
Still, Trump’s firing of Fed Governor Lisa Cook has created majority in the Fed, which has risen prospects of deeper rate cuts.
And lower rates historically support tech stocks.
Therefore, if prices breaches the immediate resistance at 0.618 Fib level (23586), then the US tech index will continue its bullish momentum toward 23756–23,970.
What Indicators are indicating:
1) RSI is hovering in the buying zone near 58, showing momentum is recovering but not yet overbought — room for further upside.
2) Bollinger Bands are widening slightly and turning their trend toward up-side, hinting at increasing volatility and potential for breakout trades.
Overall bias: Buy on dips toward 23500–23450 zones with targets at 23756 and 23950 intraday.
nasdaq buyhi evryone the nasdaq index can rise to the specifed target. please don't forget capital managment

US equities advanced despite concerns over Fed independence
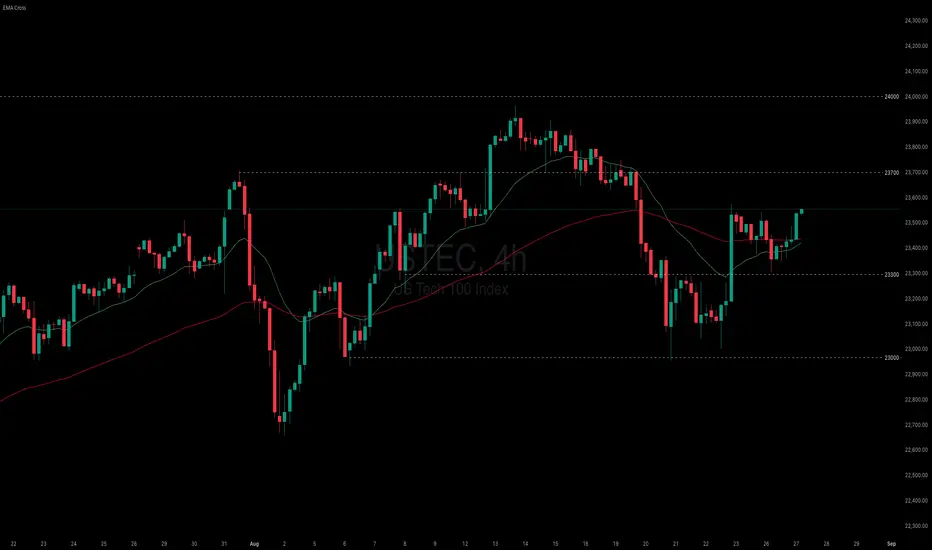
Despite the uncertainty following President Trump’s dismissal of Fed Governor Cook, USTEC advanced slightly.
President Trump dismissed Fed Governor Cook due to allegations of mortgage fraud, raising concerns over the Fed's independence. JPMorgan warned the move could set a precedent for politically driven dismissals of other board members.
Meanwhile, the August CB Consumer Confidence Index rose to 97.4, indicating a more positive outlook on current conditions. However, 12-month inflation expectations rose from 5.7% to 6.2%, while the share of respondents viewing jobs as plentiful decreased from 29.9% to 29.7%.
USTEC has risen above both EMAs, signaling an attempt at a trend reversal. The narrowing distance between EMA21 and EMA78 suggests a potential shift toward bullish momentum. If USTEC holds above both EMAs, the index may gain upward momentum toward the resistance at 23700. Conversely, if USTEC falls back below both EMAs, the index could retreat toward the support at 23300.
about the last analysis i shared with u my anlysis and u can check it in the start of the week unti now two wonderful trades now only waiting for gdp and i will confirm the next days direction
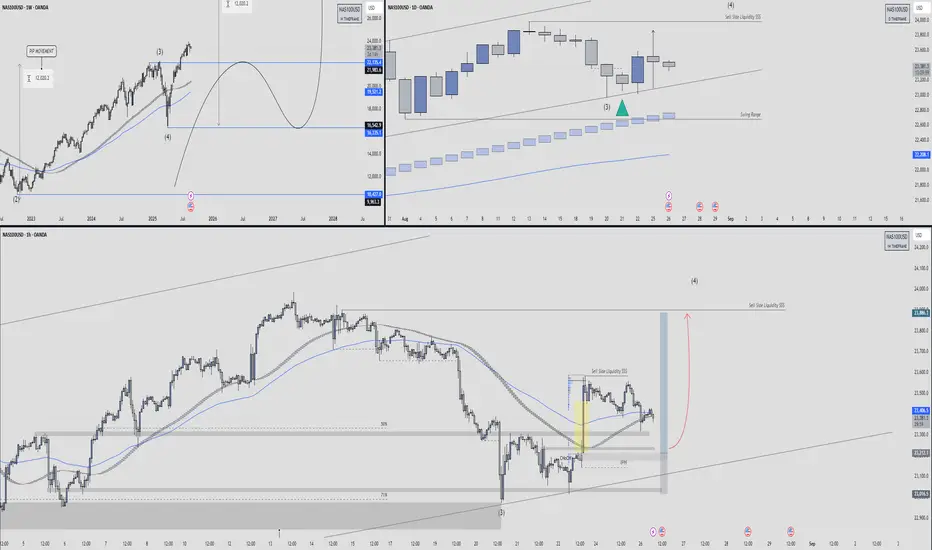
Nas100 Breakdown with Trade Setup🕰 Weekly Structure
Price has completed a Wave (3) high and is now transitioning into a corrective Wave (4) phase.
The broader market cycle suggests sell-side liquidity is being targeted before any new impulsive leg higher.
The EMA structure is still bullish long-term, but retracements are healthy after extended rallies.
Key downside zones:
21,985 – 22,135 (mid-support pocket)
16,962 – 16,353 (deeper retracement if correction extends)
📉 Daily Timeframe
Current daily candles are rejecting the upper levels after tagging swing-high liquidity.
Price is consolidating near the swing range support line (~22,700–23,200).
Buyers are defending the level marked by the green triangle, aligning with a previous Wave (3) pivot.
If this level holds, we may see a relief rally targeting 23,800–24,200 before deciding the next move.
⏱ 1H Short-Term View
Price recently tapped into sell-side liquidity (SSS) and bounced from the 71% fib retracement + demand zone.
A change of character (ChoCH) is visible from the highlighted yellow candle, indicating buyers are stepping in.
Expect a possible bullish leg toward 23,800 – 24,000 if higher-low structure confirms.
If 23,200 fails, downside liquidity sits at 23,000 → 22,700.
🎯 Trade Plan
Bias: Short-term bullish relief rally inside larger corrective Wave (4).
Entry Zone: 23,200 – 23,400 demand retest.
Target 1: 23,800 (SS liquidity pocket)
Target 2: 24,000–24,200 (daily resistance)
Invalidation: Sustained close below 23,000 → opens path to 22,200.
📌 Summary
NAS100 looks corrective after a strong multi-month bullish wave. Near-term, liquidity sweep setups favor a bounce into 23,800+ as long as 23,000 holds. Medium-term, Wave (4) correction could extend deeper into 22k–20k levels before the next major bullish wave.
NAS 100 TARGET?The setup feels just right, makes me want to budget to trade long term, been a while since I followed charts this wide.
What's your take??

nas short term short retest trade1m close near entry, this looks interesting, look at 1m for better view.
should have a liquidty grab there.
if price closes too high, on 1m, then cancel trade.

US100 (Nasdaq) - NY Session Looks like the price might pullback a bit after hitting resistance, then keep heading up. 24k still seems likely. Wait for a reaction after the correction is over.
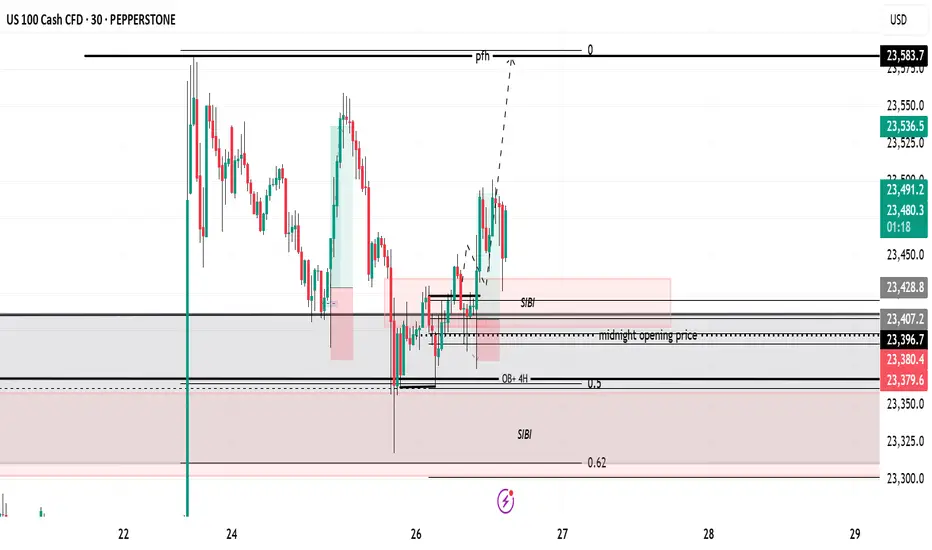
Nas100 Trade Set Up Aug 25 2025FX:NAS100
www.tradingview.com
Nas100 Trade Set Up: price has formed a big gap between HH/HL and a 15m sellside so i want to see if price either sweeps SSl and closes above to continue higher or i test of demand zone

US100 / NASDAQ Technical AnalysisThe Nasdaq index is currently trading near 23,430, heading for a correction after a recent price rally.
🔻 Bearish Scenario:
If the price remains below the 23,450 area, it may head toward testing 23,200, which is a potential bounce zone.
🔺 Bullish Scenario:
If we see signs of a rebound and the price successfully breaks and holds above 23,580, this could support a continued rally toward 23,800.

NAS100 - Bearish Setup!Markets gaps to fill, starting off in the higher time frame price plumeted from the supply zone. From there we had a strong support thats been formed.
We are AIMING for that support zone. Change Of Character HAS been created already giving me confirmation to look for selling opportunities in this market range.
Reacting of the smaller supply zone I will be anticipating a 71% retracement back into the supply to fill imbalance before shorting into that support that we suggested would be our target.
Good luck to anyone that follows

Nasdaq's Bearish Drift: Key Levels in FocusFenzoFx—Nasdaq's short-term trend is bearish. Friday's rally eased after the price filled the fair value gap with resistance at $23,569.00. Today, NQ displaced below the recent lows, currently trading inside the bullish FVG.
There is a relevant equal low at $23,012.00. From a technical perspective, the bearish outlook remains valid if the price holds below $23,569.00. In this scenario, we expect the market to fill the FVG with immediate support at $23,277.00.
Furthermore, if the selling pressure persists, Nasdaq could sweep the equal low by targeting the support at $22,950.00.

Nasdaq Eyes the 23,700 Resistance Ahead of NVDIA EarningsOn the Nasdaq front, all eyes are on NVIDIA’s Q2 earnings, with expectations for revenue around 45.9B and EPS between 1.00–1.01. While enthusiasm around AI continues to drive tech optimism, concerns remain over tariff risks with China, particularly regarding potential backdoors or tracking technologies in NVIDIA chips. These risks could limit revenue potential from the Chinese market
Nasdaq's rebound from the 22,900 mark appears sustainable, with daily RSI holding above the 50 neutral-barrier. A clean hold above 23,700 and 24,100 could pave the way toward new highs at 24,400 and 24,700, in line with continued AI-driven growth.
Downside: A break below 23,200, 22,900, and especially 22,700 would signal broader tech sector weakness, potentially aligning price action with 22,300 and 21,900 support zones.
Written by Razan Hilal, CMT

sell set upFor nas I will be waiting to see if price breaks out of the zone and closes.If it closes then we can look to take sell opportunities back to the first line and maybe even the second depending on the momentum.

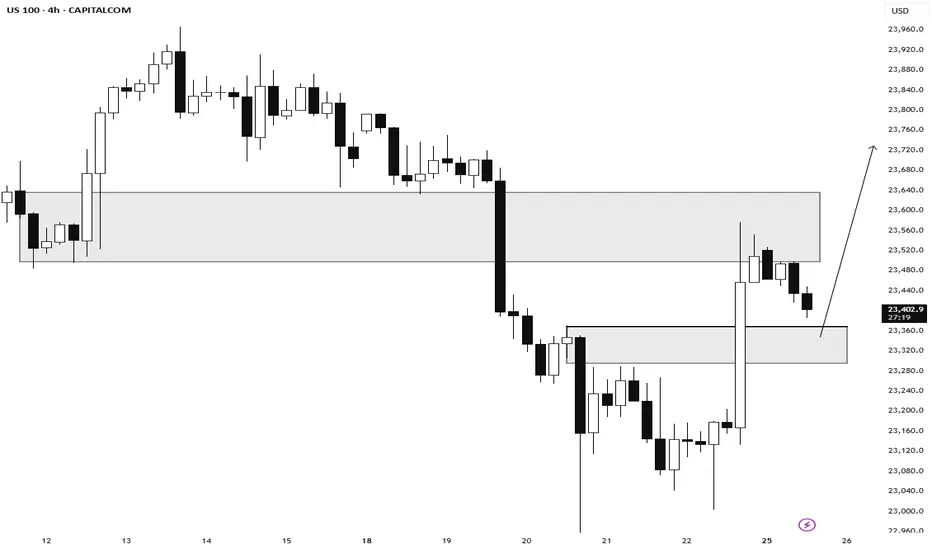
nas bullnas will continue bullish momentum to the major resistance levels after this lower time frame consolidation .. not financial advice

watch 23,280–23,755 for the next impulse
### 🧭 US100 – Daily Game Plan
**Timeframe:** 1D (structure) + 4H (triggers)
**TL;DR:** Price is coiling near a prior swing zone. I’m watching a break-and-retest for continuation, or a failure back into the range for a mean-revert move. Not financial advice—educational levels only.
---
#### 📊 Market Picture
* Trend on higher TFs remains **up** while price holds above the most recent higher-low area.
* Momentum cooled after the last impulse; candles tightened → **volatility compression**.
* The **50-day MA** sits just below current structure and is my bull/bear divider.
> **Chart setup I’m using:** AlgoFlex Ai S&R indicator (free indicator based on our Ai Model), a simple swing-structure tool (HH/HL/LH/LL).
---
#### 🧱 Key Areas I Care About
* **Resistance box:** prior swing high cluster (where we failed last attempt).
* **Support box:** last demand wick + 50-DMA zone.
* **Line in the sand:** a daily close beyond either box sets the next leg.
*(Mark these boxes on your chart before trading—numbers change daily; structure doesn’t.)*
---
#### 🎯 My Playbook
**Continuation (bullish):**
1. 4H **close above resistance box**
2. **Retest holds** as support
3. Enter on reclaim with risk below the retest low → scale at prior highs / round number
**Fade/Breakdown (bearish):**
1. Rejection wick at resistance **or** daily **close below support box**
2. Look for **lower-high** on 4H to confirm shift
3. Target the 50-DMA first; deeper move only if structure stays weak
---
#### ⚠️ Risk Management
* No entries into high-impact news (FOMC, CPI, NFP).
* Size ≤ 1R per idea; invalidate quickly if we close back inside the range after a breakout.
* If the first breakout is a **fake-out**, stand aside and let structure reset.
---
#### 📚 Education Note
This post is for study and discussion. Everyone manages their own risk and decisions.
---
#### 🧰 About My Tools
I develop **AlgoFlex**—a suite of **invite-only TradingView scripts**: **Scalping, Forex, Commodities, Indices, Crypto**.
**One subscription = full access.**
If you want to explore how I build these setups, check my **profile → Scripts**
---
👍 If this helped, drop a like/comment and tell me which timeframe you want next (4H or 1H).
\#US100 #Nasdaq100 #PriceAction #SupportResistance #50DMA #RiskManagement #AlgoFlex

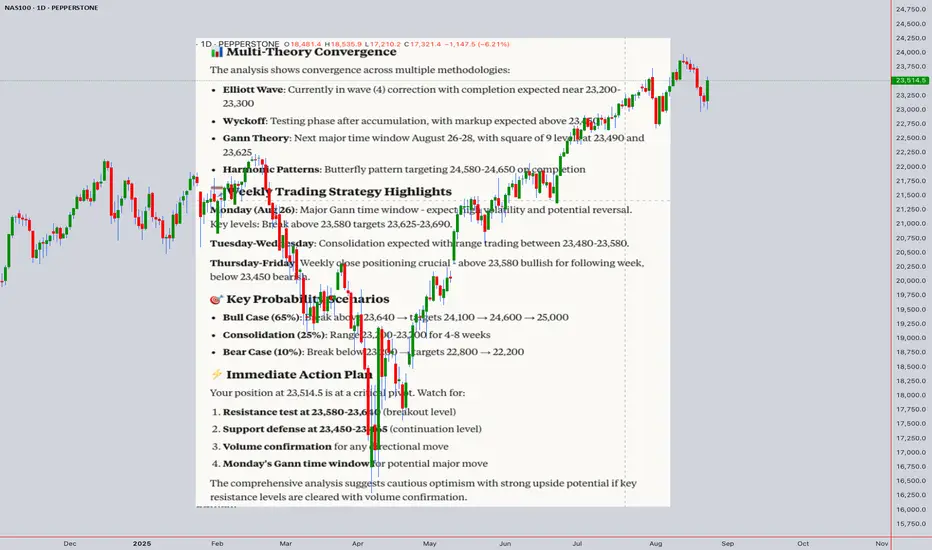
NAS100 Comprehensive Technical Analysis & Daily Trading Strategy# NAS100 Comprehensive Technical Analysis & Daily Trading Strategy
**Current Position**: 23,514.5 (Aug 23, 2025, 12:50 AM UTC+4)
* 🎯 Executive Summary
Multi-theory convergence analysis indicates NAS100 at critical inflection point with 65% probability of upward continuation to 24,000-24,600 zone, contingent on breaking 23,640 resistance.
---
# 📊 MULTI-TIMEFRAME TECHNICAL ANALYSIS
**INTRADAY ANALYSIS (5M - 4H)**
**5-Minute Timeframe Analysis**
** Candlestick Patterns
*Current Formation**: Potential inside bar consolidation
*Key Patterns to Watch**: Hammer/Doji near 23,500 (bullish), Shooting star above 23,580 (bearish)
*Volume Confirmation**: Required for breakout validation
** Technical Indicators
*RSI(14)**: ~48-52 (Neutral zone, watch for divergence)
*VWAP**: 23,508 ± 15 (Dynamic S/R level)
*Bollinger Bands**: Squeeze pattern suggesting breakout imminent
*EMA(20)**: 23,495 (immediate support/resistance)
**15-Minute Timeframe Analysis**
** Harmonic Patterns
*Active Pattern**: Potential ABCD completion at 23,350-23,380
*Butterfly Pattern**: Target projection 24,580-24,650
*Fibonacci Confluence**: 61.8% retracement at 23,420
** Wyckoff Analysis
*Phase**: Testing phase after potential accumulation
*Volume**: Decreasing on declines (bullish sign)
*Price Action**: Higher lows formation developing
*Next Expected**: Markup phase if 23,450 holds
**30-Minute Timeframe Analysis**
** Elliott Wave Count
*Primary Count**: Wave (4) correction nearing completion
- Wave A: 23,690 → 23,350
- Wave B: 23,350 → 23,580 (current)
- Wave C Target: 23,200-23,300
*Alternate Count**: Wave (5) impulse beginning
- Target: 24,200-24,600
** W.D. Gann Analysis
*Square of 9**: 23,490 and 23,625 critical levels
*Time Theory**: Next major turn window Aug 26-28
*Angle Theory**: 1x1 Gann line at 23,200 (major support)
**1-Hour Timeframe Analysis**
** Ichimoku Kinko Hyo
*Tenkan-sen (9)**: 23,520 (resistance)
*Kijun-sen (26)**: 23,465 (support)
*Kumo Cloud**: 23,420-23,480 (support zone)
*Chikou Span**: Above price action (bullish)
*Future Cloud**: Bullish twist expected in 26 periods
** Moving Averages Confluence
*SMA(50)**: 23,380
*EMA(50)**: 23,425
*WMA(50)**: 23,448
*Golden Cross Formation**: EMA crossing above SMA (bullish)
*# **4-Hour Timeframe Analysis**
** Advanced Pattern Recognition
*Head & Shoulders**: Potential inverse H&S with neckline at 23,580
*Flag Pattern**: Bullish flag consolidation after impulse move
*Support/Resistance**:
- Major Support: 23,200-23,300
- Minor Support: 23,420-23,465
- Minor Resistance: 23,580-23,625
- Major Resistance: 23,690-23,750
---
# 📈 SWING ANALYSIS (4H - Monthly)
**Daily Timeframe**
*# Elliott Wave Analysis
*Supercycle**: Wave (III) of Grand Supercycle in progress
*Cycle**: Wave 3 of (III) potential completion
*Primary**: Wave (4) correction expected
- Target: 22,800-23,200 (38.2%-50% Fibonacci)
- Duration: 3-8 weeks
- Pattern: Likely flat or triangle
*# Wyckoff Market Structure
*Phase**: Distribution testing vs. Reaccumulation
*Volume Profile**: High volume nodes at 23,300 and 22,800
*Composite Man Activity**: Accumulation signs if above 23,200
*Spring/Upthrust**: Watch for false breakdowns below 23,200
*# Gann Time & Price Forecasting
*Time Cycles**:
- 90-day cycle: Peak expected late August
- 180-day cycle: Next major turn October 2025
*Price Squares**:
- 23,400 = 153² ÷ 10
- 24,000 = 155² ÷ 10
- 25,000 = 158² ÷ 10
**Weekly Timeframe**
*# Long-term Elliott Wave
*Grand Supercycle**: Wave III from 2009 lows
*Supercycle**: Wave (3) extension phase
*Cycle**: Wave 3 of (3) nearing completion at 25,000-26,000
*# Harmonic Analysis
*Shark Pattern**: Completion at 25,200-25,400
*Crab Pattern**: Deep retracement target 20,800-21,500
*ABCD Extensions**: 1.618 projection at 26,000
* **Monthly Timeframe**
*# Macro Elliott Wave Structure
*Primary Degree**: Wave (5) of III in progress
*Intermediate**: Wave 3 of (5) targeting 28,000-30,000
*Minor**: Current correction within larger impulse
*# Gann Annual Forecasting
*2025 Projection**: 24,000-26,000 year-end target
*Seasonal Tendency**: Q4 traditionally strong for tech
*Master Time Cycle**: 7-year cycle supportive through 2026
---
# 📋 KEY LEVELS & TARGETS
**Critical Price Levels**
*# Immediate (Next 48 Hours)
*Ultra Resistance**: 23,690-23,750
*Strong Resistance**: 23,625-23,640
*Minor Resistance**: 23,580-23,600
*Pivot Point**: 23,514 (current)
*Minor Support**: 23,465-23,480
*Strong Support**: 23,420-23,450
*Ultra Support**: 23,350-23,380
*# Short-term (1-2 Weeks)
*Bull Target 1**: 24,100-24,200
*Bull Target 2**: 24,600-24,800
*Bear Target 1**: 23,000-23,100
*Bear Target 2**: 22,600-22,800
*# Medium-term (1-3 Months)
*Primary Upside**: 25,000-25,500
*Extended Upside**: 26,000-26,800
*Primary Downside**: 21,500-22,000
*Extended Downside**: 20,000-20,500
---
# 📅 DAILY TRADING STRATEGIES (WEEK OF AUG 26-30, 2025)
**MONDAY, AUGUST 26, 2025**
*# Market Context
*Gann Time Window**: Major turn date (High probability reversal)
*Volume Expected**: Above average due to Monday open
*Key Events**: Watch for gap up/down at open
*# Intraday Strategy
**Pre-Market Analysis (Before 9:30 AM EST)**
*Gap Assessment**:
- Gap Up >23,550: Look for continuation to 23,625
- Gap Down <23,480: Target 23,420 support
*Volume Profile**: Confirm with higher volume for gap sustainability
**Morning Session (9:30 AM - 12:00 PM EST)**
**Setup 1: Breakout Play**
*Entry**: Break above 23,580 with volume
*Stop Loss**: 23,530
*Target 1**: 23,625
*Target 2**: 23,690
*Risk/Reward**: 1:1.8
**Setup 2: Support Bounce**
*Entry**: Bounce from 23,450-23,465 zone
*Stop Loss**: 23,420
*Target 1**: 23,520
*Target 2**: 23,580
*Risk/Reward**: 1:2.6
**Afternoon Session (12:00 PM - 4:00 PM EST)**
**Setup 3: Range Trading**
*Buy Zone**: 23,465-23,485
*Sell Zone**: 23,565-23,585
*Stops**: Outside range by 25 points
*Scalping Opportunity**: 5-15 minute timeframes
**Daily Risk Management**
*Max Risk**: 2% of account
*Position Size**: Adjust for increased volatility (Gann date)
*News Watch**: Fed officials' speeches, tech earnings
---
**TUESDAY, AUGUST 27, 2025**
*# Market Context
*Technical Focus**: Follow-through from Monday's action
*Volatility**: Expected to decrease from Monday
*Pattern Completion**: Watch for harmonic pattern triggers
*# Intraday Strategy
** **Pre-Market Setup**
*Trend Continuation**: If Monday bullish, look for higher lows
*Reversal Signs**: If Monday bearish, watch for oversold bounce
** **Trading Sessions**
**Setup 1: Trend Following**
*Bullish Scenario**:
- Entry: Pullback to 23,500-23,520
- Stop: 23,465
- Targets: 23,625, 23,700
*Bearish Scenario**:
- Entry: Rally to 23,540-23,560
- Stop: 23,590
- Targets: 23,450, 23,380
**Setup 2: Wyckoff Spring/Upthrust**
*Spring Play**: False break below 23,420, quick reversal
*Upthrust Play**: False break above 23,640, quick rejection
*High probability setups with tight stops**
---
**WEDNESDAY, AUGUST 28, 2025**
*# Market Context
*Mid-week Dynamics**: Typically consolidation day
*Technical Pattern**: Triangle/flag pattern completion expected
*Volume**: Usually lower, range-bound trading likely
*# Intraday Strategy
**Setup 1: Breakout Preparation**
*Consolidation Range**: 23,480-23,580
*Volume Spike Required**: For any breakout attempt
*False Breakout Fades**: High probability trades
**Setup 2: Scalping Strategy**
*Timeframe**: 5-15 minutes
*Range**: 23,500-23,550
*Multiple small profits**: 15-25 point targets
*Tight stops**: 10-15 points maximum
---
**THURSDAY, AUGUST 29, 2025**
*# Market Context
*Elliott Wave**: Potential completion of correction wave
*Momentum Building**: For Friday breakout
*Options Activity**: Weekly expiration influence
*# Intraday Strategy
**Setup 1: Pre-Breakout Positioning**
*Accumulation Zone**: 23,450-23,500
*Distribution Zone**: 23,580-23,630
*Position for Friday's move**
**Setup 2: Momentum Trading**
*Morning Gap**: Trade in direction of gap
*Volume Confirmation**: Essential for sustainability
*Extended Targets**: If momentum strong
---
**FRIDAY, AUGUST 30, 2025**
*# Market Context
*Week-End Positioning**: Major moves often occur
*Monthly Close**: Important for larger timeframe analysis
*High Volume Expected**: Options expiration
*# Intraday Strategy
**Setup 1: Weekly Close Play**
*Above 23,580**: Bullish for next week, target 23,700-23,800
*Below 23,450**: Bearish setup, target 23,300-23,200
*Volume Crucial**: For weekly close significance
**Setup 2: Gap & Go/Gap & Reverse**
*Gap Analysis**: Size and volume determine strategy
*Large Gap**: Look for exhaustion and reversal
*Small Gap**: Expect filling and continuation
---
# ⚠️ RISK MANAGEMENT FRAMEWORK
**Position Sizing Formula**
*Conservative**: (Account Size × 1%) ÷ Stop Loss Distance
*Moderate**: (Account Size × 2%) ÷ Stop Loss Distance
*Aggressive**: (Account Size × 3%) ÷ Stop Loss Distance
**Daily Limits**
*Maximum Daily Loss**: 3% of account
*Maximum Positions**: 3 concurrent trades
*Win Rate Target**: >55% (Given R:R ratios)
**Technical Stop Levels**
*5M Chart**: Beyond recent high/low + spread
*15M Chart**: Beyond support/resistance + 15 points
*1H Chart**: Beyond key levels + 25 points
*4H Chart**: Beyond major levels + 40 points
---
# 📈 PROBABILITY MATRIX & SCENARIOS
**Scenario Analysis**
*# **Bull Case (65% Probability)**
*Catalyst**: Break above 23,640 with volume
*Targets**: 24,100 → 24,600 → 25,000
*Timeline**: 2-6 weeks
*Volume Profile**: Above average confirmation needed
**Consolidation Case (25% Probability)**
*Range**: 23,200-23,700
*Duration**: 4-8 weeks
*Pattern**: Triangle or flag formation
*Resolution**: Eventually bullish
**Bear Case (10% Probability)**
*Catalyst**: Break below 23,200 with volume
*Targets**: 22,800 → 22,200 → 21,500
*Timeline**: 3-10 weeks
*Warning Signs**: Distribution volume patterns
---
# 📊 WEEKLY PERFORMANCE TRACKING
**Key Metrics to Monitor**
*Win Rate**: Target >55%
*Average Risk/Reward**: Target >1:2
*Maximum Drawdown**: Limit to 5%
*Sharpe Ratio**: Track risk-adjusted returns
*Best/Worst Days**: Analyze for patterns
**Weekly Review Questions**
1. Were stop losses appropriate for volatility?
2. Did volume confirm price movements?
3. Which timeframe analysis was most accurate?
4. What patterns repeated throughout the week?
5. How did news events impact technical levels?
---
# 🚨 CRITICAL ALERTS & WATCHPOINTS
**Immediate Alerts (Next 24-48 Hours)**
*23,640 Break**: Bullish acceleration likely
*23,420 Break**: Correction deepening
*Volume Spike**: >150% average confirms breakout
*News Flow**: Fed communications, tech earnings
**Weekly Watchpoints**
*Elliott Wave Count**: Validation/invalidation levels
*Harmonic Pattern Completion**: Entry opportunities
*Gann Time Windows**: Reversal probability
*Wyckoff Phases**: Institutional behavior clues
**Monthly Considerations**
*Seasonal Patterns**: September historically weak
*Options Expiration**: Third Friday volatility
*Earnings Season**: Individual stock impacts on index
*Federal Reserve**: Policy meeting outcomes
---
**⚡ FINAL NOTE**: This analysis represents a convergence of multiple technical methodologies. Always combine with fundamental analysis and maintain strict risk management. Market conditions can change rapidly, requiring strategy adjustments.
For those interested in further developing their trading skills based on these types of analyses, consider exploring the mentoring program offered by Shunya dot Trade.(world wide web shunya dot trade)
I welcome your feedback on this analysis, as it will inform and enhance my future work.
Regards,
Shunya.Trade
world wide web shunya dot trade
⚠️ Disclaimer: This post is educational content and does not constitute investment advice, financial advice, or trading recommendations. The views expressed here are based on technical analysis and are shared solely for informational purposes. The stock market is subject to risks, including capital loss, and readers should exercise due diligence before investing. We do not take responsibility for decisions made based on this content. Consult a certified financial advisor for personalized guidance.
Nasdak FULL BUYwe are going bullish soon be ready to take off , the nasdaq is fundamentally getting out from a potzntial crisis

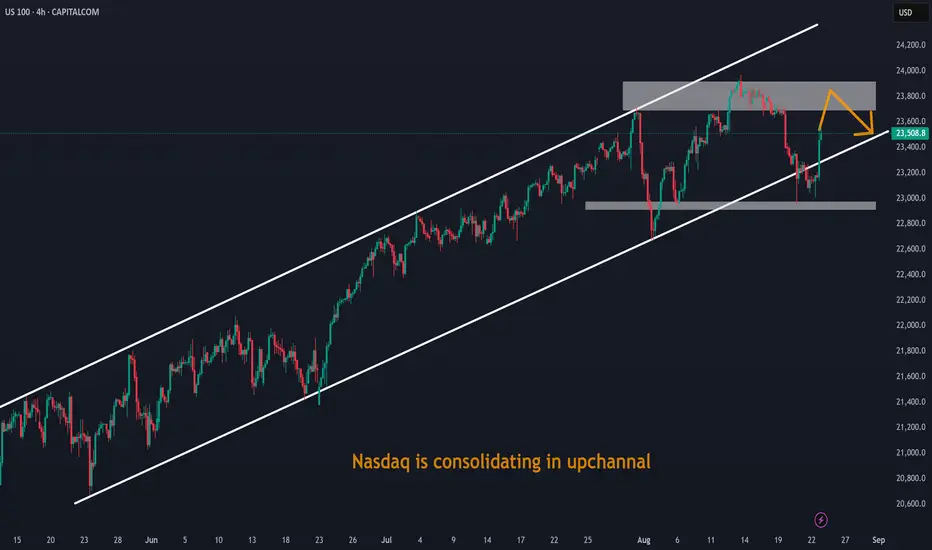
Nasdaq is consolidating in upchannalNasdaq is consolidating in upchannal. Furthur course of price action will be decided by dollar strenth.
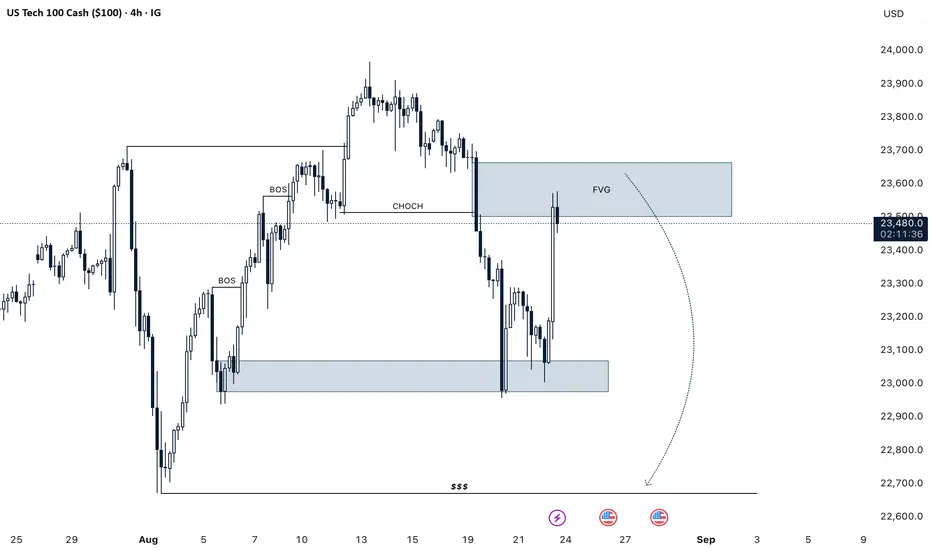
NASDAQ H4 We Are Selling Nasdaq Here Due To Market Structure Changed Bullish To Bearish NQ Gives Us Bearish Choch And Fair Value Gap Thats We Are Selling NQ Right Now Targeting Sell Sides Liquidity
Manage Your Trade According To Your Capital
And Follow Us For More Trades
NSDQ100 awaits Fed Powwell's tone at Jackson Hole Key Drivers
Powell @ Jackson Hole (10am EST):
July FOMC was hawkish on labour, but payroll revisions weaker since → tone today could soften.
Market focus: whether Powell leans on labour weakness vs still-solid inflation & activity.
Outcome = pivotal for Fed cut expectations and tech valuations.
Macro/Policy Noise:
Halts & policy risks: immigration and visa restrictions could tighten labour supply, indirectly feeding wage/inflation concerns. NIH funding cuts add fiscal uncertainty.
Geopolitical chip tension: Nvidia halting H20 AI chip production under Beijing pressure raises supply-chain risk. Negative for semi names in the NASDAQ-100 (NVDA, AMD, AVGO).
US stance on chipmakers: No forced equity stakes → removes one overhang, but policy risk still high.
NASDAQ-100 Implications
Powell dovish → likely risk-on, tech rally (rate-sensitive growth).
Powell hawkish / inflation-first → risk-off, higher yields weigh on big tech multiples.
Chip news: Nvidia headline is a near-term drag; could spill over to the semiconductor complex (SOX index).
Net read:
Short-term cautious bias into Powell due to Nvidia headline + policy noise.
Direction after 10am EST depends on Fed tone—dovish shift = upside reversal, hawkish = further pressure on NASDAQ-100.
Key Support and Resistance Levels
Resistance Level 1: 23480
Resistance Level 2: 23720
Resistance Level 3: 23950
Support Level 1: 23100
Support Level 2: 22985
Support Level 3: 22740
This communication is for informational purposes only and should not be viewed as any form of recommendation as to a particular course of action or as investment advice. It is not intended as an offer or solicitation for the purchase or sale of any financial instrument or as an official confirmation of any transaction. Opinions, estimates and assumptions expressed herein are made as of the date of this communication and are subject to change without notice. This communication has been prepared based upon information, including market prices, data and other information, believed to be reliable; however, Trade Nation does not warrant its completeness or accuracy. All market prices and market data contained in or attached to this communication are indicative and subject to change without notice.
