NASDAQ formed its 1st 4H Golden Cross in 7 months!Nasdaq (NDX) completed last Friday its first 4H Golden Cross formation in more than 7 months (since May 01). This is taking place while the index is inside a Channel Up, making a V-shaped recovery from the November 21 Low.
The last time all the above conditions were fulfilled was exactly during the May Golden Cross. With the 4H MA200 (orange trend-line) as its Support, the index eventually hit its previous All Time High (ATH).
As we've entered the Fed week, we can finally see this move to the ATH Resistance, so our short-term Target on Nasdaq remains 26200.
---
** Please LIKE 👍, FOLLOW ✅, SHARE 🙌 and COMMENT ✍ if you enjoy this idea! Also share your ideas and charts in the comments section below! This is best way to keep it relevant, support us, keep the content here free and allow the idea to reach as many people as possible. **
---
💸💸💸💸💸💸
👇 👇 👇 👇 👇 👇
Market insights

USNAS100 | Momentum Builds Above Key PivotUSNAS100 – Technical Overview
USNAS100 is showing signs of stability above the pivot line at 25730.
As long as the price holds above this level, bullish momentum is expected to continue toward 25880 and 25980, with potential extension toward 26200.
However, a 1H or 4H candle close below 25730 will activate bearish momentum, opening the way toward 25570 and 25430, with deeper downside possible into 25210 if selling pressure increases.
Key Levels
Pivot Line: 25730
Resistance: 25880 · 25980 · 26200
Support: 25570 · 25430 · 25210

NAS 100Am bullish until the target high is swept. I'll drop any lowertimeframe buys when I spot one.

NAS100 Trade Opportunity: Will Buyers Defend the Pullback?📊 NAS100 (NASDAQ-100) Swing Trade Opportunity 🚀
Bullish Pullback Setup | Super Trend ATR + TMA Confirmation
🎯 TRADE SETUP OVERVIEW
Instrument: NAS100 (NASDAQ-100 Index)
Timeframe: Swing Trade (4H-Daily)
Bias: BULLISH ✅
Setup Type: Super Trend ATR Line Pullback + Triangular Moving Average (TMA) Confirmation
🎬 ENTRY STRATEGY - "LAYERING METHOD" 📍
This strategy employs multiple limit order placement (Layer Entry Technique) to optimize entry points during the pullback phase.
Recommended Layer Entry Points:
🔵 Layer 1: 24,500
🔵 Layer 2: 24,600
🔵 Layer 3: 24,700
🔵 Layer 4: 24,800
⚡ Pro Tip: Scale layers based on your account size and risk tolerance. Each layer reduces average entry price.
🛑 STOP LOSS (SL)
Primary SL Level: 24,300
Strategy: Placed below the latest swing low + Super Trend confirmation
⚠️ DISCLAIMER: This SL is a guideline only. You must adjust based on your personal risk management strategy and account equity. Risk is YOUR responsibility.
🎁 PROFIT TARGETS (TP)
PRIMARY TARGET (TP1): 25,700 🎯
First resistance zone
Ideal for taking partial profits
Recommended exit: 30-50% position
SECONDARY TARGET (TP2): 26,200 🔥
Strong resistance + Historical overbought zone
⚠️ TRAP ALERT: Expect potential reversal or consolidation
Recommended exit: Remaining 50-70% position
Use trailing stop for final portion
📈 TECHNICAL CONFIRMATION
✅ Super Trend ATR: Aligned bullish
✅ TMA (Triangular MA): Pullback to key level confirmed
✅ Higher Lows Pattern: Intact
✅ Volume Analysis: Supporting move
🔗 RELATED PAIRS TO WATCH 💡
Positive Correlation (Move Together):
🔴 SPY (S&P 500 ETF) - $380-395 Range
Correlation: +0.92 | Often leads NAS100 lower-cap stocks
Key Point: If SPY breaks $390, expect NAS100 momentum confirmation
Watch for divergence signals
🔴 QQQ (Invesco QQQ Trust - Nasdaq 100 ETF) - $450-470 Range
Correlation: +0.99 | DIRECT tracking of NAS100
Key Point: Primary barometer for Nasdaq sentiment
Use for volume + volatility confirmation
🔴 TECH Sector ETF (XLK) - $205-215 Range
Correlation: +0.88 | Tech-heavy holdings overlap
Key Point: Tech rotation affects Nasdaq flow
Monitor for sector strength/weakness
Inverse Correlation (Move Opposite):
🔵 DXY (US Dollar Index) - $103-106 Range
Correlation: -0.65 | Stronger dollar = Risk-off mood
Key Point: If DXY spikes, expect NAS100 pullback extension
Monitor Fed rate expectations
🔵 TLT (20+ Year Treasury ETF) - $75-80 Range
Correlation: -0.58 | Rising yields hurt growth stocks
Key Point: Check 10Y yield trend for rate pressure
Watch Fed policy announcements
Key Monitoring Points:
📌 Earnings Season Impact: Tech earnings can create ±2% moves
📌 Fed Minutes/Announcements: Watch for rate guidance changes
📌 Market Breadth: Compare Advance/Decline lines for confirmation
📌 Volatility Index (VIX): Levels above 20 = Caution; Below 15 = Risk-on
📋 BEFORE YOU TRADE - CHECKLIST ✅
Is price currently at/near Layer 1 entry (24,500)?
Does current 4H chart show TMA pullback + Super Trend confluence?
Is volume confirming the setup?
Have you set your SL below 24,300?
Do you understand you're risking X to make Y?
Is this aligned with your trading plan?
🎓 FINAL NOTES
This is a mechanical swing trade setup designed for traders who use limit orders and layering technique. The confluence of Super Trend ATR + TMA creates higher probability entries during bullish pullbacks.
Remember: Trading involves substantial risk of loss. This idea is shared for educational analysis. Your trading decisions are YOUR responsibility alone.
Happy Trading! 🚀💎

Will NAS100 Sustain Its Bullish Momentum After the Pullback?NAS100 🚀 Bullish Swing Setup | SuperTrend Pullback & Layered Entry Strategy
🎯 TRADE IDEA: NAS100 (US100) BULLISH SWING
Capitalize on a structured pullback in the NASDAQ 100! This plan leverages a proven indicator confluence for a high-probability long opportunity.
📊 ANALYSIS & CONFIRMATION:
Trend: Primary Bullish Trend is intact. ✅
Trigger: Price is pulling back into a demand zone, offering a favorable risk-to-reward entry.
Indicator: The SuperTrend ATR Line is acting as dynamic support on the 4H/Daily timeframe. A bounce from this level confirms our bullish bias.
⚡ STRATEGY: "THE THIEF" LAYERED ENTRY
This method uses multiple limit orders to average into a position, perfect for volatile markets like the NASDAQ.
Entry Zone: Look for entries between 25,200 - 25,600
Layer Example:
🟢 Limit Order 1: 25,600
🟢 Limit Order 2: 25,400
🟢 Limit Order 3: 25,200
👉 You can adjust the number of layers and prices based on your capital and risk appetite.
❗ RISK MANAGEMENT:
Stop Loss (SL): A decisive break below 24,800 would invalidate the bullish structure.
⚠️ IMPORTANT NOTE: This is MY protective stop. Dear Thief OG's 👑, you MUST adjust your position size and SL based on your personal risk management strategy. Protect your capital first!
🎯 PROFIT TARGETS:
Primary Target: 25,600 (Initial resistance & profit-taking zone).
Key Reasoning: We anticipate a reaction here due to:
Moving Average resistance.
Potential overbought conditions on lower timeframes.
A "trap" for late buyers.
👉 Smart Move: Consider taking partial profits at 25,600 and trailing your stop for the remainder. Escape the trap with your profits! 💰
⚠️ REMINDER: Dear Thief OG's 👑, your Take Profit (TP) is your own decision. Secure gains based on your trading plan and market behavior.
🔍 RELATED ASSETS & MARKET CORRELATION:
Watching these related instruments can provide confirmation and a broader market view.
TVC:DXY (U.S. Dollar Index): 🟡 NEGATIVE CORRELATION
A weakening Dollar ( TVC:DXY DOWN) is generally bullish for Nasdaq. If the Dollar is falling, it adds confidence to this long thesis.
USTECH (CFD on Nasdaq 100): 🟢 DIRECT CORRELATION
Moves in sync with NAS100. Perfect for cross-verifying price action and volume.
NASDAQ:AAPL , NASDAQ:MSFT , NASDAQ:TSLA (Mega-Caps): 🟢 HIGH IMPACT
These heavily weighted Nasdaq components drive the index. Bullish momentum in these stocks supports a rising NAS100.
FOREXCOM:SPX500 (S&P 500): 🟢 POSITIVE CORRELATION
A strong S&P 500 often lifts the Nasdaq. Monitor for overall U.S. market strength.
💬 Let me know your thoughts in the comments!
What's your entry strategy for the NAS100 this week?
#NAS100 #US100 #TradingView #SwingTrading #Bullish #SuperTrend #TradingStrategy #IndexTrading #LayeredEntry #ThiefStrategy

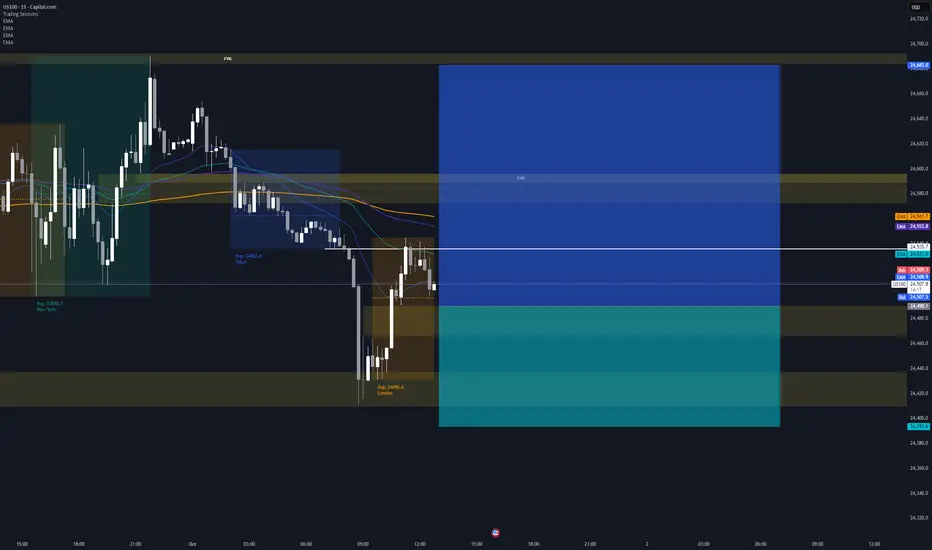
Nas to ATHHere is the evidence from the chart supporting a "dip to POC and rally" scenario rather than a drop to VAL as I previously thought could happen:
firstly the change in Momentum (Min Delta Analysis)
The most telling clue is the Min Delta row (the lowest point of net selling during the session).
Previous Days: In the middle of the rally, sellers were able to push Delta down slightly (e.g., -1,291 or -273) before buyers took over.
Latest Session (Far Right int table ): The Min Delta is +1,479.1. This is extremely bullish. It means that from the moment the session opened, aggressive buyers were so dominant that the cumulative delta never even went negative.
my view is that Sellers are currently too weak to push price down deep. A drop to 25,100 would require significant selling pressure that simply isn't present right now.
secondly building a Floor with POCs
The Point of Control has been stepping up clearly, acting as a support ladder:
key points: Breakout started after 25,300 - Consolidated at 25,575 (held for two sessions) - Current POC moved up to 25,685.
If the price pulls back, it will likely find strong support at the 25,575 node (the high-volume ledge) or, at worst, the breakout origin at 25,300
in my view the The Likely Scenario
More Likely: Price dips into the 25,575 – 25,685 area (current and previous POCs) where passive buyers are waiting to reload, followed by a continuation up.
Less Likely: A drop to 25,300. This level is now far below the active auction. For price to visit there, we would need to see a day with massive negative Delta (e.g., -5k or more) to erase the last four days of buying progress.

nas100 1h🔹 Overall Outlook and Potential Price Movements
In the charts above, we have outlined the overall outlook and possible price movement paths.
As shown, each analysis highlights a key support or resistance zone near the current market price. The market’s reaction to these zones — whether a breakout or rejection — will likely determine the next direction of the price toward the specified levels.
⚠️ Important Note:
The purpose of these trading perspectives is to identify key upcoming price levels and assess potential market reactions. The provided analyses are not trading signals in any way.
✅ Recommendation for Use:
To make effective use of these analyses, it is advised to manually draw the marked zones on your chart. Then, on the 5-minute time frame, monitor the candlestick behavior and look for valid entry triggers before making any trading decisions.

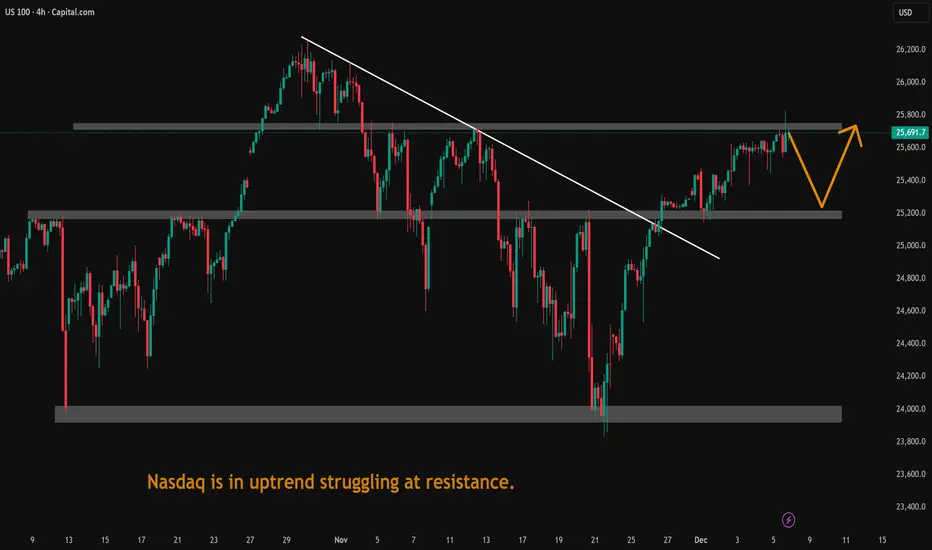
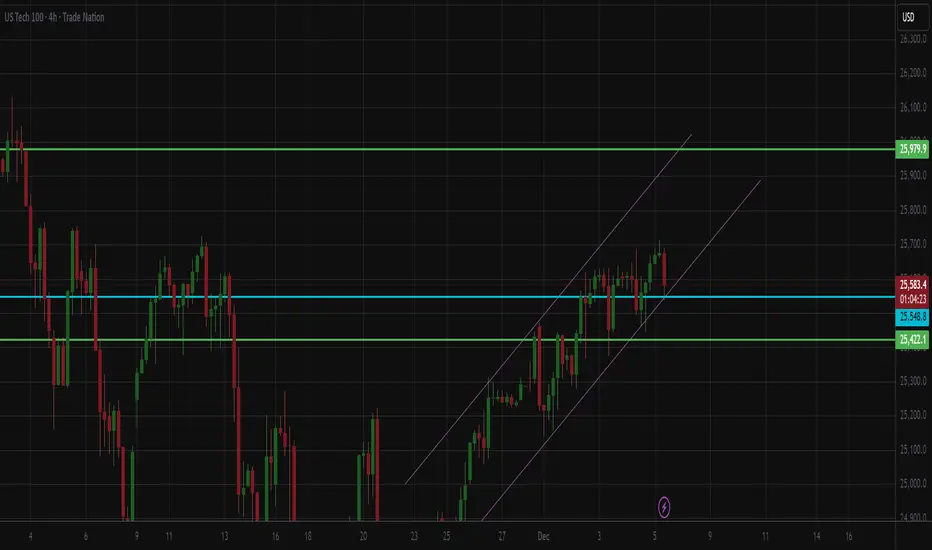
Nasdaq is in uptrend struggling at resistance.Nasdaq is in uptrend struggling at resistance. It may retace next week.

Bullish bias on NAS100This is what I think might happen over the course of next week. I identified a hidden OB at the 25200 area that might get mitigated before it produces the next leg up. Price might break through the OB and tap into the low volume node. The overall trend remains bullish and there is no reason to assume a reversal is incoming.
The formation of a HL would be very welcome before a potential christmas rally starts.
For now, alerts are set

Nasdaq : 24,000 Holds Strong — Next Stop 25,800?Price action on the Nasdaq 100 is telling a clear story: 24,000 (AVWAP + HVN confluence + Round number) is acting like a magnet for institutional buyers.
This suggests that accumulation is happening at these levels, positioning for a potential run toward 25,800 if momentum holds.
Are we front-running a breakout, or should we wait for confirmation above 25,000 first?

NAS Short/Long 05/12/2025Short DC1 on the M15 after tapping M15 break level, then rejecting back to H1 hold.
Closed the position once realised price was rejecting off M15 hold.
Long once above the daily open upon printing of AS4 on the M1

NSDQ100 positive lead from futures and improving risk sentimentUS markets saw a modest risk-on tone yesterday as stronger-than-expected labour data pushed investors to price in fewer Fed rate cuts for next year. That supported equities, with the S&P 500 extending its winning streak, and futures are pointing to further upside this morning. This provides a supportive near-term backdrop for the Nasdaq 100 into today’s session.
However, the hawkish repricing in rates is a growing headwind for tech. The 10-year Treasury yield rose to a two-week high of 4.10%, and global bond yields continued to climb, amplified by renewed expectations of a Bank of Japan rate hike. Rising long-end yields typically pressure rate-sensitive growth stocks, which could cap upside in the Nasdaq despite positive futures.
The drop in jobless claims to 191k reinforces the view that the US labour market remains resilient, supporting risk appetite but also reducing the urgency for Fed easing. That combination often favours cyclicals over long-duration tech when yields are rising.
On the corporate side, Netflix is in focus following reports of exclusive talks to acquire Warner Bros. Discovery’s studios and HBO Max. This could drive sector-specific volatility across streaming and media names, with potential spillovers into Nasdaq sentiment.
Broader risk sentiment remains constructive, with the VIX slipping to a two-month low, and the continued rally in US transport stocks signalling confidence in economic momentum. That supports equities overall, but the Nasdaq’s direction today is likely to hinge on bond yields:
Stable or lower yields would allow tech to participate in the broader rally.
Further yield upside risks triggering profit-taking in mega-cap growth.
Bottom line: The Nasdaq 100 opens with a positive lead from futures and improving risk sentiment, but rising global bond yields remain the key short-term risk to sustained upside. Streaming and large-cap tech could see elevated volatility today.
This communication is for informational purposes only and should not be viewed as any form of recommendation as to a particular course of action or as investment advice. It is not intended as an offer or solicitation for the purchase or sale of any financial instrument or as an official confirmation of any transaction. Opinions, estimates and assumptions expressed herein are made as of the date of this communication and are subject to change without notice. This communication has been prepared based upon information, including market prices, data and other information, believed to be reliable; however, Trade Nation does not warrant its completeness or accuracy. All market prices and market data contained in or attached to this communication are indicative and subject to change without notice.

Buy Tech100 Futures for a swing long. Nasdaq is on the way UP and here is a pullback where you can enter for a 1:3 RR. I believe Tech100 is gunning for 26000, so I will be sitting on this position for the whole next week (hopefully). Probably adding to it if it moves in my favor with a clear bull signal.
NAS100 Trade Set Up Dec 5 2025Price has shifted to bearish structure and is targeting SSL and PDL but first i will wait for more internal structure on the 15m-5m to continue lower

USNAS100 | Watching 25740 After Resistance ReactionUSNAS100 – Technical Overview
USNAS100 has already reached the 25730 resistance highlighted in the previous analysis.
For today, the index is expected to trade with bearish momentum while below 25740, with price likely to test 25570.
A 1H close below 25570 is required to confirm continuation of the bearish trend toward 25430.
However, if the market closes a 1H candle above 25740, bullish momentum will return, opening the way toward 25980 and higher resistance levels.
Key Levels
Pivot Line: 25740
Resistance: 25880 · 25985 · 26170
Support: 25570 · 25470 · 25330
previous idea:

Nasdaq shorts pendingOkay okay 👌🏽
$25k FLAT is what she’s hunting.
In a crucial handle as we speak and I am personally looking for some work into $26,970 early next week before bleeding this thing off into target..
Nothing more to say, keep it simple. Same goes for us30, she’s in the same boat for shorts 🩳 …
Tab up 650-690 and hopefully we can see her make a move upside to set it up?!
If not. Flip the script and play this in reverse.. ⏮️
Profile be up on next week. Watch people….
LFG 👽 🫶🏽

Nq longIf price goes back down, i'll likely take this trade. seems strong volume here, plus Japan likely to buy NQ too in their morning.
if price goes back all the way all time high, cancel this trade.

NAS100 Bullish Setup on 1hrNAS100 Bullish Setup on 1hr
Bullish Setup presented on 1hr
- Bullish divergence
- 1hr FVG created in this crazy sell off
- 1hr unfinished candle at my TP level
Entry: 24160
TP: 25000
SL: 23980
RR: 1:5.71

NASDAQDO YOU KNOW WHATS BEHIND THIS OR OTHER IDEAS?? in bio..
Preferably suitable for scalping and accurate as long as you watch carefully the price action with the drawn areas.
With your likes and comments, you give me enough energy to provide the best analysis on an ongoing basis.
And if you needed any analysis that was not on the page, you can ask me with a comment or a personal message.
Enjoy Trading ;)

NAS100 Trade Set Up Dec 4 2025Price remains bullish breaking structure and making HH so i will want to see a tap into demand and internal 1m-5m bullish structure to take buys to BSL and daily FVG above

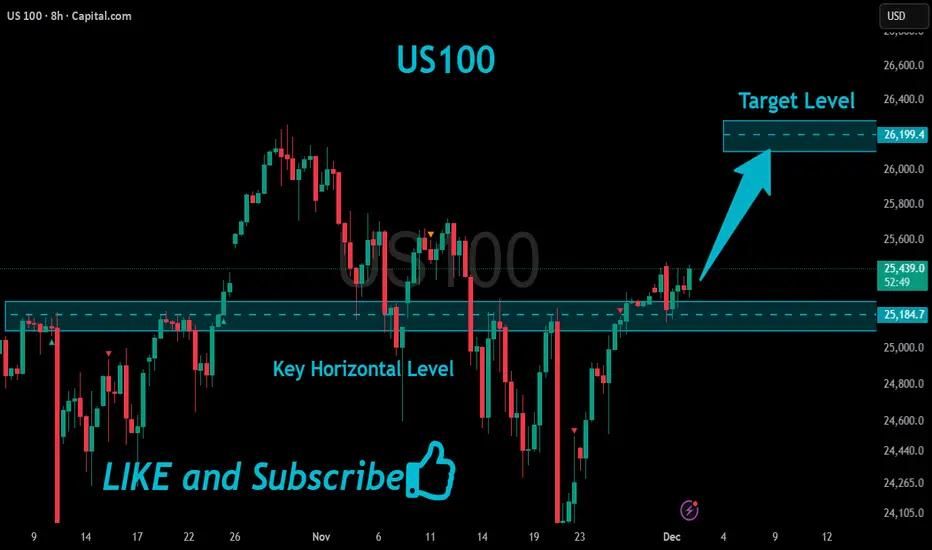
US100 Bullish Breakout!
HI,Traders !
#US100 is going up now
And made a bullish
Breakout of the key horizontal
Level of 25184.7 and the breakout
Is confirmed so we are bullish
Biased and we will be
Expecting a further
Bullish move up !
Comment and subscribe to help us grow !