DOW JONES Inverse Head and Shoulders formed. Bullish.Last week (November 19, see chart below), we caught the very bottom of the 6-month Channel Up on the 1D MA100 (green trend-line) of Dow Jones (DJI):
This time we view the price action using the 4H time-frame, where we can see that an Inverse Head and Shoulders has been formed, with its Head being the 1D MA100 bottom.
If more aggressive, it may not follow the typical green Bullish Leg of the Channel Up but the Target remains almost the same at 48900. That is the 2.0 Fibonacci extension. Typically we should see the 4H MA50 (blue trend-line) turning into the Support until the very top.
---
** Please LIKE 👍, FOLLOW ✅, SHARE 🙌 and COMMENT ✍ if you enjoy this idea! Also share your ideas and charts in the comments section below! This is best way to keep it relevant, support us, keep the content here free and allow the idea to reach as many people as possible. **
---
💸💸💸💸💸💸
👇 👇 👇 👇 👇 👇
Market insights

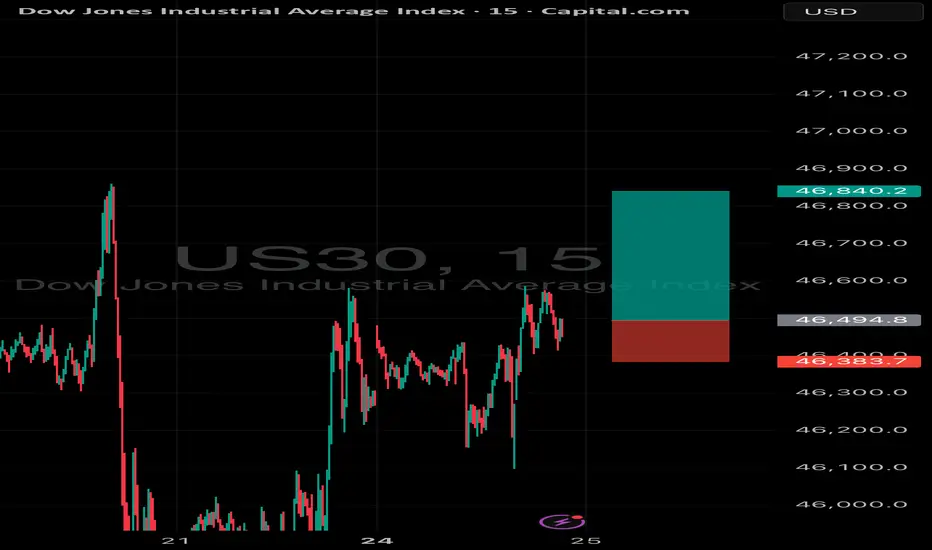
US30 – Big Money Battle | A Clear Institutional FootprintBefore the main move happened, Smart Money had already left a clear footprint.
A bullish Order Block was broken, and a new OB formed at the top — marking an important zone for institutional positioning.
When price retested this OB, a massive clash between Big Money players occurred:
• Large-bodied Doji candle → heavy order absorption
• Abnormal volume spike → strong institutional involvement
After the battle, the winning Big Money group pushed price upward and shifted the structure decisively.
🔍 VVNShark-OB 4-Point Analysis
Market Structure:
A previous bullish OB was broken → early sign of Smart Money movement.
OB + Volume Reaction:
The retest created a huge Doji candle with unusually thick volume.
Liquidity Battle:
Two groups of Big Money fought for control at the exact same price zone.
Outcome:
The winning institutional side pushed price upward with strong displacement.
🦈 Signature
— VNShark-OB | Smart-Money Footprint Analysis
#US30 #DJI #BigMoney #OrderBlock #SmartMoney #Liquidity #VolumeAnalysis #InstitutionalFlow #VSharkOB

US30: Rebound Extends as Markets Eye December Rate CutUS30 | Technical Overview
U.S. indices look ready to extend Friday’s strong rebound as investor sentiment improves, with markets increasingly expecting a Fed rate cut in December.
Meanwhile, geopolitical headlines continue to develop, as the U.S. and Ukraine work on a “refined peace framework” aimed at progressing negotiations with Russia.
Technical Outlook
US30 currently maintains a bullish momentum as long as the price trades above the 46260 pivot line.
Holding above this level supports a continuation toward 46410, followed by 46600.
A 1H or 4H close below 46260 will activate bearish pressure, targeting 45975, and possibly lower if selling momentum strengthens.
Overall, the index still shows bullish pressure under current market conditions.
Key Levels
Pivot Line: 46260
Resistance: 46410 · 46600 · 46910
Support: 46000 · 45680
US30 DOW JONES at Resistance: Here's My Trade PlanI'm keeping a close eye on US30 right now. The market has pushed into a clean bullish breakout, printing higher highs and higher lows across both the H4 and H1 timeframes. 🚀
At the moment, price is overextended and tapping into a significant resistance zone, suggesting that a retracement is likely. Some aggressive traders may look for a counter-trend short, but that comes with elevated risk. ⚠️
Personally, I’m waiting for a healthy pullback, followed by a bullish break of structure to confirm a trend continuation setup. That’s where the higher-probability opportunity may unfold. ✔️
Not financial advice — for educational purposes only.

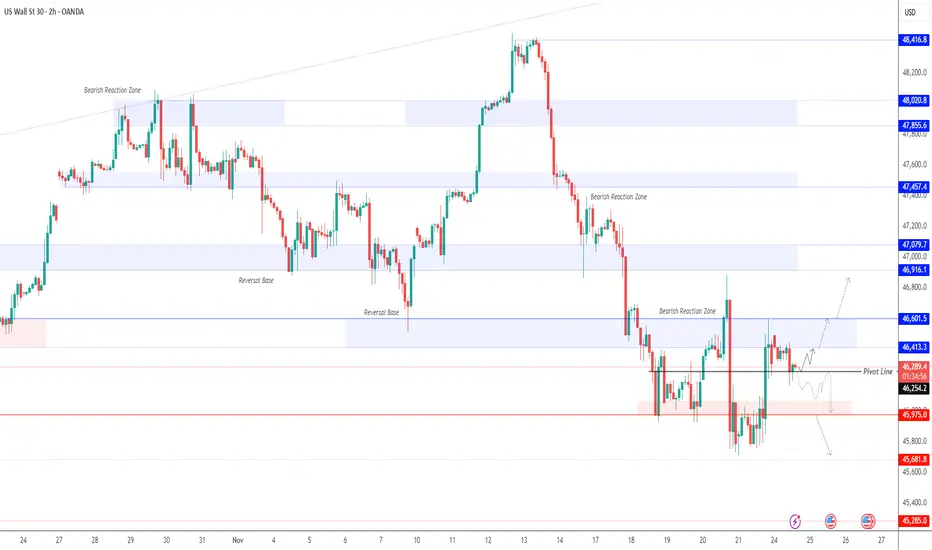
possibility of uptrendGiven the behavior of the index in the current resistance area, possible scenarios have been identified. It is expected that after some fluctuation and correction, the continuation of the upward trend will take place.

UTurn US30Support levels from pivot points and multiple moving averages create a technical base that reduces downside risk in the short term.
Volume remains steady, which confirms the reliability of the ongoing trend.
These combined technical factors typically precede price appreciation in the Nasdaq 100 , suggesting the index will likely continue to Declineshortly based on trend-following and momentum-based trading strategies with limited immediate overbought risk.

us30 BuyInternally price is bullish and also price sweeped the asia low and went to the upside which is a sign to continue higher.

Head & Shoulder forming to drive US30 downI trade support and resistance levels drawn from line charts and watch price action at these level depending on market direction with other confluence such as EMA,SMA,RSI and simple candle stick patterns.
Market is current bearish with minor pull back from previous drop, currently accumulating and should buy up to 46800-47000 which is current celling/resistance level and also looking to form a head and shoulder pattern.
I believe we should see a retest of Friday OCT 10 low and more soon.

US30 Trade Set Up Nov 25 2025Price remains bullish and has swept SSL already in Asia and London followed by a 1h engulfing and CISD so i will wait for more internal bullish structure on the 5m before looking for buys above PDH to target BSL

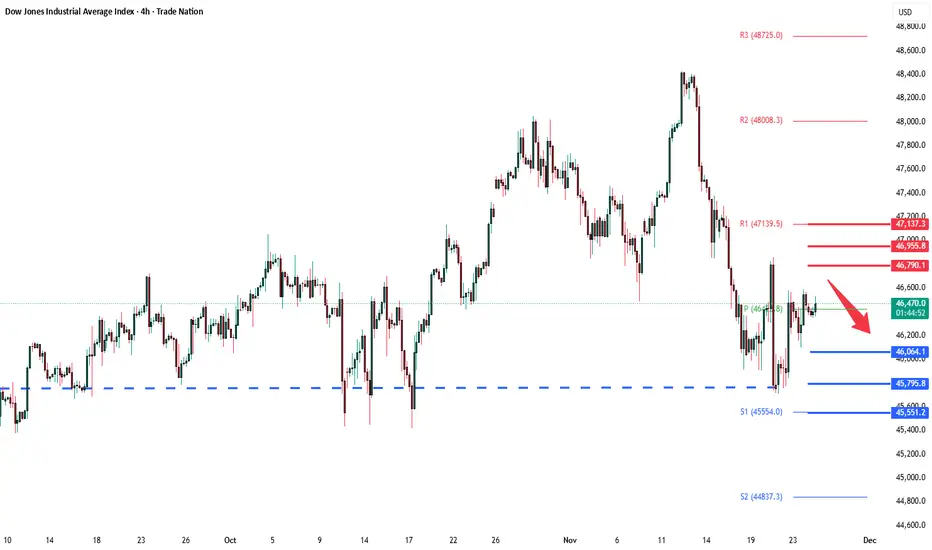
DowJones key trading levelsKey Support and Resistance Levels
Resistance Level 1: 46790
Resistance Level 2: 46955
Resistance Level 3: 47140
Support Level 1: 46065
Support Level 2: 45795
Support Level 3: 45550
This communication is for informational purposes only and should not be viewed as any form of recommendation as to a particular course of action or as investment advice. It is not intended as an offer or solicitation for the purchase or sale of any financial instrument or as an official confirmation of any transaction. Opinions, estimates and assumptions expressed herein are made as of the date of this communication and are subject to change without notice. This communication has been prepared based upon information, including market prices, data and other information, believed to be reliable; however, Trade Nation does not warrant its completeness or accuracy. All market prices and market data contained in or attached to this communication are indicative and subject to change without notice.
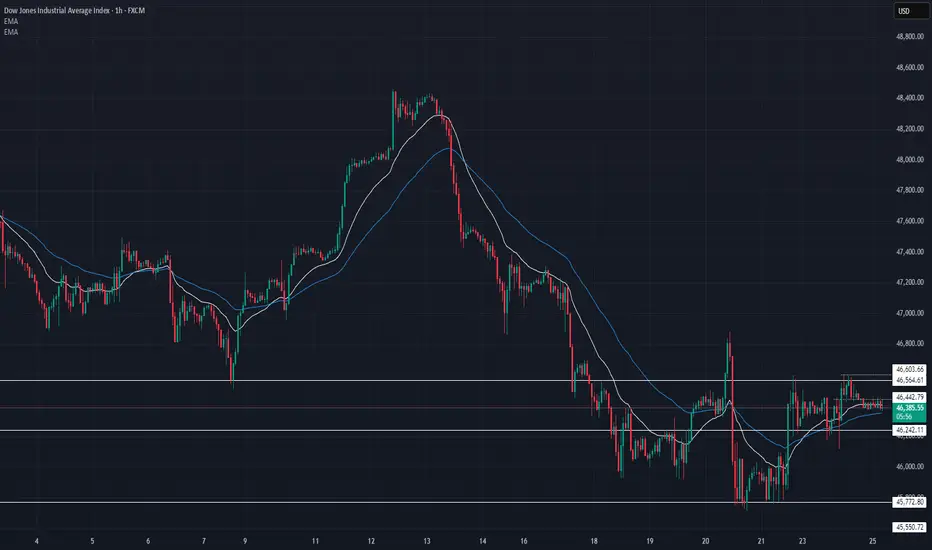
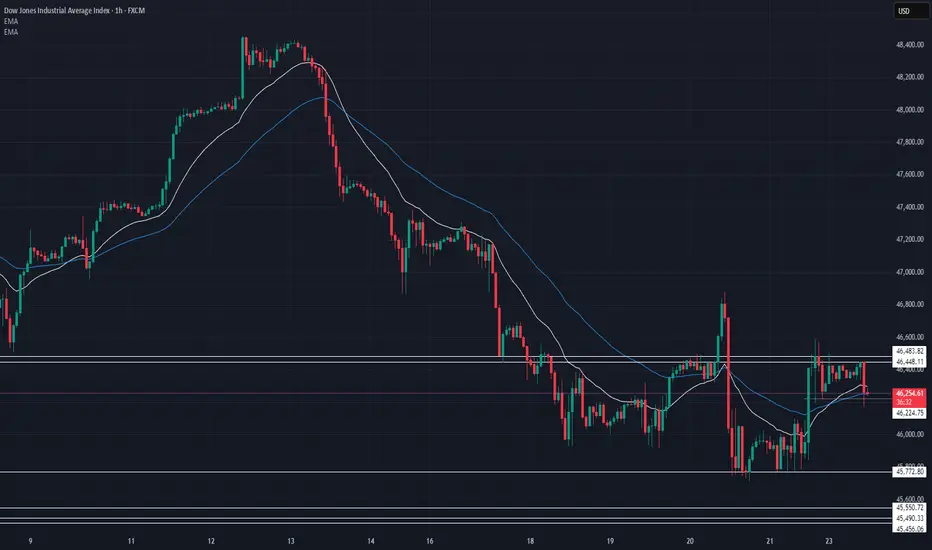
US30 Technical Breakdown – 11/25/2025📍 US30 Technical Breakdown – 11/25/2025
US30 continues to grind sideways after rejecting the 46,600 resistance zone, with price still stuck between key supply and demand levels. Short-term structure is choppy, but bears maintain slight control as long as price sits below the 46,600–46,700 ceiling 📉. Buyers are defending 46,200–46,000, creating a tightening range that’s likely to break soon.
📊 Market Behavior:
🔹 Price rejecting 46,600 multiple times clear intraday supply
🔹 EMAs flattening → momentum weak, indecision building
🔹 Buyers holding 46,200 but failing to break above mid-range
📌 Key Levels:
🔹 Resistance:
46,565 → current rejection zone
46,600–46,700 → major supply & breakout trigger
🔹 Support:
46,240 → intraday support
46,000 → structure demand
45,772 → deeper liquidity zone
🧠 Bias:
Neutral-to-bearish while below 46,600 ❗️
📈 Break + close above 46,600 → opens path to 46,900–47,100
📉 Break below 46,240 → exposes 46,000 and 45,770 liquidity
Us301. Higher Timeframe Bias (HTF)
Check these 4 only:
• Monthly → Bullish or Bearish?
• Weekly → Bullish or Bearish?
• Daily → Bullish or Bearish?
• 4H → Bullish or Bearish?
👉 Only trade in the direction where most timeframes agree.
⸻
2. 15-Minute Structure
• Did the 15m break structure (BOS) up for buys or down for sells?
• Did price come back to retest that level?
👉 If no BOS → NO TRADE
👉 If no retest → WAIT
⸻
3. 20 EMA Confirmation (15m)
• Buys: Price ABOVE 20 EMA
• Sells: Price BELOW 20 EMA
This confirms momentum in your direction.
⸻
4. Entry Candle Confirmation
Choose your execution timeframe (15m or 5m):
• Buy: Bullish engulfing or strong bullish candle
• Sell: Bearish engulfing or strong bearish candle
This tells you the retest is holding.
⸻
5. Exact Trade Levels
This makes everything crystal clear:
BUY Example
• Entry: 37,920
• Stop-Loss: 37,820 (100 points below)
• Take Profit (2:1): 38,120
• Optional 4:1 target: 38,320 (only if confluence is extremely high)
SELL Example
• Entry: 37,920
• Stop-Loss: 38,020 (100 points above)
• Take Profit (2:1): 37,720
⸻
⭐ Simple 1–2–3 Summary
1. Bias → Are most timeframes all bullish or bearish?
2. Structure → BOS + Retest?
3. Entry → EMA + Strong candle + Clear SL + Clear TP.

US30 LONG IDEAOverall trend is bullish so why not grabbing the nice bullish continuation opportunity
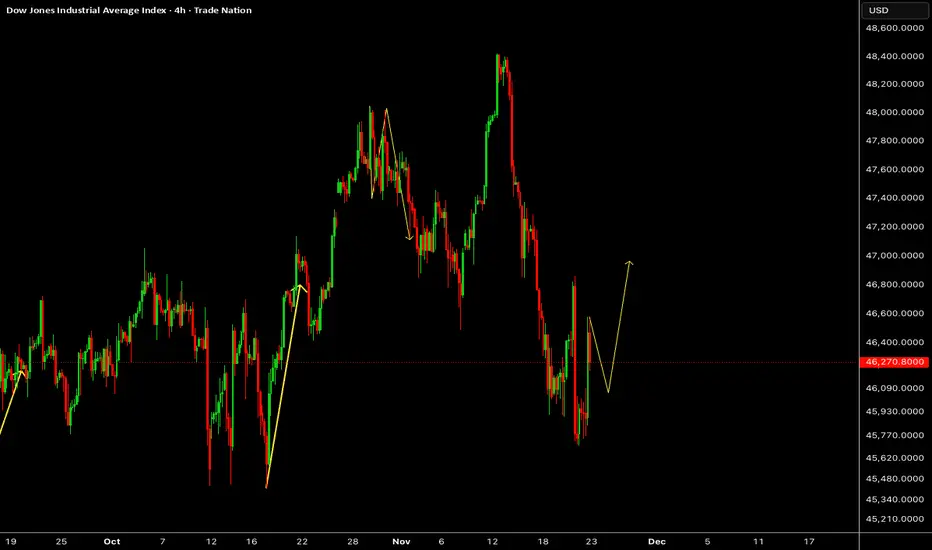
Dow Jones Wave Analysis – 24 November 2025
- Dow Jones reversed from support area
- Likely to rise to resistance level 47000.00
Dow Jones index recently reversed from support area between the key support level 45800.00 (which has been reversing the price from September), lower daily Bollinger Band and the 50% Fibonacci correction of the upward impulse from July.
The upward reversal from this support area stopped the previous short-term ABC correction 2.
Given the clear daily uptrend, Dow Jones index can be expected to rise to the next resistance level 47000.00 (top of the previous wave B).

US30 Trade Secured 2500 PipsPlayed out perfectly, sweeping SSl and London lows to then engulf and invert on the 5m to target PDL/BSL


US30 Trade Set Up Nov 24 2025Price has swept 1h SSL in London and engulfed 1h bearish candle so i want to see a internal 15m SSL swept followed by 1m-5m IFVG/CISD to target PDH

US30 Technical Breakdown – 11/24/2025📍 US30 Technical Breakdown – 11/24/2025
US30 showing signs of early recovery after last week’s heavy selloff, but still struggling to break above the 46,450–46,500 intraday resistance zone. Price remains below key EMAs, meaning sellers still hold the structural advantage unless bulls reclaim higher levels 🔎📉
After tapping demand around 45,770–45,900, buyers stepped in, but momentum is weak as long as the index stays under the 46,500 ceiling.
📊 Market Behavior:
🔹 Price rejecting 46,450–46,500 repeatedly → strong short-term supply
🔹 EMAs still sloping bearish → momentum favors sellers
🔹 Range-style behavior forming between 46,000–46,500
🔹 Bulls need a clean reclaim above EMAs for trend shift
📌 Key Levels:
Resistance:
🔹 46,450–46,500 → major intraday ceiling
🔹 46,780 → breakout extension
🔹 47,000 → structural shift zone
Support:
🔹 46,120 → weak intraday support
🔹 45,900 → key reaction zone
🔹 45,770 → major demand / bottom of range
🔹 45,456 – 45,320 → higher-timeframe demand
🧠 Bias:
Overall structure still bearish unless 46,500 breaks
📉 Sellers hold control beneath EMAs
⬆️ Break & close above 46,500 → opens move toward 46,780–47,000
⬇️ Rejection at 46,500 + break back under 46,120 → signals continuation lower
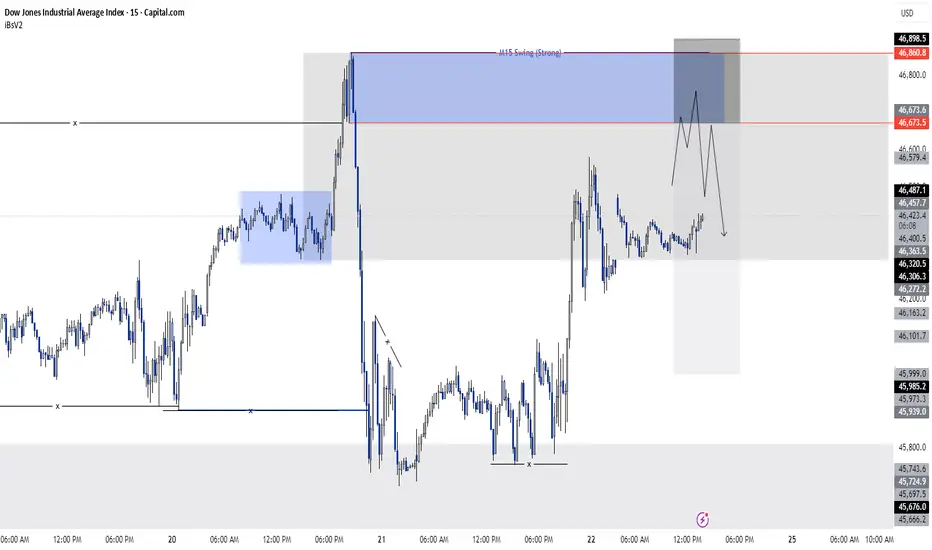
US 30 sell idea As we know, the swing structure on both the H4 and M15 timeframes is bearish. And we also know that we cannot take trades directly from the H4 timeframe, so to refine our entry we move down to the M15 timeframe and take our entry from there.
Now, on the H4 timeframe, we observed that the H4 swing is bearish, and at the same time, the H4 has also swept a fractal zone, after which the market moved downward. Now, for the market to continue its trend, it will make a pullback. We will look for this pullback on the M15 timeframe because we will take our sell entry from the M15 timeframe.
And on the M15 timeframe, when the price comes into our blue zone (46673.5 – 46860.8), we will take a sell trade.
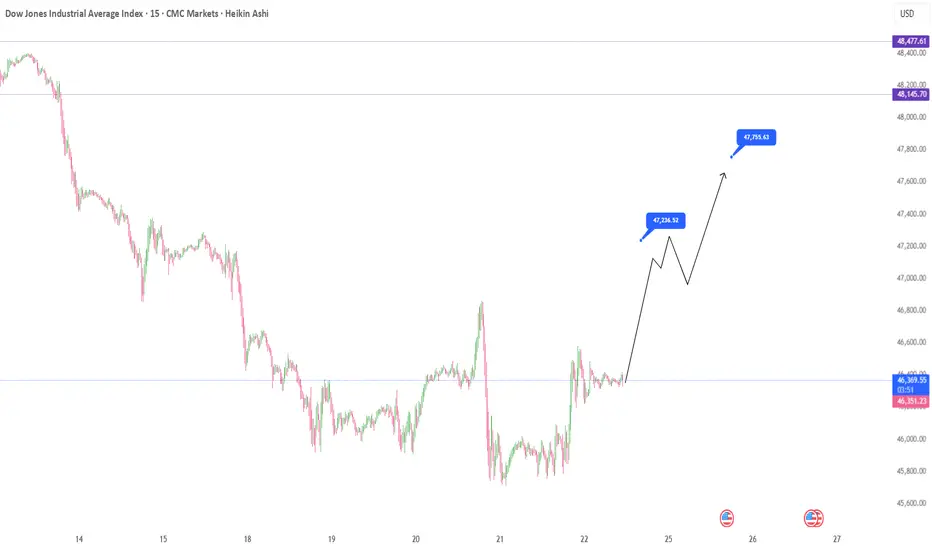
US30 in Start of WeekAfter ranging in Asian session, expect bullish movement to 46,800 levels starting with London session.
US30: Bearish Continuation & Short Signal
US30
- Classic bearish formation
- Our team expects fall
SUGGESTED TRADE:
Swing Trade
Sell US30
Entry Level - 46270
Sl - 46419
Tp - 46011
Our Risk - 1%
Start protection of your profits from lower levels
Disclosure: I am part of Trade Nation's Influencer program and receive a monthly fee for using their TradingView charts in my analysis.
❤️ Please, support our work with like & comment! ❤️

US30 – Sharp Drop Stabilising with a Potential Recovery PathAfter a pronounced downside move, price has begun to stabilise with a volatile rebound pattern forming. If this developing structure continues to hold, a gradual upward continuation scenario may unfold as sentiment attempts to shift in the coming sessions.
Disclosure: We are part of Trade Nation's Influencer program and receive a monthly fee for using their TradingView charts in our analysis.
us30Analysis of the Dow Jones index and forecasts for the coming week's movements in light of the current conflicting data.
Speaker and analysis in Arabic.
