US30 trade idea Clean bearish run from 40000. Waiting for the equal lows at 39052 to get taken out and potentially see 38850 too getting taken out. With this occurring we could have a good bullish setup to the extreme highs before the big move down...
US30 trade ideas

Unpopular opinion but A black swan event is likely to occur, what goes up must come down.
The extreme greed of the profit over safety and quality will likely play a role in the event.
Buckle up. Recent double top, yes it was a small double top but I got a feeling it is the first sign of some bad ju ju to come

I know I know just zoom out but a double top is a double topI've been looking for a signs of economic recession for the last few years. I have seen roofing companies slow down deliveries in my local area by orders of magnitude, yet the economy seemingly roared on, I saw HVAC companies in my area do layoff after layoff, yet apparently the economy roared on.
Now these companies are still churning out business just at a slower post covid rate but at some point the chicken has to come home to roost eventually.
This double top could possibly be the first warning sign.
I don't normally chart the dow, I just glance at it on google now and then but this here caught my eye.
Feel free to chime in with your thoughts on where things will be heading.

US30 SHORT/LONG NON FARM PAYROLLAs traders, we constantly seek opportunities to capitalize on market movements driven by fundamental events. One such event that significantly influences the financial markets, particularly the US30 index, is the release of the Non-Farm Payroll (NFP) report. This monthly economic indicator published by the U.S. Bureau of Labor Statistics provides insight into the overall health of the U.S. labor market, making it a crucial piece of data for traders and investors alike.
Our trading strategy revolves around the premise that the US30 index tends to react strongly to deviations from expectations in the NFP report. Specifically, we have devised a clear approach for trading US30 based on the outcome of the NFP report:
Low NFP Figures (Below Expectations):
When the NFP report reveals figures that fall below market expectations, indicating a potential weakness in the labor market, we anticipate a negative sentiment in the market. Historically, disappointing NFP figures have led to downward pressure on the US30 index as investors interpret such data as a sign of economic sluggishness. Consequently, we will be actively seeking short positions on the US30 index in anticipation of a bearish trend.
Positive NFP Figures (Above Expectations):
Conversely, if the NFP report exceeds consensus forecasts, signaling robust job growth and economic vitality, we expect a positive reaction in the market. In such scenarios, traders typically interpret strong NFP figures as a bullish signal for the U.S. economy and, consequently, for the US30 index. As a result, we will be inclined to pursue long positions on the US30 index, anticipating an uptrend fueled by optimistic market sentiment.
By adhering to this trading strategy, we aim to capitalize on the volatility and directional bias triggered by the release of the NFP report. It's important to note that while this strategy provides a framework for decision-making, prudent risk management and thorough analysis of market conditions should always accompany any trading approach. Additionally, it's crucial to monitor other economic indicators, geopolitical developments, and market sentiment to refine our trading decisions and adapt to changing market dynamics.

US30 M30 | Bearish Drop Based on the M30 chart analysis, we can see that the price is rising toward our sell entry at 39342, which is a pullback resistance that is close to 23.6% Fibo retracement.
Our take profit will be at 38953.69, a pullback support level.
The stop loss will be placed at 39760, a pullback esistance level
High Risk Investment Warning
Trading Forex/CFDs on margin carries a high level of risk and may not be suitable for all investors. Leverage can work against you.
Stratos Markets Limited (www.fxcm.com):
CFDs are complex instruments and come with a high risk of losing money rapidly due to leverage. 66% of retail investor accounts lose money when trading CFDs with this provider. You should consider whether you understand how CFDs work and whether you can afford to take the high risk of losing your money.
Stratos Europe Ltd, previously FXCM EU Ltd (www.fxcm.com):
CFDs are complex instruments and come with a high risk of losing money rapidly due to leverage. 70% of retail investor accounts lose money when trading CFDs with this provider. You should consider whether you understand how CFDs work and whether you can afford to take the high risk of losing your money.
Stratos Trading Pty. Limited (www.fxcm.com):
Trading FX/CFDs carries significant risks. FXCM AU (AFSL 309763), please read the Financial Services Guide, Product Disclosure Statement, Target Market Determination and Terms of Business at www.fxcm.com
Stratos Global LLC (www.fxcm.com):
Losses can exceed deposits.
Please be advised that the information presented on TradingView is provided to FXCM (‘Company’, ‘we’) by a third-party provider (‘TFA Global Pte Ltd’). Please be reminded that you are solely responsible for the trading decisions on your account. There is a very high degree of risk involved in trading. Any information and/or content is intended entirely for research, educational and informational purposes only and does not constitute investment or consultation advice or investment strategy. The information is not tailored to the investment needs of any specific person and therefore does not involve a consideration of any of the investment objectives, financial situation or needs of any viewer that may receive it. Kindly also note that past performance is not a reliable indicator of future results. Actual results may differ materially from those anticipated in forward-looking or past performance statements. We assume no liability as to the accuracy or completeness of any of the information and/or content provided herein and the Company cannot be held responsible for any omission, mistake nor for any loss or damage including without limitation to any loss of profit which may arise from reliance on any information supplied by TFA Global Pte Ltd.
The speaker(s) is neither an employee, agent nor representative of FXCM and is therefore acting independently. The opinions given are their own, constitute general market commentary, and do not constitute the opinion or advice of FXCM or any form of personal or investment advice. FXCM neither endorses nor guarantees offerings of third party speakers, nor is FXCM responsible for the content, veracity or opinions of third-party speakers, presenters or participants.

Potential Dow Jones Industrial Average MILLENNIUM CYCLE COMPLETE
I took the liberty to chart the path of the DJIA since the debut that this site would allow, starting from since 1896.Potential target would be in the proximity of the pink circle/prior wave 4. However, wave 4 at a smaller/red horizontal dashed line. The potential top appears to be in, in my humble opinion........
All The Best!

The Great StampedeWave three down continued last week without pause. The Dow down, especially heavy on Friday, expect at least some follow through...perhaps a bounce for a few days to relieve the selling pressure.
There is no doubt what situation we are in regards the waves down, it's just a question of when the capitulation phase hits, we wait for the "MSM" to announce it soon.
Many months of rally have already been wiped out in only a few weeks...this is the character of the bear. Our small short position mantra, kept us us in the game easily without stress...weeks of steady rise against all odds and sense have finally broken down. We openly mocked David Hunter's final blow off rally as more of a propaganda hyped story...he is history.
This is only the first serious wave one down in a major three, once it bottoms, expect a relief rally wave two before a devastating plunge in November. Going heavy short here is not advised, wait for the confirmation bounce for big bets.
Months ago we suggested that the markets were primed for huge declines and Gold to surge, that could only eventuate via war...the favourite tool when the economy tanks....the ultimate distraction event.
Gold had a good week, many suggested that gold had put in a triple top months ago...the fourth knock will be the fourth turning and an explosion above $2100 U.S will result in overwhelming buying demand.
The resulting stock market panic from WAR, will drive PM prices into overdrive.
Summing up: Stay short, watch for a bounce relief rally coming...don't over leverage.
Appreciate a thumbs up, Good Trading & God Bless you all!

"US30 Market Analysis: Assessing Breakout Potential and Bearish US30 Analysis - April 2024
Overview:
The US30 index is currently showing signs of upward momentum, poised for a potential breakout if it surpasses the resistance level at 38749.14. However, there's a notable bearish sentiment with significant downward pressure, particularly evident around the 38022.02 level.
Trade Opportunities:
1. Breakout Scenario:
- If US30 breaks above 38749.14, there's a possibility of further upward movement, indicating a bullish trend continuation.
2. Bearish Momentum:
- Should the index experience a strong bearish momentum and drop below 38022.02, it could signal a reversal with potential shorting opportunities.
Observations:
- Last week, buyers faced rejection around the 38102.13 level, suggesting a shift in market sentiment towards sellers.
- Despite recent uptrends, the current strength of sellers indicates a potential change in market dynamics.
---
Feel free to adjust the text to better fit my analysis and trading perspective thanks for support.

US30: Dow Jones Retreats After Double Top FormationThe Dow Jones Industrial Average has shifted into negative territory, experiencing a notable downturn following a double top formation around the $40,000 mark on April 1st. As of the time of writing, the price has descended to $39,179, exhibiting a reaction near the neckline of the price pattern. This development prompts a strategic approach based on Fibonacci levels, indicating potential pullback zones where sell limits have been set to capitalize on retracement opportunities.
The recent softness in US services activity data has provided a degree of respite for investors, who have been increasingly apprehensive about the implications of robust US macroeconomic indicators on Federal Reserve monetary policy. Specifically, the US ISM Services Purchasing Managers' Index (PMI) dipped to 51.4 in March from 52.6 in February, contrary to market expectations of a marginal uptick to 52.7. Furthermore, the Prices Paid sub-index receded to 53.4 from 58.6, marking its lowest reading in years and indicating a disinflationary trend in the economy. These figures have somewhat counterbalanced the impact of strong ADP employment data and hawkish remarks from Federal Reserve Chair Powell and Atlanta Fed President Bostic.
In light of these developments, our strategy revolves around anticipating a pullback from the previous zone area, followed by a renewed downward movement. This tactical approach aims to capitalize on market dynamics and potential retracement opportunities, aligning with broader market sentiments and macroeconomic indicators.
As market conditions evolve, continued monitoring and adjustment of strategies will be essential to adapt to changing dynamics and capitalize on emerging opportunities in the Dow Jones Industrial Average.

US30 100% PLAYOUTUS30 has played out 100% accurate on our buy and sell prediction
The next move of us30 will be dependant at its current zone we do expect the pair to pull back a bit before going bearish again

US30 BUY ENTRY INCOMINGUS30 Seems to be pushing higher as per our previous analysis
We will take a valid buy position if resistance is broken at current market which will open way to uptrend to next target

US30 PLAYING ALONG A KEY LEVEL IN THE MARKETUS30 is playing along a key level in the market which will determine its next move if broken above this level or rejected we continue to watch the pair to get valid entries


US30 SELLERS ARE DOING THE MOSTEarlier today i posted US30 analysis, accurate as always best trading set up with my own terminology as long as i win always thats all that matters to me.

US30 HIT 38850, BEAR RALLY IS ONOver 350 pips bagged successfully on Dow jones
PA is melting hard, what are you doing about it?
We have 2,150 pips to go.
stuck in profit

US30 Long ForecastUS30 Week low 39000
It is weekly reversal point
Target over 40000 by Friday
Counter trend trade ? why not
Please like share, comment

start of a bullish swing1st target is the area inside white circle and will touch 100 %
if you trade ny session you will understand what i mean
so big opportunity just arrived
hola


US30 (4.4.24) V1V1 - Possible buy opportunity, if the current 30 minute close bullish, take that buy. you manage your profits.

Impulse up to around 39300 at leastForming a Leading Diagonal from London open.
- in the last (smaller) wave 5 at the moment and then is the leading diagonal (bigger) wave 1 completed.
- then down to around 39130 (bigger wave 2)
- then the wave 3 up to around 39300 (as measured by the Wave 1 Leading diagonal at the moment).

DJI Double top breakdown?Dow Jones Industrial Average - US's Sensex seems to have broken down off of the Double top formation.

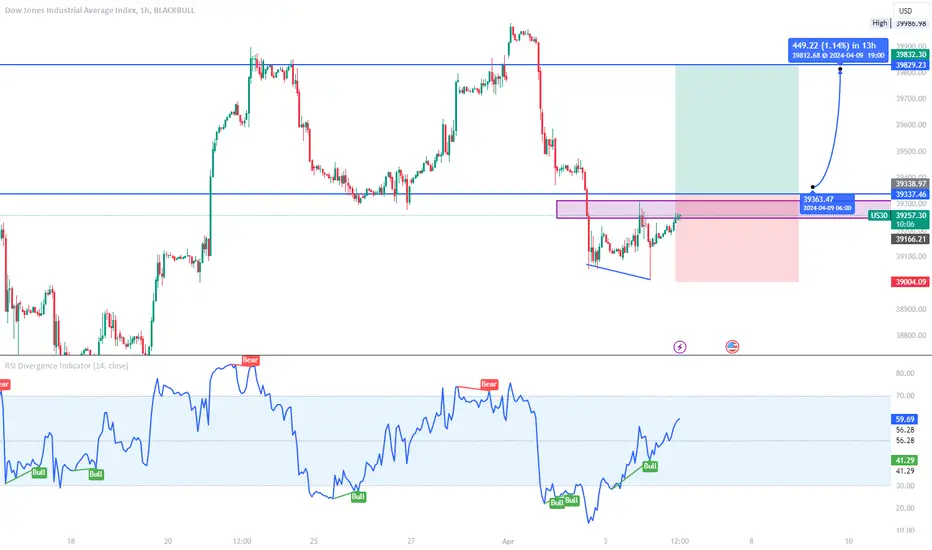
its possible to test te highs again This technical analysis sounds promising! Here's a breakdown:
Support Line Test: The price reached a level (support line) where previous buying pressure halted the decline. This suggests demand for the asset at that price point.
Retest of Support: The price dipped back towards the support line but didn't break through. This retest can be seen as a confirmation of the support level's validity.
Together, these pattern suggests a potential reversal:
The price might be bouncing off the support, indicating a possible upswing.
