US30 (3.18.24) V2 We are getting a retracement to the strike zone it looks like, please read the comments on the chart. If price touches or gets within 5-10 pips of the strike zone, I will take a buy.
US30 trade ideas

US30 (3.18.24) V1 V1 - Seems like we may be at the bottom of this short-term DT(DownTrend) and is primed to go bullish again. I marked areas of interest for buys, but if a selling opportunity presents itself then I will call those out too

US 30 - Ranges overview (update) Pa moving nicely let's see how we move from here.
As always let the market come to you and react and act upon it.
Stay safe and never risk more than 1-5% of your capital per trade. The following analysis is merely a price action based analysis and does not constitute financial advice in any form.

US 30 - Ranges overview Here is a quick look at what I am looking for on US 30.
Will see IF we respected the 15min FVG (blue box) I will enter shorts targeting the sellside liquidity.
IF we disrespect it or fail to trade lower will follow the overall pa and go for longs aiming at the HTF FVG (yellow box)
Simple plan so let's wait and execute
Stay safe and never risk more than 1-5% of your capital per trade. The following analysis is merely a price action based analysis and does not constitute financial advice in any form.

US30 OUTLOOKUS30 Weekly Outlook / Top Down Analysis
-OVERALL price has been very BULLISH
*IF price can stay BELOW our level at
38993 i could potentially see a BEAR CONINTUATION
BULLS be aware of BEARS
BEARS be aware of BULLS
Trading is an ART- GreyVangogh


Us 30 looks bearish in day #us30 after multiple attempt take highs showing bearish signs , but in 4hr there short recovery.
Lets see how market reacts following trend analysis ,
Any suggestions please comment it down below.


Potential bullish bounce?The DJIA Index (US30) could fall towards a pullback support at 38,151.50 which has been identified as a pivot point. Could price potentially reverse around this level to bounce higher?
Pivot: 38,151.50
Support: 37,093.60
Resistance: 39,303.36
Risk Warning:
Trading Forex and CFDs carries a high level of risk to your capital and you should only trade with money you can afford to lose. Trading Forex and CFDs may not be suitable for all investors, so please ensure that you fully understand the risks involved and seek independent advice if necessary.
Disclaimer:
The above opinions given constitute general market commentary, and do not constitute the opinion or advice of IC Markets or any form of personal or investment advice.
Any opinions, news, research, analyses, prices, other information, or links to third-party sites contained on this website are provided on an "as-is" basis, are intended only to be informative, is not an advice nor a recommendation, nor research, or a record of our trading prices, or an offer of, or solicitation for a transaction in any financial instrument and thus should not be treated as such. The information provided does not involve any specific investment objectives, financial situation and needs of any specific person who may receive it. Please be aware, that past performance is not a reliable indicator of future performance and/or results. Past Performance or Forward-looking scenarios based upon the reasonable beliefs of the third-party provider are not a guarantee of future performance. Actual results may differ materially from those anticipated in forward-looking or past performance statements. IC Markets makes no representation or warranty and assumes no liability as to the accuracy or completeness of the information provided, nor any loss arising from any investment based on a recommendation, forecast or any information supplied by any third-party.

possibility of uptrend According to the structure of rising waves, it is expected that the continuation of the rising trend will be formed after the completion of the corrective patterns.
As long as the price fluctuates above the red support zone, there will be a chance to continue the uptrend

US30 TO NEW ATH OF $43,050 (UPDATE)🚀Market is now up 5,380 PIPS (16.5% growth) from our POI😍
I would recommend closing out partial profits here & letting the remainder of your positions run risk free!

dow jones dancing at every dipstuck in a very small range i expected a pole and flag breakout but just now he said wait a minute i am forming ascending triangle pattern also

MFFOREX US30 SHORT TERM BUY INCOMINGUS30 shows signs of a possible short term buy playing out in the week ahead

US30 Poised for a Bounce from SupportThe BLACKBULL:US30 has seen a recent pullback, touching down on a zone of strong support. Our charts show this retreat as a healthy retracement within an overall bullish context.
Trade Strategy:
Entry Point: We’re looking at the 0.75 Fibonacci level, around 38645.6, as our prime zone for entry. It’s not just a number; this level has historical significance, repeatedly showing its worth as a springboard.
Stop Loss: Just to play it safe, we’re placing our stop loss slightly below the support zone, around the 38500 area. It’s close enough to minimize potential loss but still gives room for the usual ebb and flow.
Profit Targets: On the northbound journey, our sights are set on the recent high of 39229.6 as our initial target. But, with strong momentum, we might even aim higher, reassessing as we go.
The MFI dipping below 50 alongside a bearish money flow could have rattled some, but for us, it's a possible indication that selling pressure might be waning, giving way to the bulls soon enough.
With these levels in mind, let's buckle up and wait for the market to confirm our analysis. Patience will be key, but the rewards could be well worth it.

SL Recap40cb
classic mistake on asian and london season
taking entry to early based on standard supply level.
technically its not fully fake out
mybe that trade influence by hari sebelum tu
dah lock sell cantik tapi sebab dah ngantuk terpaksa tp awal then terjun 250p
2 kali kena game nampaknya setup ni. 😌


US30 START OF A BEARISH MELTDOWN?Short positions on US30 appear compelling this week. We've observed significant bearish momentum lately, leading to a shift in character towards the downside, hinting at a potential trend reversal. Despite not having breached major structural levels yet, two robust supply zones remain, from which we can expect a bearish response.
The slowdown in price movement suggests distribution on higher time frames and hints at an impending reversal. Moreover, there's considerable liquidity to the downside, attracting price action, potentially resulting in a sweep of those equal lows.
Confluences for US30 Sells are as follows:
- Price has changed character on the 4-hourly time frame to the downside.
- Lots if liquidity to the downside in the form of equal lows.
- Two good supply zones in which we can expect a major bearish reaction to take place.
- Price has been heavily bullish and its due for a retracement.
- On the higher time frame price has slowed down momentum, good sign for a reversal.
P.S. However, on the higher time frames, the price remains notably bullish, with equal highs recently established at the latest swing high. These highs represent significant liquidity points, and it wouldn't be surprising if the price retraces to take them out.
FOMC news this Wednesday, trade safe and have a great week!

CHART BREAKDOWN US30: Key Levels, Targets and Thoughts!🎯Brief Description🖊️:
The chart provides insights into critical market levels, emphasizing an essential supply zone (medium-risk sell zone) spanning from 39160 to 39220, respectively, are highlighted.
Things I Have Seen👀:
Medium-Risk Sell Zone🟠: Noted between 39160 and 39220, suggesting another area with moderate risk for potential selling positions.
Bearish Targets📉:
39070: Possible retracement area.
39000: Possible retracement area.
38920: Essential Demand Zone.
38870: Area with laying low liquidity.
Ultimate Target: 38800- An important level for potential retracement.
Ultimate Target: 38500- An important level for potential retracement.
What's Important Now❗
Currently, the crucial approach is to wait and observe the price action at this level. We need to assess how the market reacts before considering any decisive moves. Stay observant and responsive to real-time developments in the market.

dow goin back to 33k or more when big selloff comes, watch reds dow going back to 33k or more when the big selloff comes, watch reds before the election prob August-ish

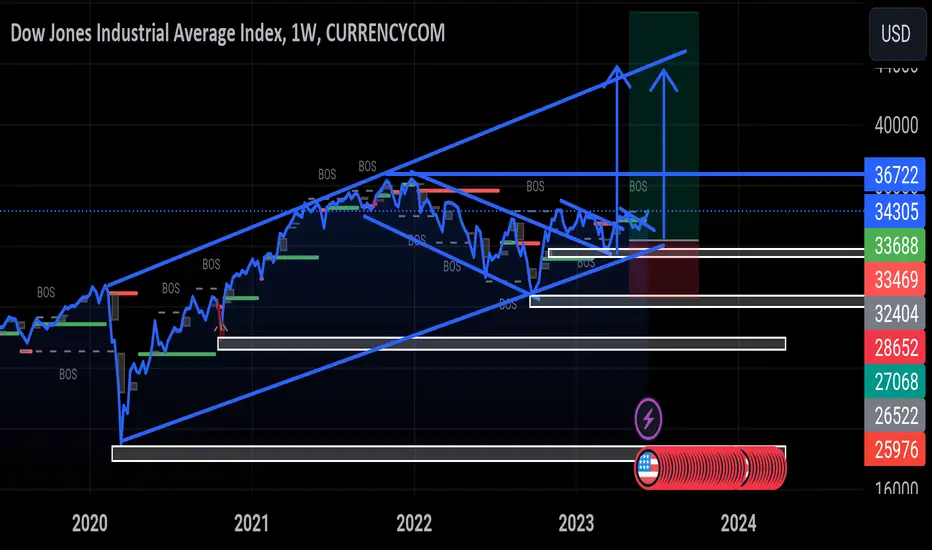
US30 trading plan for this yearAm trying to spot a yearly set up for Us30 , as you see the structure is indicating n uptrend, however it's gonna take time to reach the target with alot of pull backs but as a trader is important to know we're the market is trending in bigger time frame#educational.
US30 SWING SETUPGood day everyone
We are looking to go Short for the (short term)as we can see by previous data since OCT 22-DEC22 the market has moved 22% up and the pullbacks measure around 10-9% .Current market price sitting @21,8% ,Daily chart showing reversal signs/exhaustion of bullish trend,end of Q1 mark tends to reverse trend.we got untested daily highs @3695,51 & @35736 .We do expect a pullback to 3695,51 lines up with previous pullback range OF 9%,falls on the 50% FIB MARK,
Please let us know your thoughts

Dowjones Potential DownsidesHey Traders, in the coming week we are monitoring US30 for a selling opportunity around 38860 zone, US30 is trading in a downtrend and currently is in a correction phase in which it is approaching the trend at 38860 support and resistance area.
We would like to add up to current bullish momentum on the US dollar, usually when the dollar is bullish that put some pressure on indices like Dowjones due to the negative correlation
Trade safe, Joe.

US30 OUTLOOK & TRADE IDEA | 1HMedium safe buys because there was no HTF POI mitigation.
What do you think?
LQP = Liquidity Pool
2WT = 2 Way Trap
