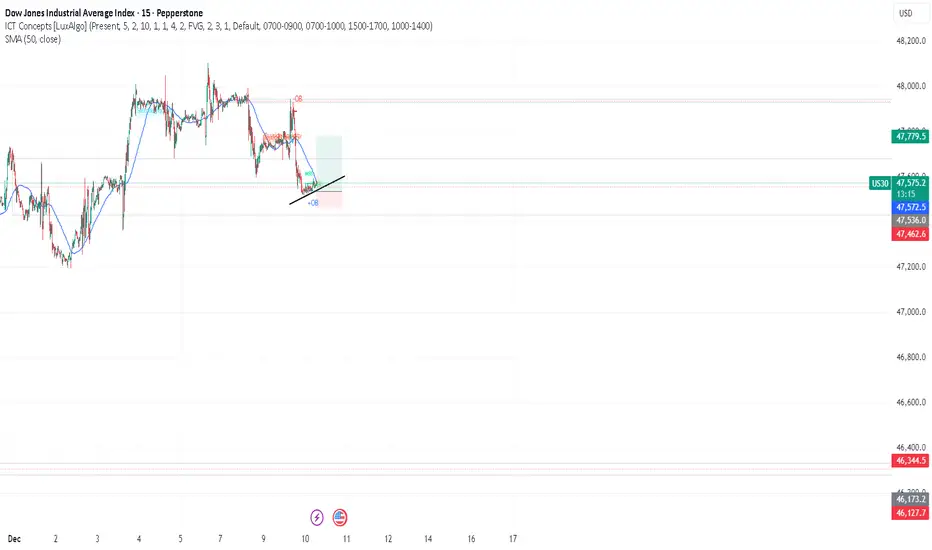
DOW/US30 - BEAUTIFUL CHART Team, I am looking at the US30/DOW - whatever you call it
look beautiful on the 5/15 minutes channel
Sorry, i been too lazy to post because lately I've been doing scalping
I am about to prove another challenge where $1000 turns into a million
Last account $1000 turned into 100k, took 6 months
But this challenge, I am not sure.
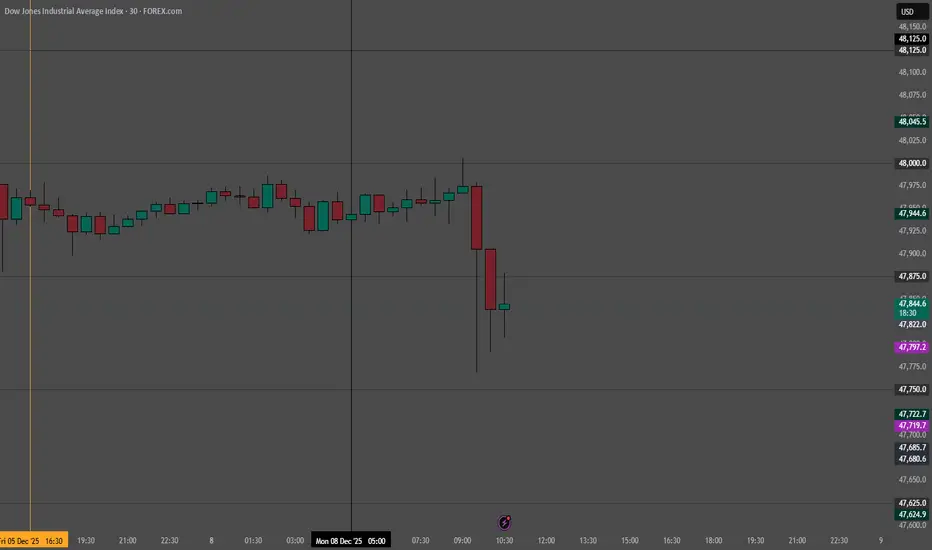
Anyway lets focus on the trade right now
the price is 47590-99 - long entry
STOP LOSS at 47550
Target 1 at 47650-47666
Target 2 at 47701-47715
Target 3 at 47760-47781
LETS GO
Market insights
US30 reflected by the upper bandIn my opinion, the upper band will reflect US30 and will go down to the lower one.
If the lower is crossed, expect more bearish.
The US 30 could stay more days between this interval - expected end of the week.

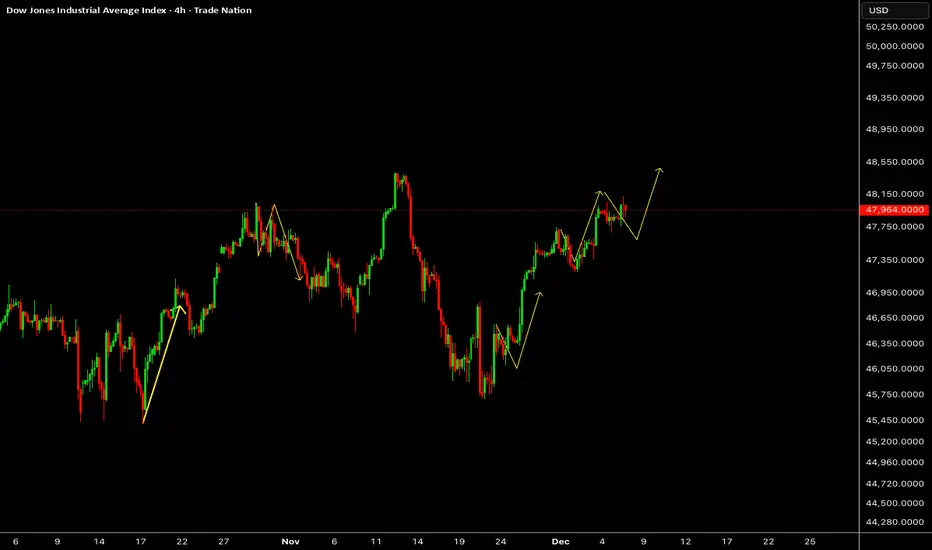
US30: What’s Forming?US30 has extended its upward move, but the latest slowdown suggests a developing consolidation phase rather than a completed trend. The structure is shaping into a potential corrective pattern, indicating that the market may still be preparing for another push once this pause finalizes. With momentum moderating, the next decisive move could unfold soon, making this an interesting setup to monitor closely.
**Disclosure:** We are part of Trade Nation's Influencer program and receive a monthly fee for using their TradingView charts in our analysis.
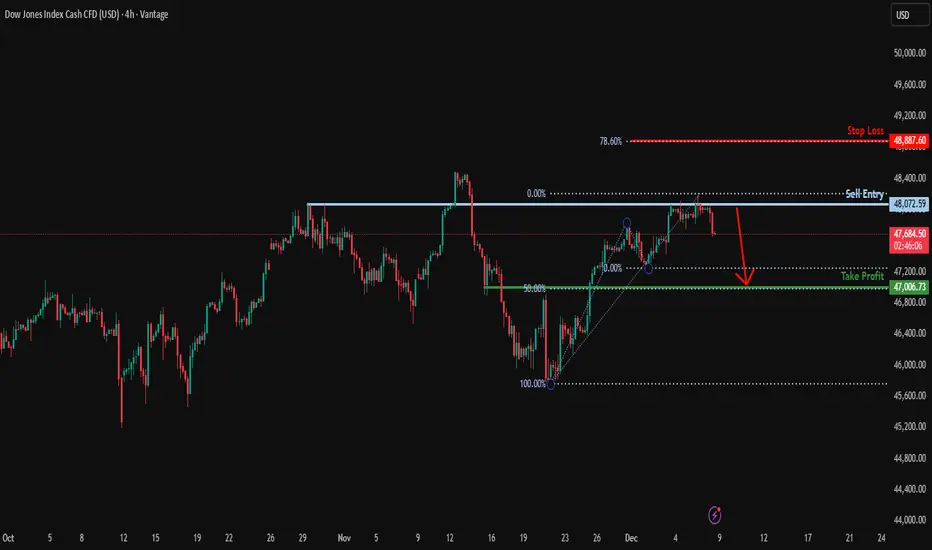
Could we see a reversal from here?NAS100 has rejected off the resistance level, which is a pullback resistance and could potentially drop from this level to our take profit.
Entry: 48,072.59
Why we like it:
There is a pullback resistance level.
Stop loss: 48,887.60
Why we like it:
There is a resistance level at the 78.6% Fibonacci projection.
Take profit: 47,006.73
Why we like it:
There is a pullback support that aligns with the 50% Fibonacci retracement.
Enjoying your TradingView experience? Review us!
Please be advised that the information presented on TradingView is provided to Vantage (‘Vantage Global Limited’, ‘we’) by a third-party provider (‘Everest Fortune Group’). Please be reminded that you are solely responsible for the trading decisions on your account. There is a very high degree of risk involved in trading. Any information and/or content is intended entirely for research, educational and informational purposes only and does not constitute investment or consultation advice or investment strategy. The information is not tailored to the investment needs of any specific person and therefore does not involve a consideration of any of the investment objectives, financial situation or needs of any viewer that may receive it. Kindly also note that past performance is not a reliable indicator of future results. Actual results may differ materially from those anticipated in forward-looking or past performance statements. We assume no liability as to the accuracy or completeness of any of the information and/or content provided herein and the Company cannot be held responsible for any omission, mistake nor for any loss or damage including without limitation to any loss of profit which may arise from reliance on any information supplied by Everest Fortune Group.
US30 SellsWe're on track folks! I'm on a prop firm you can check the link. I use Tradingview as a POV and I place trades on TradeLocker! Target hit my first TP as we speak!
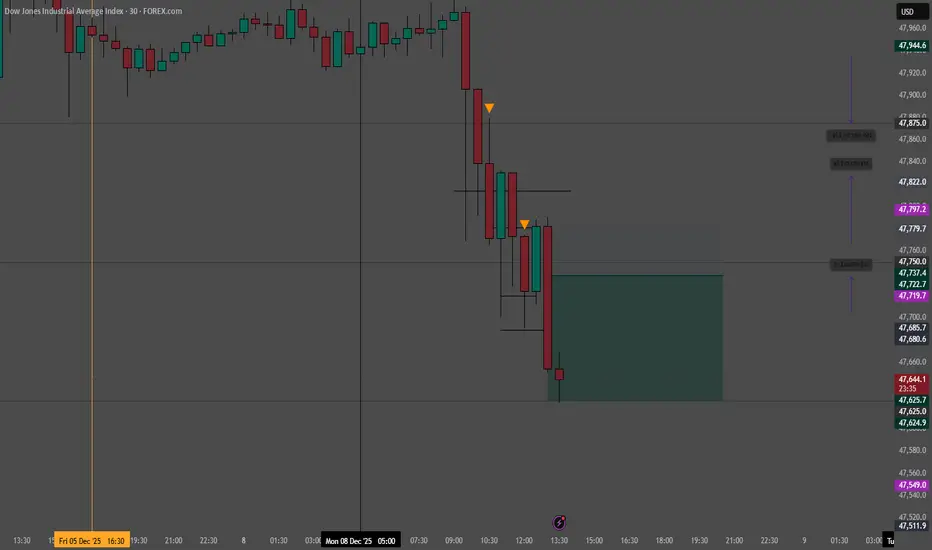
US30 patienceSells? This is a setup I tend to look for. As I explained in my previous post. I look for clear direction obvious pull back and a continue in that direction. I'm watching this on a 30min TF. I'm still waiting on confirmation of continuation even if its 600 points. It's already touched 3 quarter levels since 5AM. If I get in for sells my first target it 47,625.

US30 analysisFirst post! I wanted to try something different and new by posting my understandings of US30. US30 tends to fake out before the real move. In my chart I like to label what I would consider whole number quarter levels. I like to wait to see some sort of opposite candle of the overall potential continuation. My Take profits are usually from 600-1250 of a continuance of the move for the day.
US30 Long
I'm watching a potential buy opportunity on US30. The supply zone looks like it's failing to hold, so my bias is shifting toward a long position.


US30 Dow Jones Weekly Open Retest Strategy’m watching US30 (Dow Jones) closely right now, and it’s been in a strong bullish trend over the last two weeks. 📈🔥 We’ve seen two powerful drives to the upside, and there’s a good chance we could get that classic third drive completing a three-drive pattern before the week ends.
As price pushed higher, it’s already dipped back down into sell-side liquidity, clearing out those resting lows. That kind of move often sets the stage for another leg higher, so it’s definitely possible we see US30 continue north from the current levels. ⬆️💰
At the same time, it wouldn’t surprise me to see price pull back a bit more, possibly dipping below the weekly open to rebalance before making its next move.
Either way, my focus is on the weekly open. I want to see price break through it, come back, retest it, and show me that the level is now acting as support. That retest is the zone where I’d be interested in looking for long opportunities. 🟩📊
Stay patient and wait for clean structure.
Not financial advice.

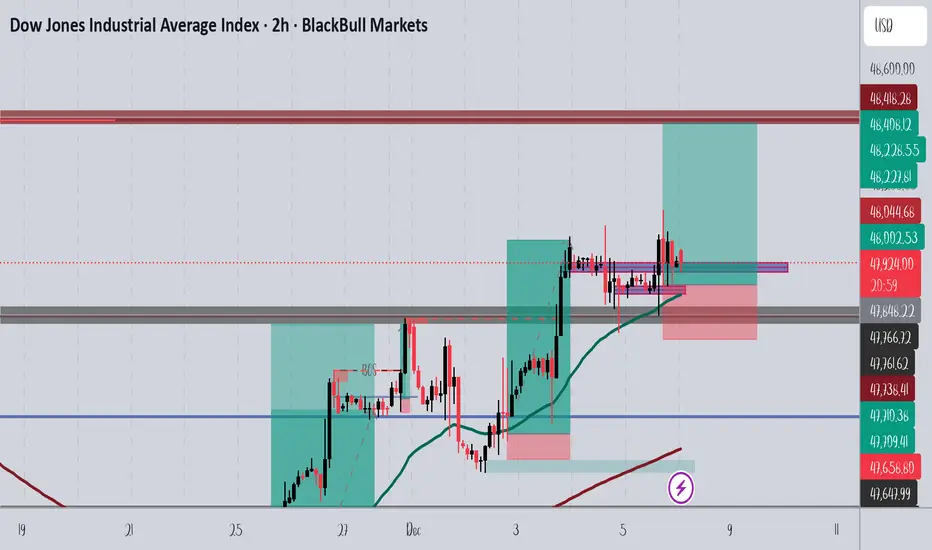
US30 -2HR SetupPrice is holding above the demand zone after a clean break of structure. As long as this level is maintained, bullish continuation toward the next resistance remains in play.
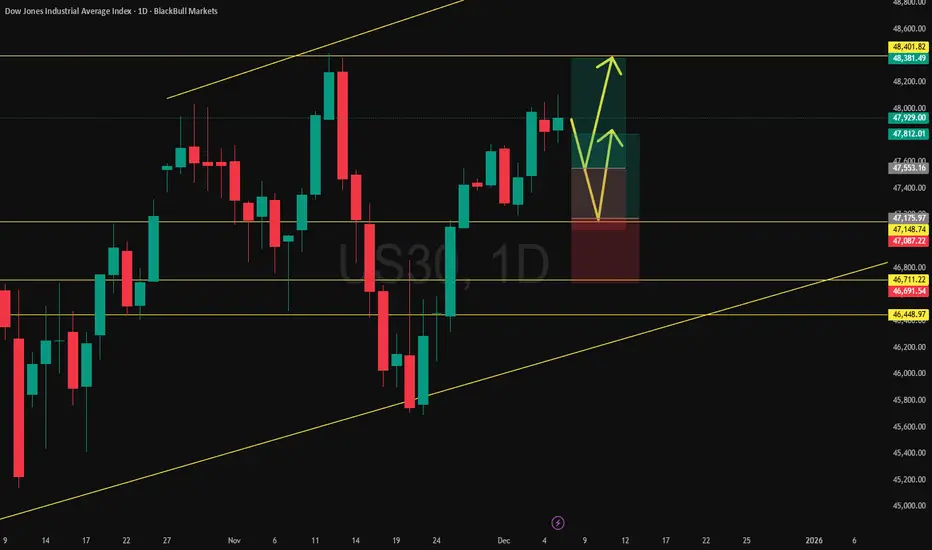
US30: Targeting the Top of the Upward Channel via Two RetracemenUS30 continues to climb within a broad upward-sloping channel, and the bias remains toward a run into the channel high.
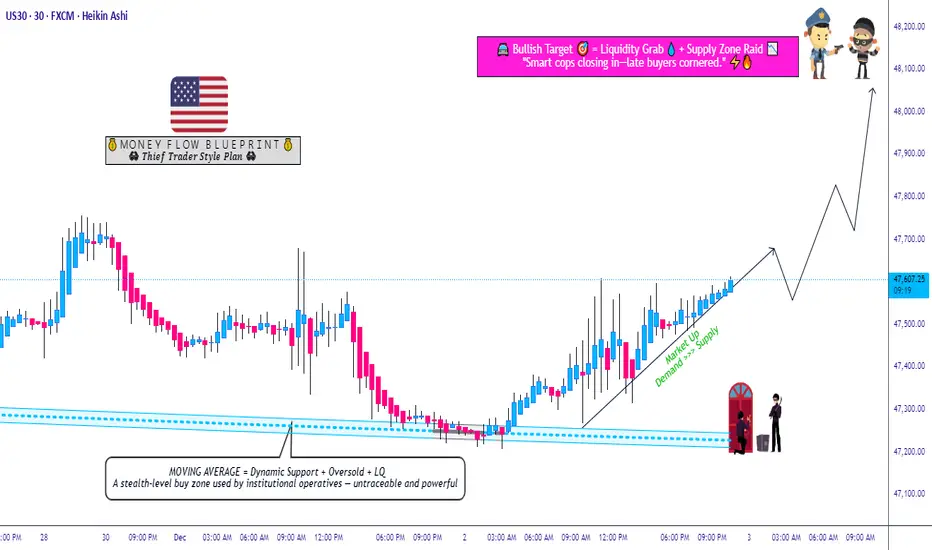
US30 Bullish Plan! Layered Entries + Clean Targets Mapped🔥 DOW JONES (US30) BULLISH PULLBACK - THIEF STRATEGY LAYER ENTRY! 🔥
📈 Asset: CAPITALCOM:US30 (Dow Jones Industrial Average CFD)
🎯 Bias: BULLISH - Strong Uptrend, MA Pullback Play
⏰ Timeframe: Day Trade / Swing
🛡️ Strategy: "THIEF LAYERING" - Multi-Level Limit Order Entry for Optimal Risk/Entry
📋 TRADE PLAN: THIEF'S LAYERED BULLISH PULLBACK
✅ CONDITION:
Bullish structure intact ✅
Price pulling back towards key Moving Average support ✅
This is a "Buy the Dip" setup for continuation.
🎯 ENTRY STRATEGY (THIEF LAYER METHOD):
Use MULTIPLE BUY LIMIT ORDERS to scale into the trade.
Suggested Layers (Adjust based on your capital):
➡️ Layer 1: 47,300
➡️ Layer 2: 47,400
➡️ Layer 3: 47,500
You can increase or decrease layers based on your own analysis.
⛔ STOP LOSS (THIEF OG's NOTE):
Initial SL: 47,200 (below key structure)
⚠️ IMPORTANT: Adjust your SL based on YOUR OWN RISK & STRATEGY. I am not responsible for your SL. Trade at your own risk.
🎯 TAKE PROFIT (ESCAPE THE POLICE BARRICADE!):
Primary Target: 48,100
This zone acts as strong resistance + overbought + potential trap.
Escape with profits before the "police" (sellers) arrive!
⚠️ NOTE: You can take partial profits earlier. This is YOUR choice - manage your own trade!
📊 RELATED PAIRS TO WATCH:
TVC:DXY (US Dollar Index): ⚠️ INVERSE CORRELATION
Strong TVC:DXY = Pressure on CAPITALCOM:US30 (typically).
Watch for DXY weakness to confirm bullish CAPITALCOM:US30 momentum.
SP:SPX (S&P 500) / NASDAQ:NDX (Nasdaq 100): ✅ POSITIVE CORRELATION
If SPX/NDX are strong, likely supports CAPITALCOM:US30 rally.
Weakness here may limit CAPITALCOM:US30 upside.
TVC:VIX (Volatility Index): ⚠️ FEAR GAUGE
Rising TVC:VIX = Risk-off mood, may cap equity gains.
Stable/Low TVC:VIX supports bullish move.
EUR/USD & GBP/USD: ⚠️ DOLLAR SENSITIVITY
USD pairs can signal broad USD strength/weakness, impacting PURPLETRADING:US30.
📌 KEY NOTES FOR THIEF OG's:
This is a LAYERED ENTRY strategy - patience is key.
Adjust ALL levels based on your account size & risk tolerance.
Watch related markets for confirmation or warning signs.
YOU are responsible for your trades - manage them actively!
👍 LIKE & FOLLOW if you find this useful!
🔔 TURN ON NOTIFICATIONS for more THIEF STRATEGY setups!
💬 COMMENT below with your adjustments or questions!
#TradingView #US30 #DowJones #TradingStrategy #DayTrade #Bullish #Pullback #StockMarket #TradingIdeas #CFD #IndexTrading #ThiefStrategy #LayerTrading
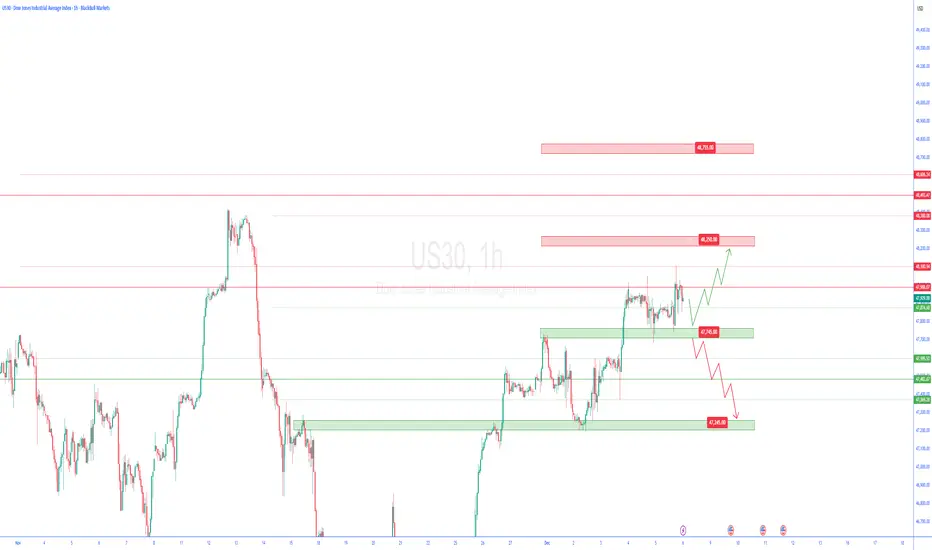
us30 1h🔹 Overall Outlook and Potential Price Movements
In the charts above, we have outlined the overall outlook and possible price movement paths.
As shown, each analysis highlights a key support or resistance zone near the current market price. The market’s reaction to these zones — whether a breakout or rejection — will likely determine the next direction of the price toward the specified levels.
⚠️ Important Note:
The purpose of these trading perspectives is to identify key upcoming price levels and assess potential market reactions. The provided analyses are not trading signals in any way.
✅ Recommendation for Use:
To make effective use of these analyses, it is advised to manually draw the marked zones on your chart. Then, on the 5-minute time frame, monitor the candlestick behavior and look for valid entry triggers before making any trading decisions.
DJI SELLGiven the divergence and price patterns and price support, you would expect the price to make this move.

Short Opportunity On US30 Dow According to Fibonacci retracement
According to Divergence on chart with CCI
According to uptrendline channel
According to Price Action

DowJones Key trading levelsKey Support and Resistance Levels
Resistance Level 1: 48710
Resistance Level 2: 48880
Resistance Level 3: 49100
Support Level 1: 47680
Support Level 2: 47480
Support Level 3: 47280
This communication is for informational purposes only and should not be viewed as any form of recommendation as to a particular course of action or as investment advice. It is not intended as an offer or solicitation for the purchase or sale of any financial instrument or as an official confirmation of any transaction. Opinions, estimates and assumptions expressed herein are made as of the date of this communication and are subject to change without notice. This communication has been prepared based upon information, including market prices, data and other information, believed to be reliable; however, Trade Nation does not warrant its completeness or accuracy. All market prices and market data contained in or attached to this communication are indicative and subject to change without notice.

US30 Trade Set Up Dec 19 2025Price is making HL on the 1h and has broken out of Asia highs so i will want to see a pull back to sweep London lows and tap into 1h FVG to then form 1-5m IFVG/CISD to go higher to PDH and supply

DowJones Bullish continuation consolidation support at 47680Key Support and Resistance Levels
Resistance Level 1: 48710
Resistance Level 2: 48880
Resistance Level 3: 49100
Support Level 1: 47680
Support Level 2: 47480
Support Level 3: 47280
This communication is for informational purposes only and should not be viewed as any form of recommendation as to a particular course of action or as investment advice. It is not intended as an offer or solicitation for the purchase or sale of any financial instrument or as an official confirmation of any transaction. Opinions, estimates and assumptions expressed herein are made as of the date of this communication and are subject to change without notice. This communication has been prepared based upon information, including market prices, data and other information, believed to be reliable; however, Trade Nation does not warrant its completeness or accuracy. All market prices and market data contained in or attached to this communication are indicative and subject to change without notice.

DowJones (DJI) IntraSwing & Future Level for 18th - 19th Dec 25DowJones (DJI) IntraSwing & Future Level
for 18th-19th Dec 25 (2:30 am)
[ 💥Level Interpretation / description:
L#1: If the candle crossed & stays above the “Buy Gen”, it is treated / considered as Bullish bias.
L#2: Possibility / Probability of REVERSAL near RLB#1 & UBTgt
L#3: If the candle stays above “Sell Gen” but below “Buy Gen”, it is treated / considered as Sidewise. Aggressive Traders can take Long position near “Sell Gen” either retesting or crossed from Below & vice-versa i.e. can take Short position near “Buy Gen” either retesting or crossed downward from Above.
L#4: If the candle crossed & stays below the “Sell Gen”, it is treated / considered a Bearish bias.
L#5: Possibility / Probability of REVERSAL near RLS#1 & USTgt
HZB (Buy side) & HZS (Sell side) => Hurdle Zone,
*** Specialty of “HZB#1, HZB#2 HZS#1 & HZS#2” is Sidewise (behaviour in Nature)
Rest Plotted and Mentioned on Chart
Color code Used:
Green =. Positive bias.
Red =. Negative bias.
RED in Between Green means Trend Finder / Momentum Change
/ CYCLE Change and Vice Versa.
Notice One thing: HOW LEVELS are Working.
Use any Momentum Indicator / Oscillator or as you "USED to" to Take entry.
⚠️ DISCLAIMER:
The information, views, and ideas shared here are purely for educational and informational purposes only. They are not intended as investment advice or a recommendation to buy, sell, or hold any financial instruments. I am not a SEBI-registered financial adviser.
Trading and investing in the stock market involves risk, and you should do your own research and analysis. You are solely responsible for any decisions made based on this research.
"As HARD EARNED MONEY IS YOUR's, So DECISION SHOULD HAVE TO BE YOUR's".
Do comment if Helpful .
Do Comment for In depth Analysis.
❇️ Follow notification about periodical View


Dow Jones Wave Analysis – 17 December 2025
- Dow Jones reversed from resistance level 49000.00
- Likely to fall to support level 47525.00
Dow Jones index recently reversed from the resistance area between the resistance level 49000.00 and the upper daily Bollinger Band.
The downward reversal from this resistance area stopped the previous minor impulse waves iii and 3.
Given the strength of the resistance level 49000.00 and the bearish divergence on the daily RSI indicator, Dow Jones index can be expected to fall further to the next support level 47525.00 (low of the previous correction ii).

DowJones Bullish continuation pattern developing? Key Support and Resistance Levels
Resistance Level 1: 48710
Resistance Level 2: 48880
Resistance Level 3: 49100
Support Level 1: 47680
Support Level 2: 47480
Support Level 3: 47280
This communication is for informational purposes only and should not be viewed as any form of recommendation as to a particular course of action or as investment advice. It is not intended as an offer or solicitation for the purchase or sale of any financial instrument or as an official confirmation of any transaction. Opinions, estimates and assumptions expressed herein are made as of the date of this communication and are subject to change without notice. This communication has been prepared based upon information, including market prices, data and other information, believed to be reliable; however, Trade Nation does not warrant its completeness or accuracy. All market prices and market data contained in or attached to this communication are indicative and subject to change without notice.
