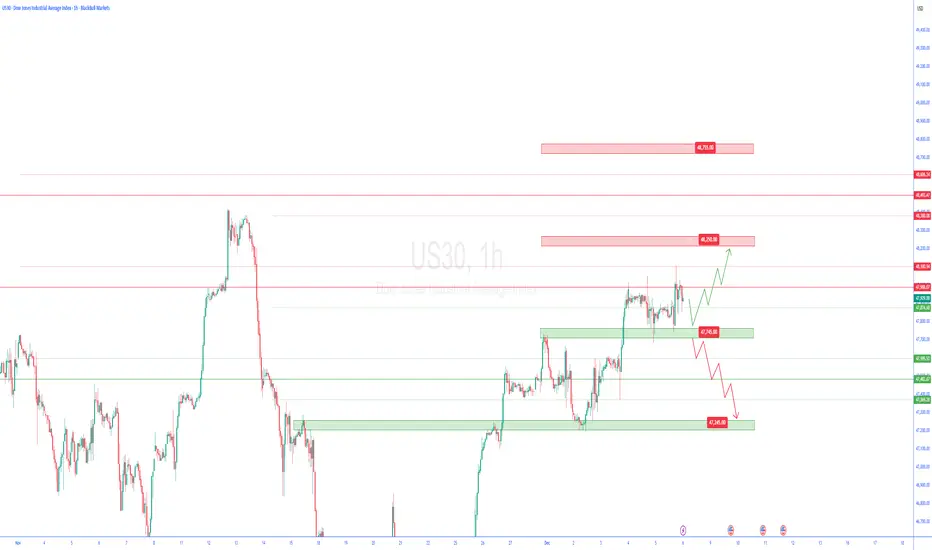
us30 1h🔹 Overall Outlook and Potential Price Movements
In the charts above, we have outlined the overall outlook and possible price movement paths.
As shown, each analysis highlights a key support or resistance zone near the current market price. The market’s reaction to these zones — whether a breakout or rejection — will likely determine the next direction of the price toward the specified levels.
⚠️ Important Note:
The purpose of these trading perspectives is to identify key upcoming price levels and assess potential market reactions. The provided analyses are not trading signals in any way.
✅ Recommendation for Use:
To make effective use of these analyses, it is advised to manually draw the marked zones on your chart. Then, on the 5-minute time frame, monitor the candlestick behavior and look for valid entry triggers before making any trading decisions.
Market insights

DowJones Bullish above support at 47530 Key Support and Resistance Levels
Resistance Level 1: 48132
Resistance Level 2: 48276
Resistance Level 3: 48420
Support Level 1: 47530
Support Level 2: 47366
Support Level 3: 47185
This communication is for informational purposes only and should not be viewed as any form of recommendation as to a particular course of action or as investment advice. It is not intended as an offer or solicitation for the purchase or sale of any financial instrument or as an official confirmation of any transaction. Opinions, estimates and assumptions expressed herein are made as of the date of this communication and are subject to change without notice. This communication has been prepared based upon information, including market prices, data and other information, believed to be reliable; however, Trade Nation does not warrant its completeness or accuracy. All market prices and market data contained in or attached to this communication are indicative and subject to change without notice.

US30 Trade Set Up Dec 5 2025Price has shifted to bearish structure failing to close higher and now making LL/LH with SSL and Daily FVGs below to target so first i want to see internal 5m-15m bearish structure to continue lower

US30 – PREMIUM OUTLOOK | Momentum Shifts at Key Resistance ZoneUS30 – Technical Overview
US30 continues to show bearish momentum as long as price remains below 47920 and 48020, with downside targets at 47720 and 47560.
Price action in this zone remains sensitive, and sellers maintain control while the index trades under these resistance levels.
However, if the market closes a 1H candle above 48020, this would signal a shift in momentum and open the way for a bullish move toward 48410.
Key Levels
Pivot Line: 47920
Support: 47730 · 47560 · 47460
Resistance: 48020 · 48320 · 48410
previous idea:

DJI: Dow jones industrial index bear trend in makingDue to divergence on RSI and MCAD, the price will have a pull back as showed. its simple but i think it will follow my idea

Dow Jones (US30) a break of 47,759 will confirm downside momentu
The rally was sold in the dip was bought, resulting in a doji-style candle being posted at the high. This highlights investor indecision at current levels.
Big Picture analysis suggests we are currently trading within the BC leg of a Butterfly formation. This pattern will be invalidated on a move through the previous swing high of 48,460. Formation will be completed on a move to 43,946.
The trend of higher highs and the previous change of structure is located at 47,759.
It should be noted that the US2000 has just hit a 261.8% extension level
Conclusion: the value trade is to the downside. A break of 47,759 will confirm downside momentum. (edited)Friday, 5 December 2025 06:45

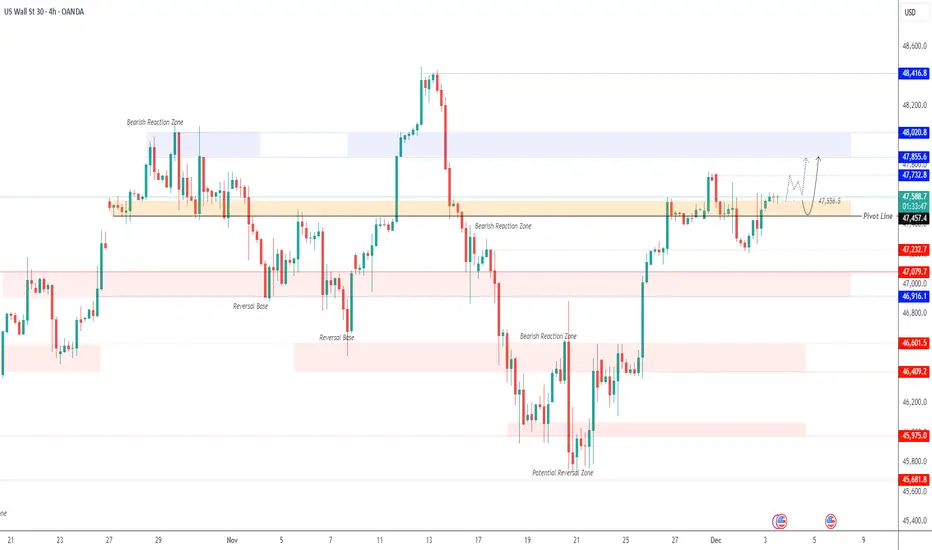
Bullish continuation setup?Dow Jones (US30) is reacting off the pivot and could bounce to the 1st resistance which is a swing high resistance.
Pivot: 47,730.53
1st Support: 47,204.31
1st Resistance: 48,435.66
Disclaimer:
The opinions given above constitute general market commentary and do not constitute the opinion or advice of IC Markets or any form of personal or investment advice.
Any opinions, news, research, analyses, prices, other information, or links to third-party sites contained on this website are provided on an "as-is" basis, are intended to be informative only, and are not advice, a recommendation, research, a record of our trading prices, an offer of, or solicitation for, a transaction in any financial instrument and thus should not be treated as such. The information provided does not involve any specific investment objectives, financial situation, or needs of any specific person who may receive it. Please be aware that past performance is not a reliable indicator of future performance and/or results. Past performance or forward-looking scenarios based upon the reasonable beliefs of the third-party provider are not a guarantee of future performance. Actual results may differ materially from those anticipated in forward-looking or past performance statements. IC Markets makes no representation or warranty and assumes no liability as to the accuracy or completeness of the information provided, nor any loss arising from any investment based on a recommendation, forecast, or any information supplied by any third party.

US30 BiasM & W: Uptrend, respecting the lows
D: Uptrend, price retraced 78.6%
4H: Uptrend, price made a lower low, possibly trending short
1H: Uptrend, price hit H4 resistance zone + RSI showing oversold and bearish divergence.
CURRENTLY: I'm looking for price to go short to retest H1 trendline, @previous resistance, and continue long.
IF price breaks below H1 trend, I'll look for price to continue short to previous major support area

us30Wall Street is ready to move to set a new high with a stop below the range or floor and target for the new high.

DOW JONES — Bullish Momentum AwakeningHigh R:R Setup | When Smart Money moving in**
The Dow Jones is entering the same structural phase that typically precedes strong and sustained bullish expansions.
Smart Money has completed a clean liquidity sweep beneath recent lows, and price is now shifting into a clear expansion phase.
🔹 Why I remain strongly bullish
1. Confirmed Break of Structure
A decisive break above the last lower highs gives the first Smart Money signal for trend continuation.
2. Perfect Liquidity Grab at the Lows
The classic sweep before major bullish impulses.
Stops cleared → Smart Money positioned.
3. Orderflow is clearly bullish
Both 4H and Daily show buyer dominance with strong, impulsive candles.
4. Extremely high Risk–to–Reward available
On the first clean pullback, the setup offers R:R between 1:40 and 1:125, depending on entry precision.
🎯 Primary Bullish Scenario
As long as price holds above 46300, the bullish structure remains fully valid.
Upside targets:
48,600
49000
Final target: 49400
All levels are aligned with market geometry, liquidity maps, and Fibonacci extension zones.

DowJones key support at 47530Key Support and Resistance Levels
Resistance Level 1: 48132
Resistance Level 2: 48276
Resistance Level 3: 48420
Support Level 1: 47530
Support Level 2: 47366
Support Level 3: 47185
This communication is for informational purposes only and should not be viewed as any form of recommendation as to a particular course of action or as investment advice. It is not intended as an offer or solicitation for the purchase or sale of any financial instrument or as an official confirmation of any transaction. Opinions, estimates and assumptions expressed herein are made as of the date of this communication and are subject to change without notice. This communication has been prepared based upon information, including market prices, data and other information, believed to be reliable; however, Trade Nation does not warrant its completeness or accuracy. All market prices and market data contained in or attached to this communication are indicative and subject to change without notice.

US30 Trade Set Up Dec 4 2025Price remains bullish so i am expecting price to sweep SSL and/or tap into 4h FVG to then look for internal 1m-5m IFVG/CISD to continue higher to PDH and higher BSL/supply

US30 – MARKET OUTLOOK | December Optimism Meets Key Data RisksUS30 (Dow Jones) – Technical Overview
The Dow Jones posted a modest gain on Tuesday, rising 185 points, as traders embraced a bit of December optimism. Even small upticks count in a holiday month—especially with markets looking for positive momentum amid mixed macro signals.
Volatility is expected to increase ahead of today’s ADP employment data, which may influence risk sentiment across equities.
Technical Analysis
US30 maintains bullish momentum while trading above 47560, with upside targets at 47720 and 47855.
A breakout above these resistance zones may extend the move toward 48020.
However, a 1H or 4H close below 47460 will shift momentum into a bearish correction, opening the way toward 47230 and 47100.
Pivot Line: 47560
Resistance: 47710 · 47860 · 48020
Support: 47460 · 47230 · 47100
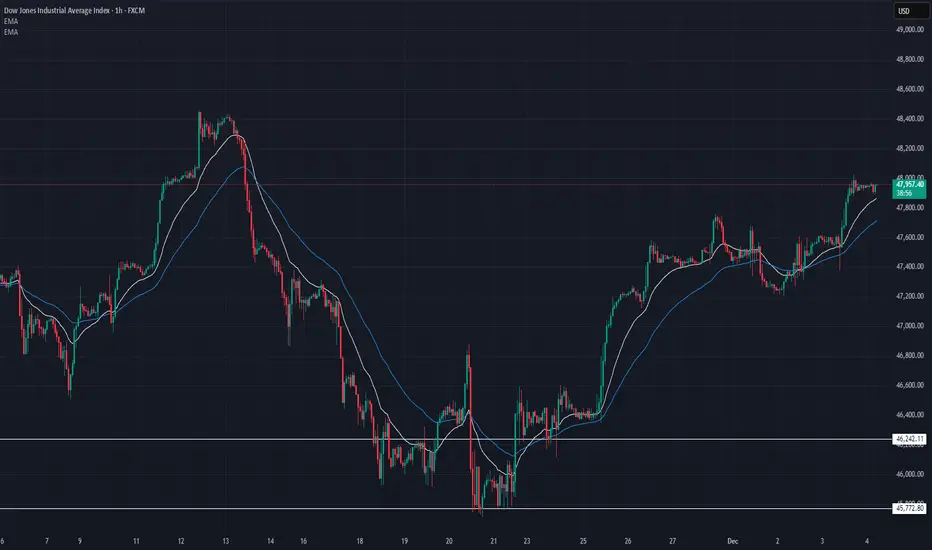
US30 Technical Breakdown – 12/04/2025📍 US30 Technical Breakdown – 12/04/2025
US30 pushed back into the 47,950–48,000 resistance zone after a clean trend continuation, with price now stalling near the highs. Bulls remain firmly in control as EMAs continue to slope upward, but momentum is slowing as we approach a major supply area 🔍📈.
📊 Market Behavior:
🔹 Strong push into 48,000 → buyers testing major resistance
🔹 EMAs wide + rising → bullish momentum still intact
🔹 Small consolidation forming → early signs of exhaustion
🔹 Higher lows consistently defended → bulls still holding structure
📌 Key Levels:
🔹 Resistance:
48,000 → major psychological level + current rejection
47,955 → intraday supply (current stall zone)
47,780 → key prior breakout level
🔹 Support:
47,720 → immediate intraday support
47,560 → secondary support / EMA zone
46,960 → deeper demand if trend breaks
🧠 Bias:
Bullish while above 47,720 📈
📈 Break & hold above 48,000 → continuation toward 48,200 → 48,350
📉 Break below 47,720 → opens path to 47,560 → 47,300
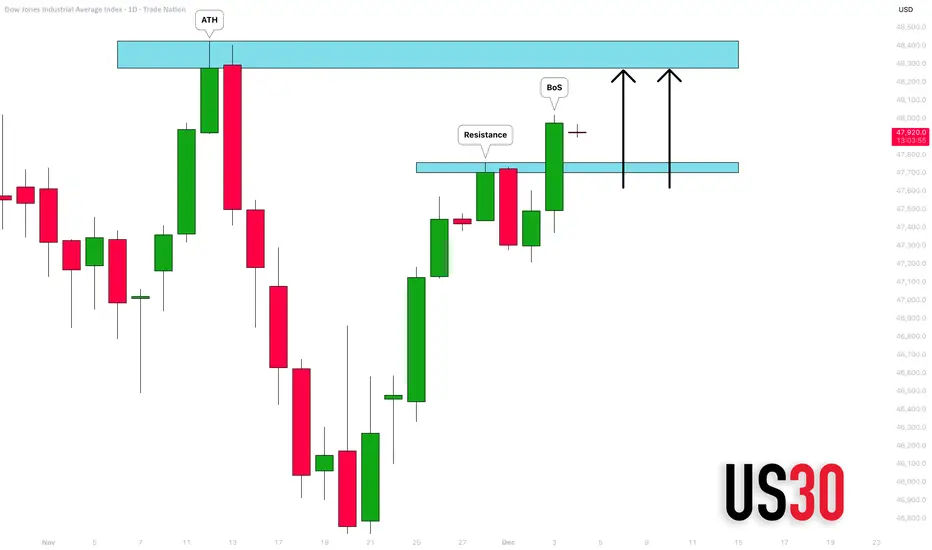
DOW JONES INDEX (US30): Confirmed BoS
With the yesterday's fundamental US news releases and
Trump's speech, US30 bounced strongly.
The market violated a significant daily resistance cluster
and closed above that.
It opens a potential for more growth to a resistance based
on a current All-Time High.
❤️Please, support my work with like, thank you!❤️
I am part of Trade Nation's Influencer program and receive a monthly fee for using their TradingView charts in my analysis.
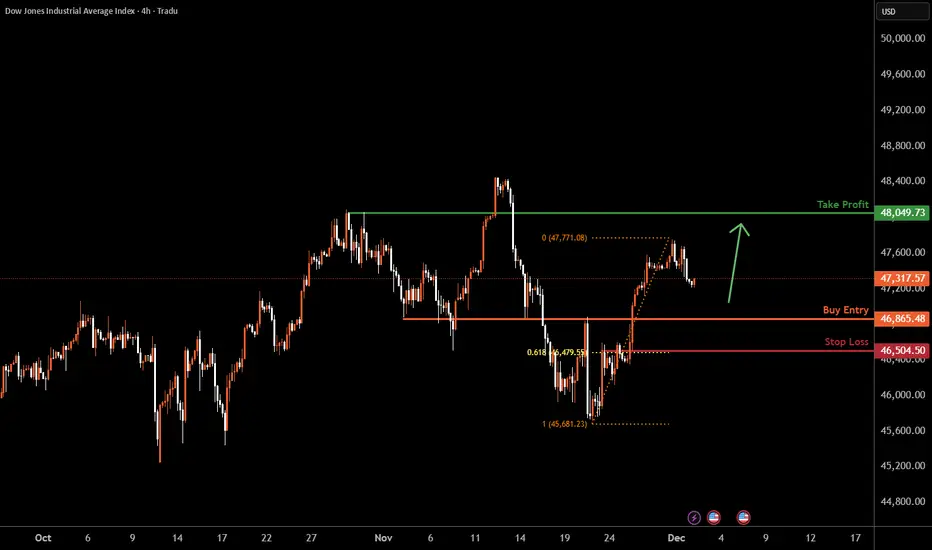
US30 H4 | Falling Towards Key SupportMomentum: Bullish
Price is pulling back toward our buy entry, which has been identified as an overlap support zone.
Buy Entry: 46,865.48
Strong overlap support
Stop Loss: 46,504.50
Pullback support
61.8% Fibonacci retracement
Take Profit: 48,049.73
Pullback resistance
High Risk Investment Warning
Stratos Markets Limited (tradu.com ), Stratos Europe Ltd (tradu.com ):
CFDs are complex instruments and come with a high risk of losing money rapidly due to leverage. 70% of retail investor accounts lose money when trading CFDs with this provider. You should consider whether you understand how CFDs work and whether you can afford to take the high risk of losing your money.
Stratos Global LLC (tradu.com ): Losses can exceed deposits.
Please be advised that the information presented on TradingView is provided to Tradu (‘Company’, ‘we’) by a third-party provider (‘TFA Global Pte Ltd’). Please be reminded that you are solely responsible for the trading decisions on your account. Any information and/or content is intended entirely for research, educational and informational purposes only and does not constitute investment or consultation advice or investment strategy. The information is not tailored to the investment needs of any specific person and therefore does not involve a consideration of any of the investment objectives, financial situation or needs of any viewer that may receive it. Past performance is not a reliable indicator of future results. Actual results may differ materially from those anticipated in forward-looking or past performance statements. We assume no liability as to the accuracy or completeness of any of the information and/or content provided herein and the Company cannot be held responsible for any omission, mistake nor for any loss or damage including without limitation to any loss of profit which may arise from reliance on any information supplied by TFA Global Pte Ltd.
US30 We see price rejecting and at the sametime confirming continuation to the bullish side to being bullish after the newly formed demand zone price failed to break below it. Which indicate the is is a strong demand zone.


US30 - LongUS30 is on upward trend and is trading in the upward channel. Long it if it breaks above 48 on 5 min candle and do not break its low in the next candle. Crucial levels 48 and on downside 47.87.
Take trades on your own risk.

US30 - DOW Hits Major Supply Reversal coming on Dow as it hits a major supply zone. This is part of a bigger cross-asset move that I am anticipating across global equities. I see a synchronised sell off in global equities coming this month.

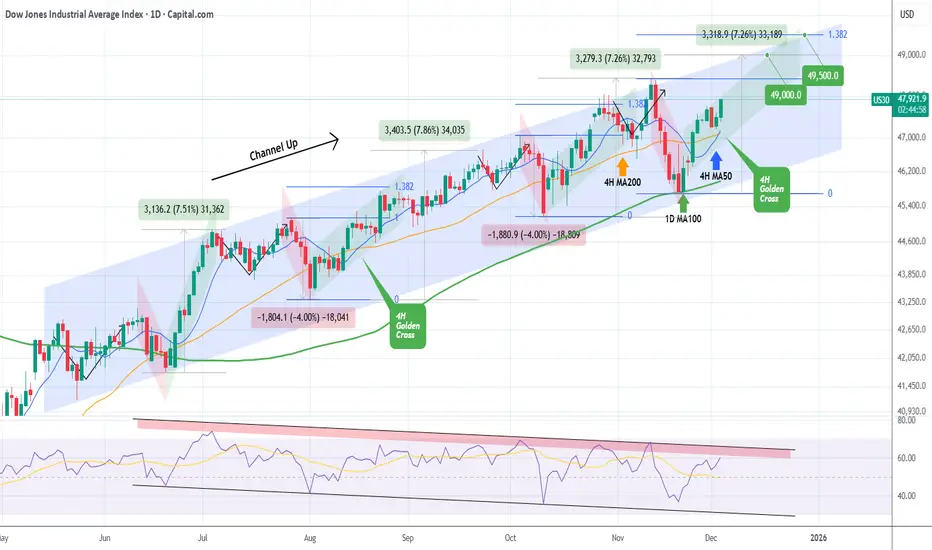
DOW JONES formed its first 4H Golden Cross since August. BullishDow Jones (DJI) has been trading within a 6-month Channel Up and today it formed its first 4H Golden Cross since August 15. Coming off a Higher Low bottom 2 weeks ago on the 1D MA100 (green trend-line), we are currently on the new Bullish Leg of the pattern.
The last one rose by +7.26%, roughly the % amount of the previous two as well, so our immediate Target remains 49000 as we've shown on last weeks analysis.
This time we also see an over-extended Target if the end-of-year rally lasts a bit longer, on the 1.382 Fibonacci extension at 49500, as this level has been hit on every Bullish Leg of this pattern.
If the 1D RSI though hits its Lower Highs Zone (red) earlier, it might be a good idea technically to book profits before those Targets are reached.
---
** Please LIKE 👍, FOLLOW ✅, SHARE 🙌 and COMMENT ✍ if you enjoy this idea! Also share your ideas and charts in the comments section below! This is best way to keep it relevant, support us, keep the content here free and allow the idea to reach as many people as possible. **
---
💸💸💸💸💸💸
👇 👇 👇 👇 👇 👇
DowJones (DJI) IntraSwing & Future Level: 03rd - 04th Dec 2025DowJones (DJI) IntraSwing & Future Level: 03rd Dec - 04th Dec 2025 (2:30 am)
✍🏼️ "Future IntraSwing Levels" mentioned in BOX format.
[ Level Interpretation / description:
L#1: If the candle crossed & stays above the “Buy Gen”, it is treated / considered as Bullish bias.
L#2: Possibility / Probability of REVERSAL near RLB#1 & UBTgt
L#3: If the candle stays above “Sell Gen” but below “Buy Gen”, it is treated / considered as Sidewise. Aggressive Traders can take Long position near “Sell Gen” either retesting or crossed from Below & vice-versa i.e. can take Short position near “Buy Gen” either retesting or crossed downward from Above.
L#4: If the candle crossed & stays below the “Sell Gen”, it is treated / considered a Bearish bias.
L#5: Possibility / Probability of REVERSAL near RLS#1 & USTgt
HZB (Buy side) & HZS (Sell side) => Hurdle Zone,
*** Specialty of “HZB#1, HZB#2 HZS#1 & HZS#2” is Sidewise (behaviour in Nature)
Rest Plotted and Mentioned on Chart
Color code Used:
Green =. Positive bias.
Red =. Negative bias.
RED in Between Green means Trend Finder / Momentum Change
/ CYCLE Change and Vice Versa.
Notice One thing: HOW LEVELS are Working.
Use any Momentum Indicator / Oscillator or as you "USED to" to Take entry.
⚠️ DISCLAIMER:
The information, views, and ideas shared here are purely for educational and informational purposes only. They are not intended as investment advice or a recommendation to buy, sell, or hold any financial instruments. I am not a SEBI-registered financial adviser.
Trading and investing in the stock market involves risk, and you should do your own research and analysis. You are solely responsible for any decisions made based on this research.
"As HARD EARNED MONEY IS YOUR's, So DECISION SHOULD HAVE TO BE YOUR's".
Do comment if Helpful .
