Get ready for the 9thThis channel is not providing individualized trading or investment advice, nor is it a banking service, brokerage service, trading service, investment service or money management service
About Volatility S&P 500 Index
VIX is a trademarked ticker symbol for the CBOE Volatility Index, a popular measure of the implied volatility of S&P 500 index options; the VIX is calculated by the Chicago Board Options Exchange (CBOE). Often referred to as the fear index or the fear gauge, the VIX represents one measure of the market's expectation of stock market volatility over the next 30-day period.
Related indices

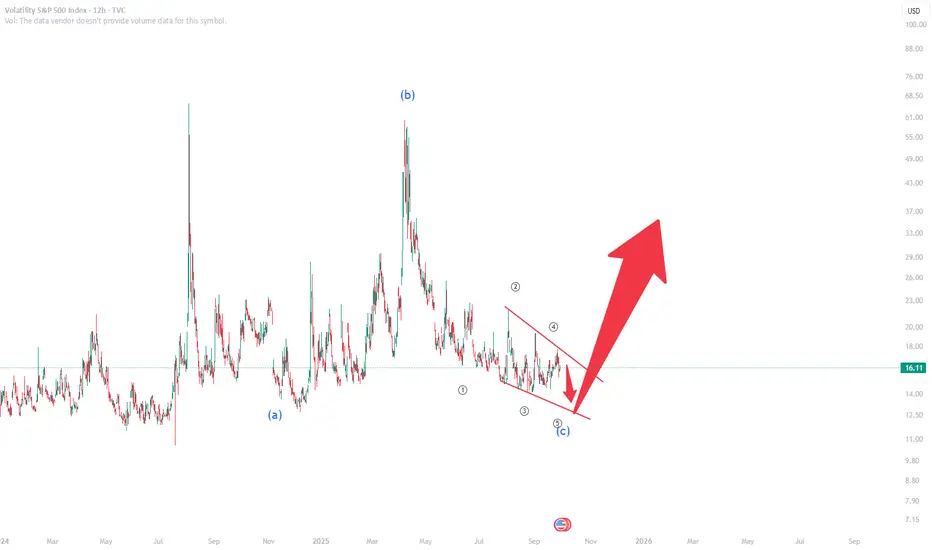
Greedy traders BEWAREThe VIX showing strong signs of bursting this little AI bubble we've got going. I'm looking for a healthy pullback in markets before climbing to ATH in a few months.

VIX Index – Elliott Wave Analysis: Diagonal C CompletionThe VIX index is finalizing an A-B-C corrective structure, with the C-leg forming as a diagonal. Price action suggests this structure is close to completion. Once the diagonal ends, the probability of a sharp upside move in volatility becomes highly likely.
Why does this matter?
A rising VIX refle
VIX set-up....interesting week aheadTo the untrained eye, you see VIX go up and down, just like any other time. Taking a big step back, you'll know that VIX has been super complacent (very strange looking back 30 years) for about 6 months. Over the last few days, we see SMA9 crossing UP SMA50! Why does this matter? Because when VIX sp

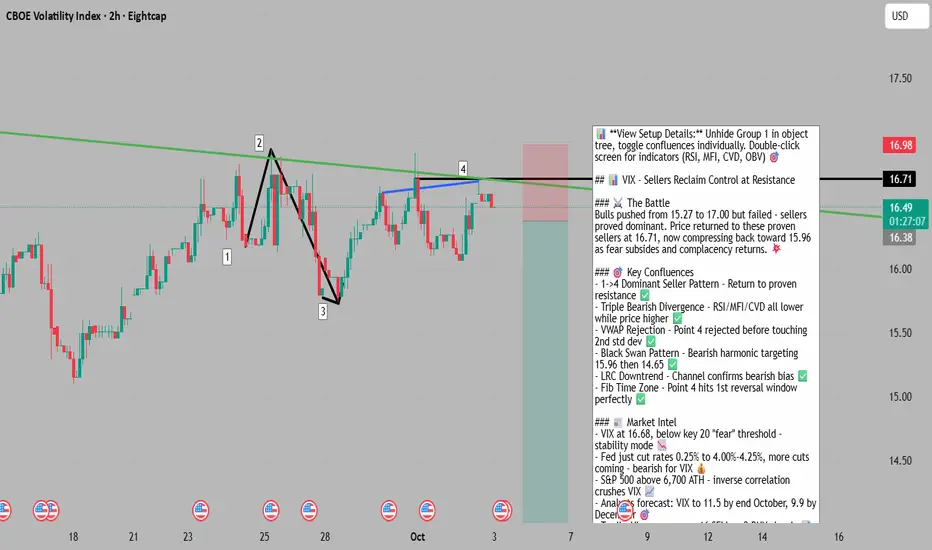
Sellers Reclaim Control at Key Resistance - 15.96 Beckons📊 **To view my confluences and linework:**
Step 1️⃣: Grab the chart
Step 2️⃣: Unhide Group 1 in the object tree
Step 3️⃣: Hide and unhide specific confluences one by one
💡 **Pro tip:** Double-click the screen to reveal RSI, MFI, CVD, and OBV indicators alongside divergence markings! 🎯
Title: 🎯 VI
Market Volatility: Introduction and Types1. Introduction to Market Volatility
1.1 Definition of Market Volatility
Market volatility refers to the rate and magnitude of price fluctuations in a financial market over a given period. It is a measure of the risk or uncertainty associated with the changes in the value of assets, securities, or
VIX caution> 16.50 ... slightly bearish (rising VIX)
< 15.99 ... bullish
this is how i'm measuring fear/greed/volatility. last week we were over 17 for a bit. will data or headlines cause us to rise over 17 again this week or next?
hmmmm.... we shall see.
*NFLX keeps playing around 1200. just break down.

Market is awfully bullishThe market in general is very bullish with many indices moving up higher and higher, but the price of gold has also been moving up higher which historically this doesn't end well. This could also mean that many allocation models have funds and liquidity being put into them. The bullish momentum can

Bears Trapped at Resistance - Volatility Squeeze Imminent📊 To see my confluences and/or linework, step 1: grab chart, step 2: unhide Group 1 in object tree, step 3: hide and unhide specific confluences. 😊
🎯 VIX: Bears Trapped at Resistance - Volatility Squeeze Imminent
The Market Participant Battle:
The volatility bears who successfully crushed VIX

SPX updateLikely higher still over 6700 with a divergent low on the vix still to come. After that, we may see a stronger and more consistent move down.

See all ideas
Summarizing what the indicators are suggesting.
Oscillators
Neutral
SellBuy
Strong sellStrong buy
Strong sellSellNeutralBuyStrong buy
Oscillators
Neutral
SellBuy
Strong sellStrong buy
Strong sellSellNeutralBuyStrong buy
Summary
Neutral
SellBuy
Strong sellStrong buy
Strong sellSellNeutralBuyStrong buy
Summary
Neutral
SellBuy
Strong sellStrong buy
Strong sellSellNeutralBuyStrong buy
Summary
Neutral
SellBuy
Strong sellStrong buy
Strong sellSellNeutralBuyStrong buy
Moving Averages
Neutral
SellBuy
Strong sellStrong buy
Strong sellSellNeutralBuyStrong buy
Moving Averages
Neutral
SellBuy
Strong sellStrong buy
Strong sellSellNeutralBuyStrong buy
Displays a symbol's price movements over previous years to identify recurring trends.
Frequently Asked Questions
Volatility S&P 500 Index reached its highest quote on Oct 24, 2008 — 89.53 POINT. See more data on the Volatility S&P 500 Index chart.
The lowest ever quote of Volatility S&P 500 Index is 8.56 POINT. It was reached on Nov 24, 2017. See more data on the Volatility S&P 500 Index chart.
Volatility S&P 500 Index value has decreased by −1.56% in the past week, since last month it has shown a 9.18% increase, and over the year it's decreased by −25.00%. Keep track of all changes on the Volatility S&P 500 Index chart.
Volatility S&P 500 Index is just a number that lets you track performance of the instruments comprising the index, so you can't invest in it directly. But you can buy Volatility S&P 500 Index futures or funds or invest in its components.