VIX Continue to dropAs predicted, VIX hit resistance on 4th sep and it starting to drop on the following week.
We are seeing almost all indices hit support and bounce starting week of 8 sep where bargain hunting and buy on dip signal appears in most of the US stocks
VIX has making 7 consecutive lower lows which very likely it will bounce (Stock might take a hit for this bounce. So be careful, do not chase if you miss last week's bargain hunting)
[ US Indices and Sectors ]
Generally most indices are showing bullish rebounce from support. However the bullish reversal doesn't seems to be strong (No Fast Turtle Buy except Technology Sector (XLK) and Nasdaq. Nasdaq FiFT still -ve which indicating BEAR is relatively stronger.
Summary :- Last week we are seeing rebounce from strong sell-off. Considering Nasdaq FiFT still -ve, i worry this is just a technical rebounce (meaning BEAR is not done).
Hence, short term trader may apply hit and run strategy (take profit when Fast Turtle Sell appear)
NOTE :- 17 Sep, FOMC will make a statement and gives their economic projection which will give a major impact to the global financial market.
[ Bursa Market ]
Similar to US, most of the Bursa indices also bounce from support and forming reversal candles with Fast Turtle Buy.
FKLI bounce from 1500 with fast turtle buy and FiFT turned +ve. This is good news.
ACE Market also trigger SLOW turtle BUY but currently at resistance. Chances of breaking the resistance looks good judging from 3 solid Bullish candles.
Construction, Plantation, Technology, Healthcare and Industrial Products appear to be stronger sectors to focus on.
*** Watchlist from 15 Sep ***
Industrial Product
AEM
KPS
SKPRES
ANNJOO - Long consolidation. Volume spike. Wait for breakout.
RGTBHD - BoD
VS
DNONCE
DUFU - FiFT turned +ve
ESCERAM (Ace Market) - BoB above 1.485
Technology
AEMULUS (Ace Market) - BoD with VOLUME
FRONTKN - Fast Turtle BUY. FiFT still -ve.
INARI - BoD, pullback with low volume.
MI - BoD near EMA50 support (**Good Risk Reward Ratio)
PENTA - BoD. Slow Turtle Buy above 4.
UWC - FiFT turned green.
Plantation
BPLANT - Slow Turtle Buy with VOLUME
JTIASA - Wait for breakout about .75
Healthcare
LKL (ACE Market) - Need to break 1.3 to rally
HARTA - BoD but BEARISH. Hit and Run
KOSSAN - BoD but FiFT -ve and Bearish.
PHARMA - BoD
SUPERMX - BoD confirmed with gap up. Need to break 9.8 to continue the rally.
TOPGLOV - BoD confirmed with gap up. Need to stay above 8. Next Resistance is around 9.3 zone.
FINANCE
FINTEC (ACE Market) - BoD, FiFT +ve
Trade ideas
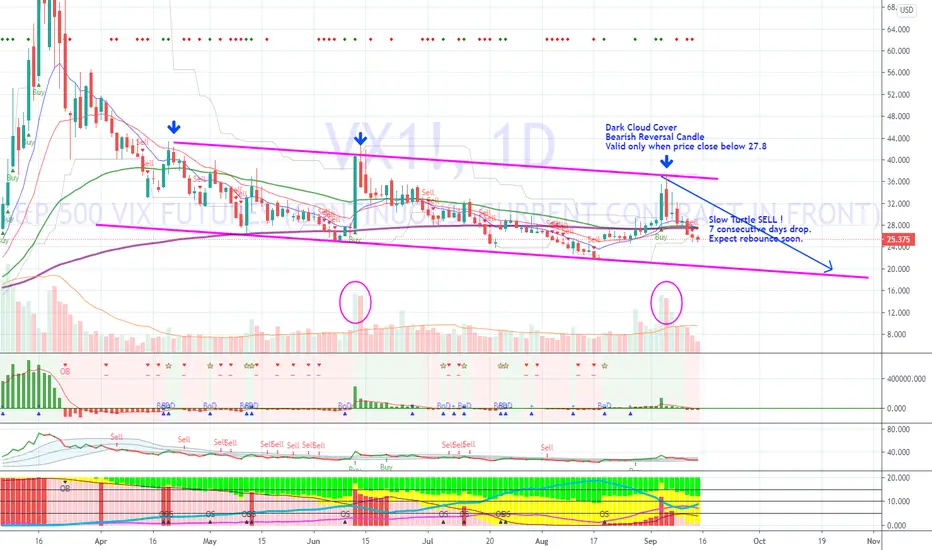
VIX - Dark Cloud Cover at Resistance, Hammer on Major indicesVIX is bullish since BoD signal on 19 Aug.
VIX is seems to hit resistance on 4 Sep and form Dark Cloud Cover Bearish Reversal Candle.
This Reversal is valid only if VIX drop and close below 27.8.
FiFT still +ve and ATOM still BUY.
However, there is a sign of Hidden Bearish Divergence.
Note: We want to see VIX to go down in order to have Stock to go up. VIX is normally use to gauge investor sentiment or fear. If VIX up, Fear is increase. Thus Stock down.
The chart showing that VIX is still bullish but potentially hit the resistance and ready to pullback based on Bearish candle pattern and Hidden Bearish Divergence formation.
FiFT is still +ve but the BULL force is significantly reduced. ATOM is still Buy.
No sell signal seen on VIX chart yet.
Major Indices:-
Mostly close with Hammer candle and supported by key EMA20 / EMA50 level.
SGX Stock Watchlist (4 Sep) - Filtering Criteria : Price > 0.10 Vol > 500K, Price > EMA50, EMA20 > EMA50, Turtle, FiFT, BoD and Volume Ratio
Frasers Cpt Tr :FiFT +ve signal with ATOM. Volume is 1.8 time higher than previous day volume.
SoilbuildBizReit : Slow Turtle Buy with ATOM. However, volume is lower then previous day. Price is 12% above EMA20. Might be too high to chase.
UG Healthcare – Buy on Dip candidate. Fast Turtle Buy with higher volume (1.3 time higher than previous day). Seems to be supported at EMA50 but FiFT and ATOM still SELL.
BURSA Stock Watchlist(4 Sep) - Filtering Criteria : Price > 0.30 Vol > 2mil, Price > EMA50, EMA20 > EMA50, Turtle, FiFT, BoD and Volume Ratio
BPlant - Slow Turtle BoB with volume, FiFT Spike and ATOM Buy
D&O - Cup and Handle breakout hittin first target at 1.1. Volume buildup, ATOM Buy and FiFT +ve
DANCO - Slow Turtle and Fast Turtle Buy, FiFT +ve signal, ATOM BUY. 0.615 target hit. Next is 0.675
THPlant - Breaks 0.38-0.40 with volume. Slow Turtle Buy, BoD spot on. FiFT +ve. ATOM Buy. Next target 0.47
APPASIA - Bounce from Fibo 0.386. Buy on DIP with star. FiFT +ve, ATOM price line GREEN. Fast Turtle Buy. Volume spike up..
MMAG - Hit first Rounding Bottom Target 0.565. FiFT +ve, ATOM Buy, Slow Turtle Buy. Wait for pullback.
NASDAQ Stock Watchlist(4 Sep) - Filtering Criteria : Price > 40 Vol > 2mil, Price > EMA50, EMA20 > EMA50, Turtle, FiFT, BoD and Volume Ratio
CAESARS Ent – FiFT Signal with ATOM. Breaks 47.32. Next Target 54.6
BROADCOM – FiFT signal with ATOM. Volume is 1.4x of yesterday volume. Price is 6% above EMA20 and 11% above EMA50. Good candidate if you can risk 12% (SL below EMA50)
Immunomedics – FiFT signal with relatively higher Volume. Price near key EMA with attractive Risk Reward Ratio


SPX 500 compared with VIXSo here is an easy ta for SPX 500 compared with VIX:
Last days bulls bounced off from 50 SMA (3206) and now try to break 3240 resistance. So range we moved last weeks is from 3000 as very important support to 3240.
I guess next weeks could be important because there bulls and bears will decide, if the double top pattern is finally finished or failed.
Furhtermore, RSI and MACD showing overbought signals and as well, there is divergence between trend up in SPX and trend down in RSI.
Please watch VIX and SPX on 8 th of June: Both are rising up which is a very rare signal and next move was a big red candle down to 3000 support. This happend on 26 support on vix. Other support on VIx was formed last days on 27.
All together: If SPX could get over 3240 and hold this next move is open to ATH. If SPX will bounce off again take care for 3000 support. Everything under this support will finish the double top pattern.
Volume is normal.
For all swingtraders- its your time, I think.
Good luck for your trading :)

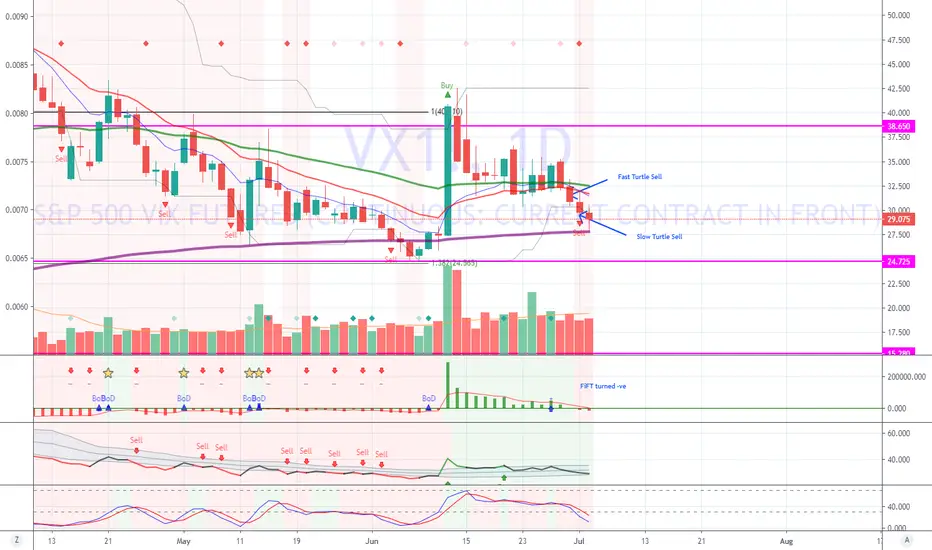
VIX Fast Turtle Sell - Bull start to party9 Jun – VIX Fast Turtle Buy on Dip (First Warning)
11 June – FiFT Turned GREEN. Market sell-off
12 June to 28 June – High volatility. Many people buy high sell low. Trapped.
Most people lose money between 9 to 28 June.
30 June – VIX Fast Turtle Sell (Market start to rally)
1 July – VIX Slow Turtle Sell. FiFT Turned RED.
Note that EMA200 is next support level that VIX need to break..

Vix August futures going higherAugust will be a politically volatile month. VIX Aug futures r 2nd most active series. Technically the mkt remains above the Longest Line so value favors the highs. The Andrew's Pitchfork is trending up with good target levels against UML (red arrow/MIN target) Watch for violation of recent VIX highs at 37-38. Note the boxes, maybe repeating again heading into August.

VIX Here is an easy ta for VIX.
Vix felt on support from march and formed bull flag pattern last week.
BB are open so bullish signal.
RSI bullish signal 7,50 (same as in February)
My opinion:
Wait for conformation from SP500 (2730) or start trade with stop loss at 32.
Anyway, next weeks could be interesting in case of new spread of corona.
Good luck for your trading :)

VIX - Fast Turtle BuySome of you contacted me asking why today's market drop..
Well, you don't have to know the reason, but it's important to check VIX chart every morning before you trade.
As previously shared, when VIX up, stock market down.
Yesterday, we are seeing VIX shows fast turtle buy (DJ fast turtle Sell)... and today, FKLI follow with 1.8% drop and triggered fast turtle sell signal.
Generally DJ and FKLI still uptrend with FiFT still +ve.
However, I will be staying aside until retracement is done.

Example of Volatility Futures Dictating the Market, AgainCurious why there's a hold-up?
It's S&P volatility, once again. It is weird though; don't see much "volatility" at all.
What I have seen many times throughout this rally is that VX futures hold back the market from moving, and it is both strange and boring to watch.
Seems Fibonacci exists everywhere, especially in the Vix-ish domain. The idea that the cross between laughably random EMAs may seem like a joke, but it is not.
TradingView does not have hourly calculations, but this is close enough. Investing.com has precise measures, so you can watch the world's most boring show there if you are uncertain about where the market is heading.
Just going to wait for the crossover before celebrating because I have seen this story drag on unnecessarily long too many times.
CBOE:VIX
SPCFD:SPX

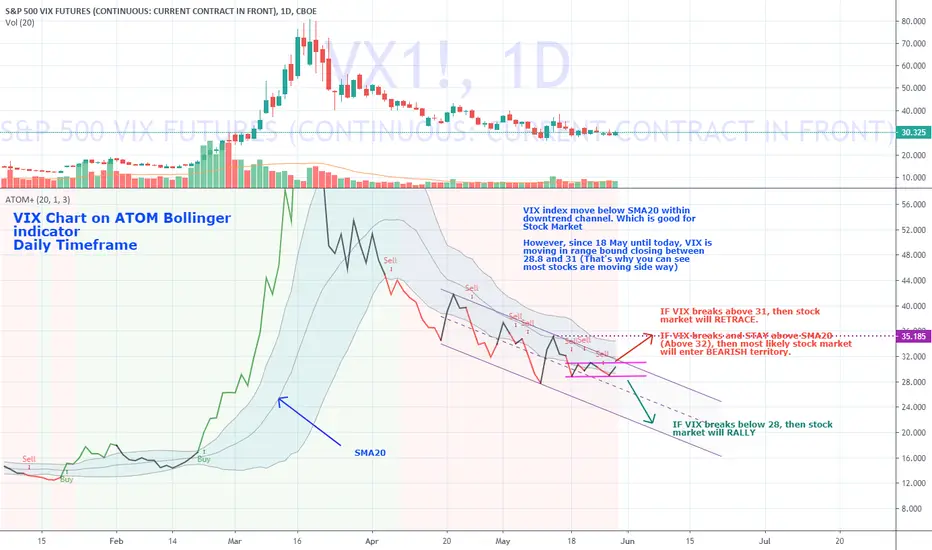
VIX Moving in Range Bounce. Be CautiousVIX index move below SMA20 within downtrend channel. Which is good for Stock Market
However, since 18 May until today, VIX is moving in range bound closing between 28.8 and 31 (That's why you can see most stocks are moving side way)
MONITOR
IF VIX breaks above 31, then stock market will RETRACE.
IF VIX breaks and STAY above SMA20 (Above 32), then most likely stock market will enter BEARISH territory.
IF VIX breaks below 28, then stock market will RALLY
VIX ranging between 2 EMA - Be cautiousWe want VIX to drop for Market to go up.
VIX is ranging between EMA50 (Resisted) and EMA200 (supported).
Currently VIX is seems to be at Resistance (EMA50) - GOOD sign.
FiFT are still +ve ( We want VIX FiFT to be RED for Market to go up)
On the other hand, DJ is forming Bullish Piercing pattern (Good Sign) but no Fast Turtle Buy signal yet.
DJ need to break and stay above 23730 for Turtle Buy signal.
FiFT also still -ve indicating Bear still around to control the market.
We need to see :-
1) VIX FiFT turn into -ve (RED)
2) Fast Turtle Sell in VIX
3) Best if ATOM Sell in VIX too..
4) DJ FiFT turn into +ve
5) Fast Turtle Buy in DJ
6) DJ back above EMA50

This is the Most Important Chart in the World The most important chart in the world right now: VIX futures. That golden line at 31.3 must hold to maintain the bearish scenario alive. Notice what is doing the MACD histogram on the daily TF.

VIX Bullish Divergence - Negative Sentiment for Stock MarketVIX double bottom. Fail to drop below 20.
Classic Bullish Divergence (Price Lower Low, FiFT/MACD Higher Low)
Fast Turtle buy with FiFT +ve
Bullish Stochastic
VIX up, Stock down.
FKLI = Potential double top around 1400 level. FiFT still positive and heavy.
Dow Jone TVC:DJI = Gap down. Fast Turtle Sell, Bearish Divergence (Price Higher High, FiFT/Stochastic /MACD higher low)!!!, FiFT turned -ve
S&P500 OANDA:SPX500USD = Bearish Harami Fast Turtle Sell. FiFT turned bearish. Bearish Divergence. Bear is in control
NASDAQ = Bearish Dark Cloud Cover Fast Turtle Sell, Bearish Divergence.
DAX = Dark Cloud cover bearish candle with higher volume. Bearish Divergence, FiFT still +ve but may follow global trend.
XLK (Technology Sector) = Bearish divergence. Shooting star on weekly chart.
I'll be staying out buying stock for now (Not even executing Hit and Run strategy).

Possibly the most important chart right now...Possibly the most important chart right now... especially if you are a bear.
VIX futures still holding.

VIX appear to reverse to BULLISH - Fear is backFTSEMYX:FBMKLCI
Fast Turtle Buy appear for the first time is weeks.
It seems like VIX is bouncing from Fibo .618
ATOM Bearish trend back into neutral zone.
FiFT still -ve but BoD appears..
VIX up => Stock Down
Meaning :- Fear amongst the investors increases. Expect stock market BULL run to pause or may turn BEARISH.

VIX is retesting support at 40. INTRODUCTION
VIX is the ticker symbol for CBOE Volatility Index, a popular measure of the stock market's expectation of volatility based on S&P 500 index options.
It is often referred to as the fear index or fear gauge.
When VIX index moving up, it's indicating fear amongs the investor has increased. The probability of market sell off is high when VIX rally. i.e VIX up, Stock Down.
ANALYIS
VIX is easing since 20 Mar, which led to small rally in stock after sharp drop due to Covid19 pendamic.
Currently VIX is retesting at support around 40 which confluence to key fibo 0.618 and EMA50.
FiFT indicator is still in bearish mode and volume is getting thin.
MACD is also still bearish but seems like turning.
CONCLUSION
VIX is resting at support. Therefore, most stocks should be currently at Resistance zone.
IF VIX bounce up, then chances of Stock Sell-Off is high.
IF VIX able to break below 40, then stock will continue to rally.
Considering all the observations above, probability of VIX bounce up (Stock sell-off) is higher.
Hence, it's best to stay aside for now.
I will publish analysis of the few popular stocks which align to this findings.

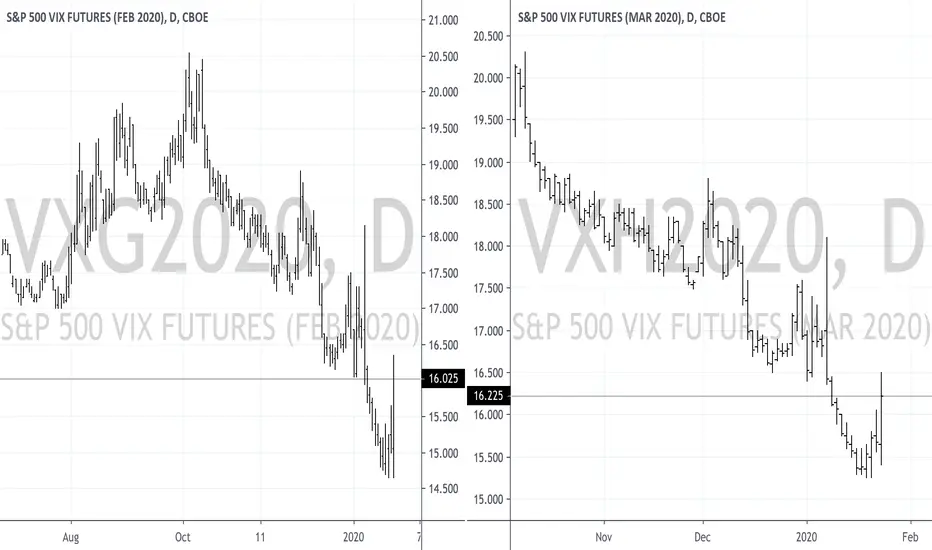
A spread on volatility (VIX)During this time, we are witnessing to a surge in volatility. Spreads on VIX are becoming interesting. I wouldn't consider the first deliveries as we do not yet know when this period of fear on the financial markets will end.
The spread I propose is VXK20-VXM20 (to sell). As we can see from the chart, the spread has turned into an always stronger backwardation (the same did the VIX term structure). The seasonality is (in theory) bearish, but that doesn't mean the spread will drop in the next days/weeks.
We have to wait for the end of this wave of panic, before selling the spread with, as the target, a return in contango.

Vix furtues spreads and stocks above 20day lows.. Vix furtues spreads and stocks above 20day lows.. a good point to mark the end of the market drop by spoting divergence between price index and vix spreads or stocks above 20days lows

SPX - FookinGAMMABro'sREAD:
R azor-Focus-Situational-Awareness
E xtrapolate Out the BullShit
A ssess the Environment We are In
D igress toward Adaptable/Flexible Strategies
Don’t get hooked on hopium…Hope is not a plan. Hope is bullshit…“Get Comfortable being Uncomfortable…Shoot-Move-Communicate! TEAMs via Simpleton-Leadership”

VX Volatility Spread...Interesting!Front End vs Back End Spread...wait for the flip??? HEAD SHOTs ONLY

Volatility Coiling to ExplodeHard to ignore this pattern. VIX futures look poised to explode higher in the coming months.
