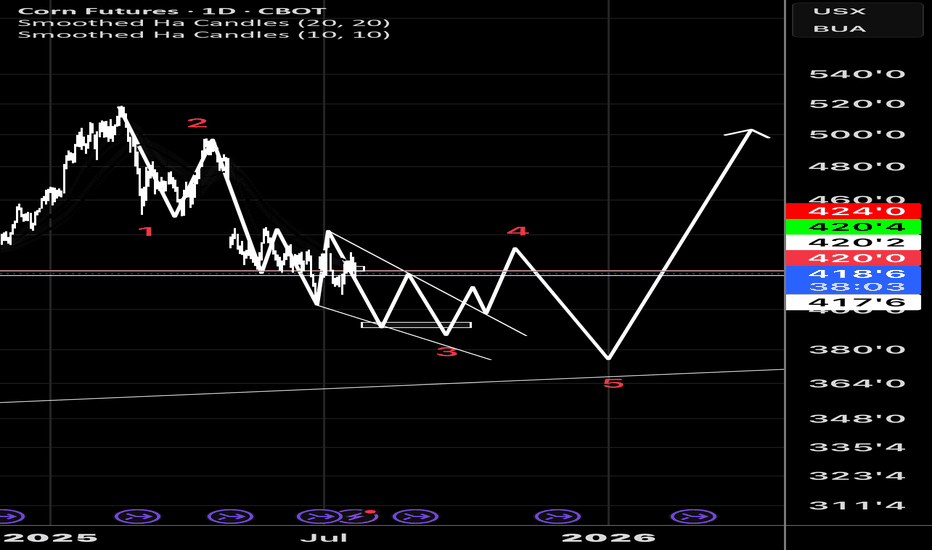
Analysis techniques – Corn Futures (Dec 2025)Date: 30/09/2025 | Timeframe: D1 | Contract Code: ZCZ25
1. Trend Overview and Price Structure
Corn futures (Dec 2025) are consolidating around 4,200 after a short-term pullback. Prices remain above the 4,140 support, keeping the recovery trend intact. However, bullish momentum needs a breakout a
Related commodities
Analysis techniques – Corn Futures (Dec 2025)Analysis techniques – Corn Futures (Dec 2025)
Date: Oct 06, 2025 | Timeframe: D1 | Contract Code: ZCZ25
1. Trend Overview and Price Structure
December corn futures (ZCZ25) traded around 4.194 USD/bu, moving sideways early this week after rebounding from the 4.14 support zone. The short-term struc
Long Corn📌 When is Corn in High Demand & How Does It Cycle Internationally?
Corn demand follows a seasonal and geographical cycle based on harvest seasons, global weather patterns, livestock feed demand, and ethanol production. Smart traders can rotate between corn-producing nations and their related stocks
CORN FUTURES 100 SMA BOUNCECorn futures have just tested the 425' level - an important price point standing on the convergence of the extended algo line formed previously during this year.
The volume of the rally was above average, which might be hinting at the buyers not being ready to show up, at least for now.
A short
Sustained Downtrend in Corn Futures: Bears Maintain Control
The price is trading below the middle Bollinger Band (20-day SMA), which is sloping downward.
Lower highs and lower lows pattern confirms the bearish market structure.
Price hugging the lower band or staying in the lower half of the band zone — a classic sign of weakness.
Price repeatedly fails
CORN; Heikin Ashi Trade Idea📈 Hey Traders!
Here’s a fresh outlook from my trading desk. If you’ve been following me for a while, you already know my approach:
🧩 I trade Supply & Demand zones using Heikin Ashi chart on the 4H timeframe.
🧠 I keep it mechanical and clean — no messy charts, no guessing games.
❌ No trendlines, no
Corn Futures (ZCU2025) – Heavy Structure, Heavy Pressure📉 Corn Futures (ZCU2025) – Heavy Structure, Heavy Pressure
WaverVanir DSS shows continued downside probability in Corn as price compresses below the 0.786–1.272 fib zone and forms a supply rejection cluster near 4.10–4.27.
🧠 Macro Snapshot:
🌽 USDA WASDE (Aug 12) may revise yield upward amid favora
See all ideas
Summarizing what the indicators are suggesting.
Neutral
SellBuy
Strong sellStrong buy
Strong sellSellNeutralBuyStrong buy
Neutral
SellBuy
Strong sellStrong buy
Strong sellSellNeutralBuyStrong buy
Neutral
SellBuy
Strong sellStrong buy
Strong sellSellNeutralBuyStrong buy
A representation of what an asset is worth today and what the market thinks it will be worth in the future.
Displays a symbol's price movements over previous years to identify recurring trends.
Frequently Asked Questions
The current price of Corn Futures is 419'0 USX / BUA — it has risen 0.18% in the past 24 hours. Watch Corn Futures price in more detail on the chart.
The volume of Corn Futures is 8.54 K. Track more important stats on the Corn Futures chart.
Open interest is the number of contracts held by traders in active positions — they're not closed or expired. For Corn Futures this number is 798.02 K. You can use it to track a prevailing market trend and adjust your own strategy: declining open interest for Corn Futures shows that traders are closing their positions, which means a weakening trend.
Buying or selling futures contracts depends on many factors: season, underlying commodity, your own trading strategy. So mostly it's up to you, but if you look for some certain calculations to take into account, you can study technical analysis for Corn Futures. Today its technical rating is neutral, but remember that market conditions change all the time, so it's always crucial to do your own research. See more of Corn Futures technicals for a more comprehensive analysis.


