US Stock Indexes Broke New RecordsCBOT: Micro E-Mini Dow Jones Futures ( CBOT_MINI:MYM1! )
After a 9-day delay due to the U.S. government shutdown, the Bureau of Labor Statistics (BLS) released the September CPI data on October 24th. Here are the highlights:
• The Consumer Price Index for All Urban Consumers (CPI-U) increased 0.3% on a seasonally adjusted basis in September, after rising 0.4% in August.
• On an annual basis, the headline inflation rose 3.0% before seasonal adjustment.
• The CPI index for all items less food and energy, commonly known as the Core CPI, rose 0.2% in September, after rising 0.3% in each of the 2 preceding months.
As cooling inflation data spurred investor optimism, U.S. stocks reached new heights again on Friday. The market expects the Federal Reserve to stay on its rate-cutting path, boosting the U.S. economy and justifying higher stock valuations.
The Dow Jones Industrial Average rose 472.51 points, or 1.01%, to 47,207.12, securing its first close above the 47,000 level. The S&P 500 added 0.79% to 6,791.69, while the Nasdaq Composite climbed 1.15% to 23,204.87. All three closed at records.
Following the CPI data, traders increased their stakes that the Fed will cut rates in October and December. Odds for a December cut jumped to 98.5% from roughly 91% before the data, per the CME FedWatch tool. Odds for a cut next week remained above 95%.
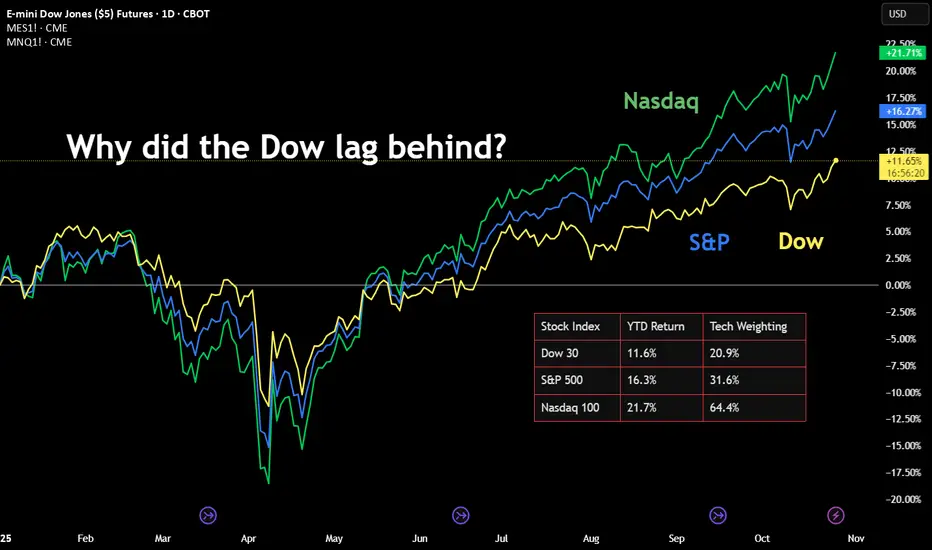
The Case of Dow over S&P and Nasdaq
As of Friday, the Dow gained 10.55% year-to-date, while the S&P rose 15.01% and the Nasdaq was 20.18% higher in 2025.
Why did the Dow lag behind the S&P and the Nasdaq? A simple answer is due to its lower index weight on technology. Since the current bull market is primarily driven by A.I., the Dow benefited less comparing to the other two stock indexes.
The Dow has six component companies in the technology sector. Their combined weight comes to 20.91% of the 30-stock index as of today.
• Microsoft (MSFT), 6.82%
• IBM (IBM), 4.00%
• Apple (AAPL), 3.42%
• Salesforce (CRM), 3.32%
• Nvidia (NVDA), 2.43%
• Cisco (CSCO), 0.92%
For a comparison, the S&P 500 has a weighing of 31.6% on Information Technology, while the Nasdaq-100 has a weighing between 62.48% - 64.45% for Technology.
In my opinion, the stock market has already beaten up so much on the A.I. hype, and it is late in the bull market cycle. The Nasdaq-100 has a lofty valuation with a Price/Earnings ratio of 33.25 (trailing 12-month), according to Birinyi Associates. Meanwhile, the Dow has a more reasonable P/E ratio of 24.90.
I am bullish on U.S. stocks long term. However, I share the growing concerns about potential collusion among AI companies. Types of AI collusion under investigation:
• Partnerships and investments: Tech giants invest billions into AI startups. Are these deals designed to control the AI ecosystem and suppress competition?
• Algorithmic price-fixing: Companies may use AI-powered pricing algorithms to inflate prices. Antitrust agencies are actively scrutinizing potential collusive outcomes.
• AI companies may use shared platforms or common algorithms to align market strategies, potentially forming a tacit "hub-and-spoke" conspiracy.
• Companies initially release AI models as "open source" to gain market share, accumulate data, and establish an ecosystem, only to later close off access.
• Dominant tech firms with control over cloud computing infrastructure, proprietary data, and massive financial resources could entrench their positions in the AI market.
To summarize, the Dow is a safer bull-market strategy given its more reasonable valuation. Investors are wise to stay clear off the potential crush on the A.I. hype.
Trading with Micro E-Mini Dow Jones Futures
If a trader shares a bullish view on the Dow, he may consider using stock index futures to enhance investment returns.
Micro E-Mini Dow Jones futures (MYM) offer smaller-sized versions of CME Group’s benchmark Dow Jones futures (YM) contracts. Micro futures have a contract size of 0.5 times the DJIA index, which is 1/10th of the standard contract.
CME data shows that the E-Mini and Micro Dow Jones futures have a combined open interest of 105,674 contracts as of Friday. Due to the government shutdown, the CFTC Commitment of Traders report has not been updated since September 23rd. We are currently in the dark about the “Smart Money” positions in the Dow.
Buying or selling one MYM contract requires an initial margin of $1,371. With Friday settlement price of 47,396, each December contract (MYMZ5) has a notional value of $23,857. Compared with investing in stocks, the futures contracts offer a built-in leverage of about 17 times (=23857/1371).
Hypothetically, if Dow futures price moves up 5% to 49,766 by December, the index gain of 2,370 points will translate into $1,185 for a long position, given each index point equal to $0.50 for the Micro contract. Using the initial margin of $1,371 as a cost base, the trade would produce a theoretical return of 86.4% (=1185/1371).
Futures contracts have expiration days, and you may not hold them forever like stocks. To stay long in the DJIA, a trader may consider a futures rollover strategy. An illustration:
• A trader buys the lead contract December now, and holds it till the end of November
• He will then sell December and buy March, which will become the next lead contract
• He will repeat this process: buy June 2025 and sell March 2026 in February 2026
• Repeat this again to buy September 2026 and sell June 2026 in August 2026
This series of trades allows a trader to establish a long position in the DJIA throughout the year, while holding the most liquid contracts.
There is no guarantee that each trade will yield positive returns. But if the Dow is trending up over time, the position would likely pay off.
The leverage feature in futures works both ways. It would magnify the losses as well as improving the winnings. The good news is, a trader could put stop-loss on his futures trades, limiting the downside risks.
For example, our trader may set stop-loss at 45,000 when he buys the MYM at 47,396. If the Dow falls to 40,000, his position will be liquidated well before that when the price hits 45,000. The maximum loss incurred will be $1,198 (= (47396 - 45000) * 0.5), which is less than the initial margin of $1,371.
The combination of Futures Rollover with Stop-loss could yield higher returns (thanks to the leverage) while maintaining a limited loss exposure. If the index bounces up and down but trends up in the long stretch, the trader will see both wins and losses. Since the wins are unbounded but the losses are contained, the overall returns would likely be positive.
Happy Trading.
Disclaimers
*Trade ideas cited above are for illustration only, as an integral part of a case study to demonstrate the fundamental concepts in risk management under the market scenarios being discussed. They shall not be construed as investment recommendations or advice. Nor are they used to promote any specific products, or services.
CME Real-time Market Data help identify trading set-ups and express my market views. If you have futures in your trading portfolio, you can check out on CME Group data plans available that suit your trading needs www.tradingview.com
Trade ideas
Long over 47,247 RBI playLimit order at 247 for the red bar ignore play using the rising 20sma as the direction. I will keep lowering my limit order down using the black bar's bodies until the body gets eliminated.
I am using a fixed 125 tick stop and a fixed 250 tick target.

Long Trade Limit Order 47,859 Stop 47,709 Target 48,259I am placing an order for OCO at 47,859.
Stop loss 150 ticks at 47,709
Target 400 ticks at 48,259
Thesis is pullback to the 50% mark and targeting the 0.5 range expansion

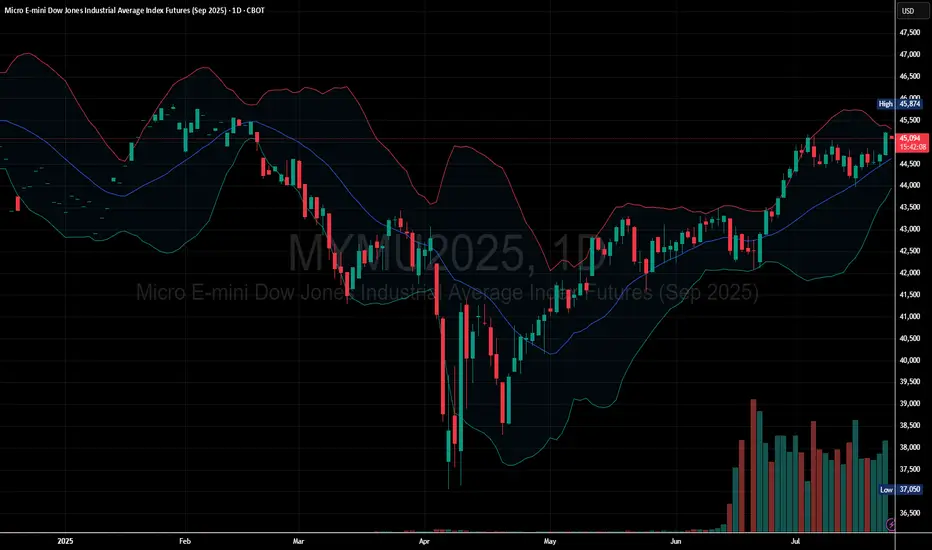
Buyers Dominate as Dow Micro Futures Push Higher
Price Above Moving Average: The current price is trading above the midline of the Bollinger Bands, showing bullish momentum.
Bands Expanding Upward: The Bollinger Bands are sloping upward, indicating increasing volatility in the direction of the trend.
Price near Upper Band: Price is near or hugging the upper band, which often signals strong bullish continuation.
Immediate Support: Around the middle Bollinger Band (~44,500 zone).
Next Resistance: Near recent highs around 45,100 – 45,200 area. If broken, this could trigger a breakout continuation.
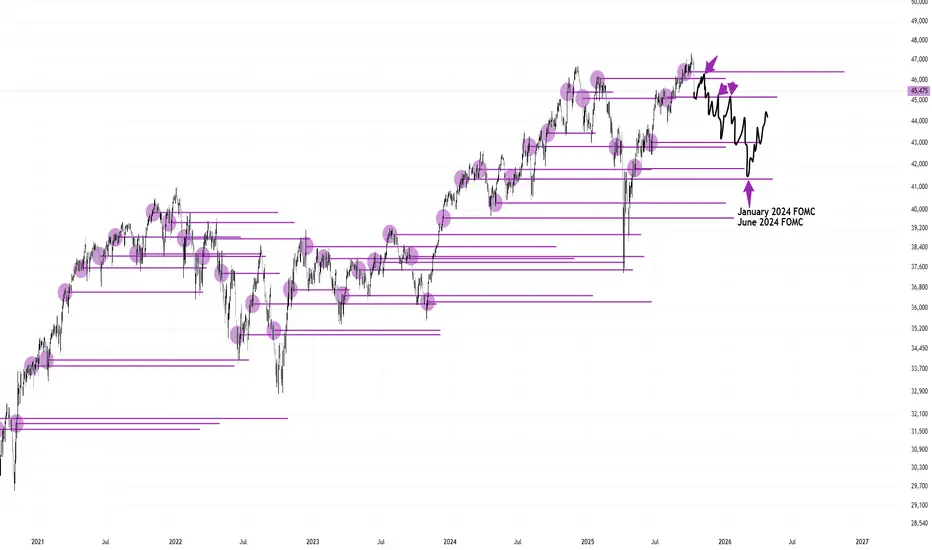
FOMC Higher High Bull Trend Still In Progress Return to 43k SoonAnalyzing the long-term view of Dow Jones using my FOMC levels I have come to a conclusion that the bull move higher that started in April, is still in progress. I will explain my reasonings below why I am expecting a return to 43,000 as the next Major low.
I firmly believe that the June FOMC of 2025 will be defended and that price will not penetrate. Major lows are formed by price selling into an FOMC level and reversing on a hair.
I am still figuring out why the market chooses which FOMC level to defend and to tap into it by a penny and which ones it doesn't. Work in progress on this.
Since April, we have 5 FOMC releases that are in a higher high, higher low, straight line.
In summary, this is what I am expecting. Price to slam down into June FOMC and stop on a penny, taking out that swing low suspended above it. Price to form a major bottom low in this bull trend and continue up to the 50k's to 60k's

Live Day Trading Losing $1097Failed breakout to the upside.
Revenge traded by reentering several times.
Could of avoided if I quickly set my stop-loss at breakeven.
CBOT_MINI:YM1!

Live Trading - Breakeven pt.2Was aiming for a gap fill.
Sold at breakeven, and protected capital.
CBOT_MINI:YM1!

Live Trading pt.1Part 1 of a trade I am currently in right now.
Down around $300.
Aiming for a gap fill.

YM week 44T.A explained -
BS & FS levels are expected support when dashed lines, tested when dotted and resistance when solid lines.
The inverse is true for the Inv. BS Inv. FS levels, they are resistance as dashed lines, tested as dotted and support as solid lines.
Monthly timeframe is color pink
weekly grey
daily is red
4hr is orange
1hr is yellow
15min is blue
5min is green if they are shown.
strength favors the higher timeframe.
2x dotted levels are origin levels where trends have or will originate. When trends break, price will target the origin of the trend. its math, when the trend breaks, the vertex breaks too so the higher timeframe level/trend that breaks, the more volatility there could be as strength in the orders flow in to fuel the move.
Analyzing the Upcoming Trading Week, FOMC Interest Rate DecisionCBOT_MINI:YM1!
FOMC interest rate decision on Wednesday.
Trading plan for tomorrow.
Emphasis on moving stop to breakeven on future trades.
Predictions post-fed.

Live YM Trade - Opening Range BreakoutCBOT_MINI:YM1!
Opening range breakout trade
Set stop orders on both ends for entry
Around a 100 point profit

Mini Dow Jones retracing to a supply zoneHello traders,
I've spotted a very strong supply zone on this chart, and we're currently approaching it from below. Despite this, there's still solid bullish momentum holding above the 46820 price level, with price action re-entering the range and hinting at potential upside continuation. I'm entering long here, optimistic about a bounce or breakout.
Key levels to watch:
Entry: 46800
Stop Loss: 60 ticks
Take Profit: below supply zone
Let's see how this plays out—I'll share updates as it develops. What do you think of this setup?
I'm not a financial advisor. Trade responsibly!

Recap of MYM Intraday Short & Strategy Moving ForwardReviewed my CBOT_MINI:MYM1! trade.
Used stop-order strategy.
Only risking 10% max.

I'm down $270 on my short trade on YMI'm down on my YM trade, and I removed my stop-loss because I still have some conviction left.
I might take the loss, and reenter once this upward trend wears out.

YM Updated levels for week 43
BS & FS levels are expected support when dashed lines, tested when dotted and resistance when solid lines.
The inverse is true for the Inv. BS Inv. FS levels, they are resistance as dashed lines, tested as dotted and support as solid lines.
Monthly timeframe is color pink
weekly grey
daily is red
4hr is orange
1hr is yellow
15min is blue
5min is green if they are shown.
strength favors the higher timeframe.
2x dotted levels are origin levels where trends have or will originate. When trends break, price will target the origin of the trend. its math, when the trend breaks, the vertex breaks too so the higher timeframe level/trend that breaks, the more volatility there could be as strength in the orders flow in to fuel the move.


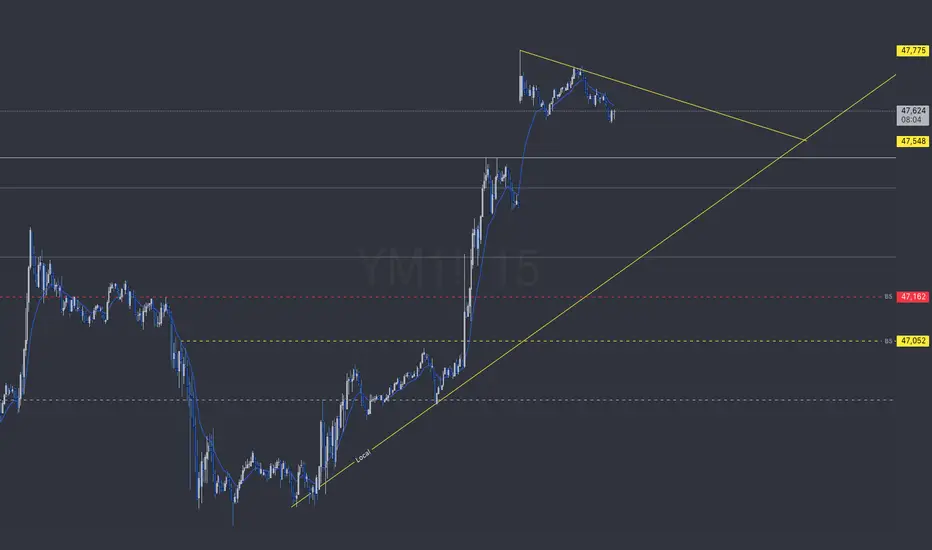
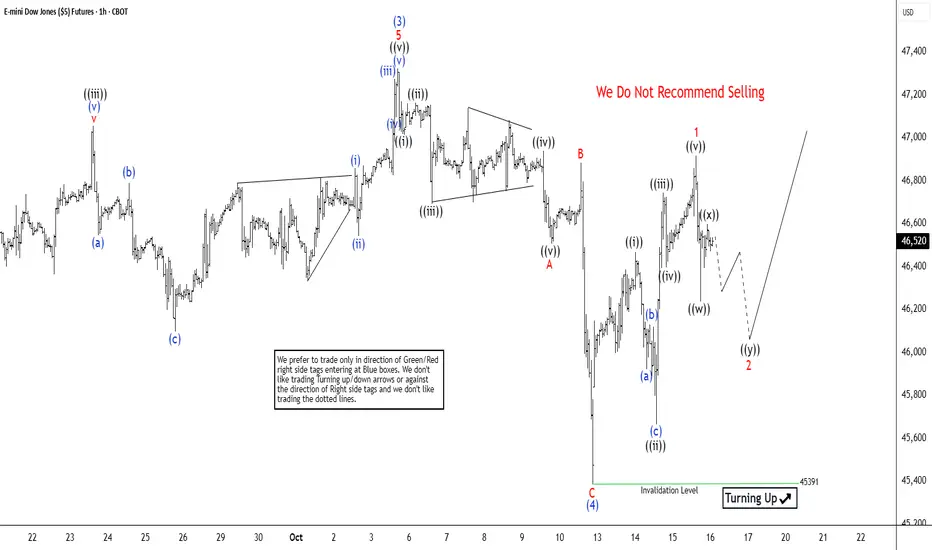
Dow Futures (YM) Eyeing Last Upside Push in Wave 5The short-term Elliott Wave outlook for Dow Futures (YM) indicates that the cycle from the April 2025 low continues as a five-wave impulse. As shown in the 1-hour chart, wave (3) of this impulse peaked at 47,323. The subsequent wave (4) pullback unfolded as a zigzag Elliott Wave structure. From wave (3), wave ((i)) declined to 47,014, followed by a wave ((ii)) rally to 47,162. Wave ((iii)) dropped to 46,693, wave ((iv)) rose to 46,938, and wave ((v)) concluded at 46,507, completing wave A. Wave B bounced to 46,883, and wave C extended lower to 45,391, finalizing wave (4) in the higher degree.
The Index has now turned higher in wave (5), but it must break above wave (3) at 47,323 to rule out a double correction. From wave (4), wave ((i)) reached 46,467, with wave ((ii)) pulling back to 45,663. Wave ((iii)) advanced to 46,743, wave ((iv)) dipped to 46,395, and wave ((v)) completed at 46,915, concluding wave 1. A wave 2 pullback is currently underway, correcting the cycle from the October 11 low before resuming higher. As long as the pivot low at 45,391 holds, expect the pullback to find support in a 3, 7, or 11-swing sequence, setting the stage for further upside.
Dow Jones - Looking To Sell Pullbacks In The Short TermH4 - Strong bearish move.
Uptrend line breakout.
No opposite signs.
Currently it looks like a pullback is happening.
Expecting bearish continuation after pullback until the strong resistance zone holds.
If you enjoy this idea, don’t forget to LIKE 👍, FOLLOW ✅, SHARE 🙌, and COMMENT ✍! Drop your thoughts and charts below to keep the discussion going. Your support helps keep this content free and reach more people! 🚀

YM 10/13I went a little overkill with the levels.
Black = last year and this year so far high, low, and median ranges
pink = monthly high, low, and median ranges
grey = weekly levels
red = daily
orange = 4hr
yellow = 1hr
blue = 15min levels
Inv. levels are resistance
BS / FS levels are support with different static expectations: BackSide levels should have a strong reaction to price while FrontSide levels should support price until accumulation candles can start engulfing to cause a reversal trend.
if, those expecations dont happen within 3-5 mins on a lower timeframe, they aren't happening on a higher timeframe without risk so exit and find a different range, untested level to target or wait until the correct candles begin forming after the level tests to re-enter.
These 4 candles (2 in the accumulation ranges, 2 in the distribution ranges) create 6 levels that paint a story. I don't mark the swingHigh or SwingLow's and favor the FS and inv.FS levels which reduce risk.

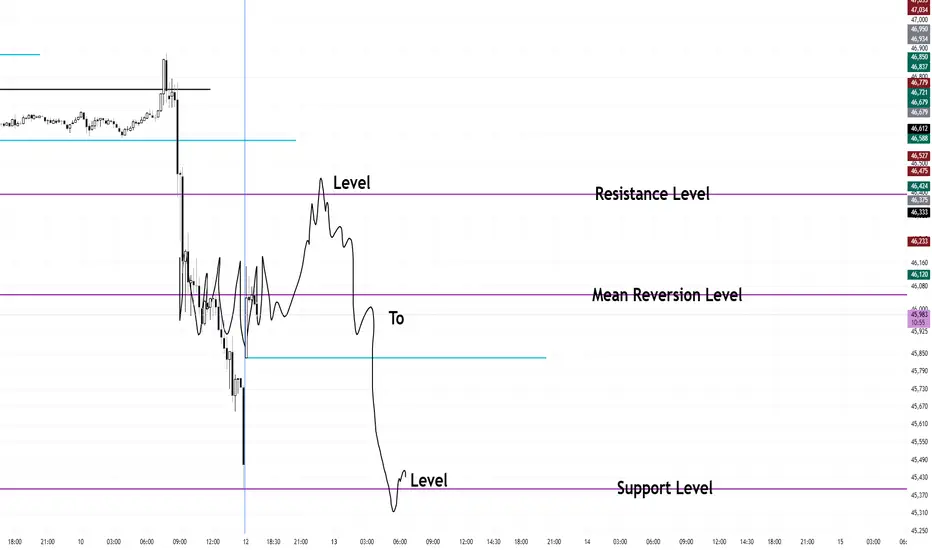
FOMC Level to Level Resistance TradeI am looking at the January 2025 FOMC level as mean reversion where price will oscillate between. I am looking at the September 2025 level as resistance where it should fail at today and sell off back down to the November 2024 FOMC level.
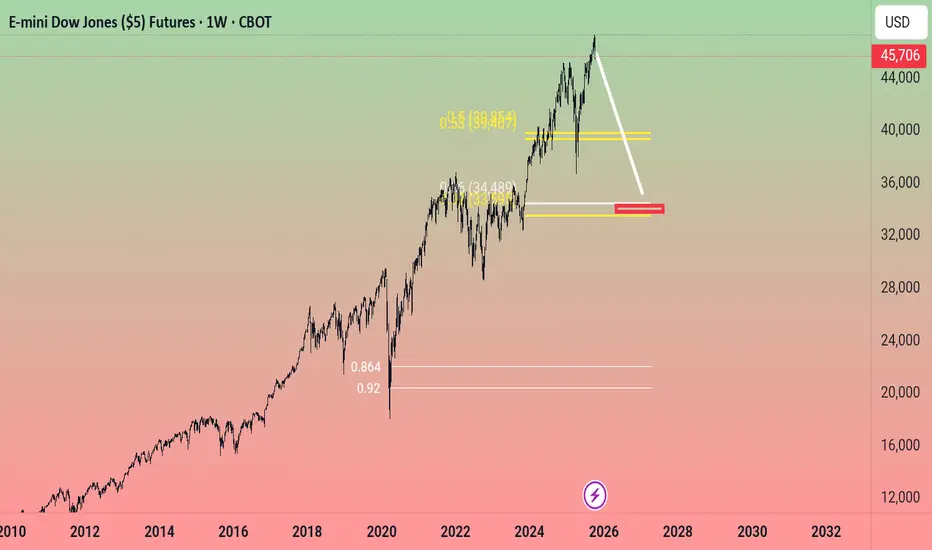
June FOMC Pullback to 43,000Using my FOMC levels, I am expecting a pullback back down to 43,000 to mitigate some orders and to find support. What am I basing this on? I am basing this on the huge gap between prices from June FOMC and July FOMC.
Below is the 8-hour chart showing my thought process
Here are examples of this price gap return
My long-term thesis is to use the top FOMC releases as resistance and when price does breakout into the 50k's, will turn them into major support
Dow jones started short movementIf some one ask me about next Target of YM , I can tell only one thing , the cycle was ended and dow jones started correction phase... I
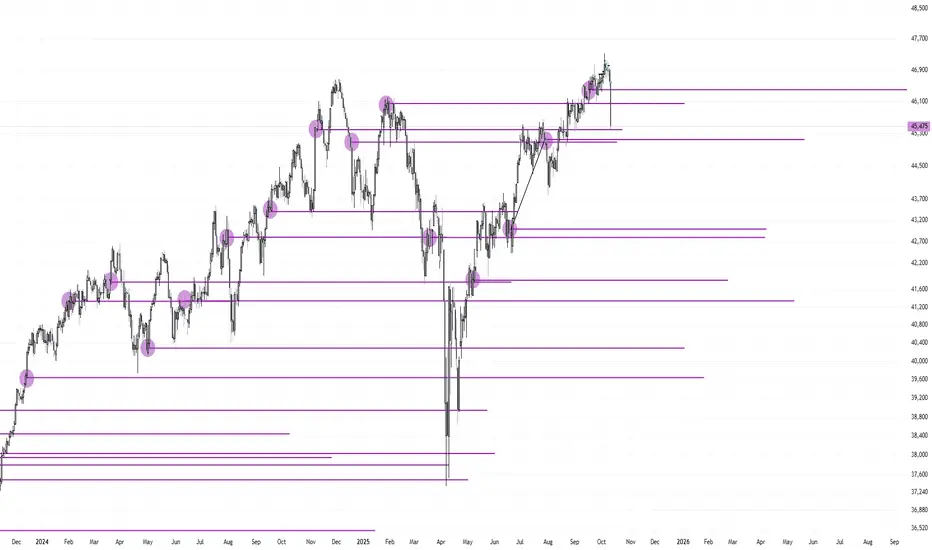
FOMC Support and Resistance Levels To Watch For 2025Below are my FOMC levels I have mapped out. Prices move SOLELY from FOMC releases.
This is a concept I first discovered last year and since then, have still been perfecting it.
I want to see the July FOMC hold as a short term support level before rallying into the September FOMC as resistance for the pullback dump.
Ultimately, I am looking for January 2024 FOMC to hold as the next major long term bottom before breaking out into the 48,000-50,000s
Below I will post screenshots of how FOMC levels are used as I am not good explaining. Take the time to study these charts and see for yourself that Dow Jones makes it's price action based on the releases of FOMC.
Protected Levels:
Levels that do not get touched and are defended.
Resistance Levels:
Support Levels:
And of course, the biggest support level used with the April dump right into May 2023 FOMC
Mean Reversion Levels:
These levels even work intra day. Take a look below to see how well these are respected.