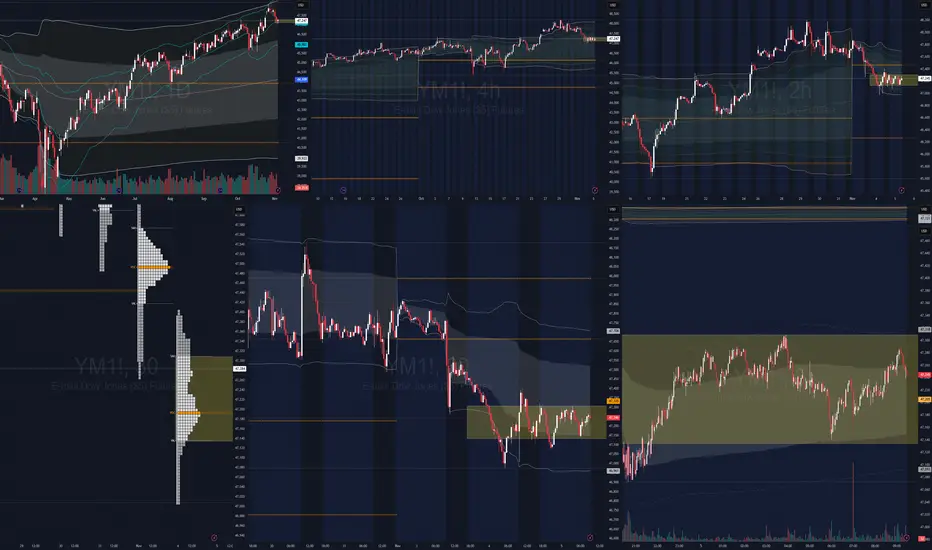
YM (DJI Futures) UpdateI haven't posted YM in a while, but it's been moving a lot lately.
I think MFI needs to get oversold then it goes for the bull flag target. With fewer stocks to pump, the algos have a much easier time pumping the Dow, like earlier this week.
Not sure if RSI will hit oversold. Quite frankly, I should have shorter DIA yesterday because it was so overbought. Oh well.
Trade ideas
Dow Futures (YM) Breaks Record : Five Waves Elliott Wave ImpulseDow Futures (YM) has surged to a new all-time high, reinforcing the prevailing bullish trend. The cycle from the April 2025 low remains active and is unfolding as a five-wave impulsive structure. Within this sequence, wave (3) concluded at 48,214. The subsequent decline in wave (4) developed as a zigzag Elliott Wave formation. From the peak of wave (3), wave ((i)) terminated at 47,616, followed by a corrective rally in wave ((ii)) that reached 48,180. The index then declined in wave ((iii)) to 47,488, before wave ((iv)) produced a modest rebound to 47,869. The final leg, wave ((v)), completed at 46,976, marking the end of wave A. A corrective bounce in wave B subsequently peaked at 47,583.
The index then resumed its downward correction in wave C. From wave B, wave ((i)) ended at 47,308, and wave ((ii)) retraced to 47,495. A deeper decline in wave ((iii)) reached 46,894, followed by a brief recovery in wave ((iv)) to 47,207. The final leg, wave ((v)), concluded at 46,575, completing wave C of (4). A bullish reversal has since occurred, with the index breaking to new highs in wave (5). From wave (4), wave ((i)) ended at 47,345, and wave ((ii)) pulled back to 47,031. Wave ((iii)) extended higher to 48,528, followed by a minor retracement in wave ((iv)) to 48,368. One final push higher is expected to complete wave ((v)) of 1.
Subsequently, a corrective wave 2 should unfold to retrace the cycle from the 8 November low. Provided the pivot at 46,575 remains intact, dips are anticipated to find support in the 3-, 7-, or 11-swing sequence, paving the way for further upside.

$YM | Premarket Prep and Analysis | Higher Timeframe LISWalks through plans today for YM traders. Primary focus on shorts, but our clear line in the sand allows us to be flexible based on interaction with our levels.

dow futureswait for liquidity area to be swept then go long to target area. trade is void if target area hit before it has swept liquidity.

YM1/ US30 Daily Trade SetupsIn this update we review the recent price action in the E-mini Dow Jones futures contract and identify the next high-probability trading opportunities and price objectives to target. To review today's video analysis, click here!

DOW JONES INDEX GOES 'FIGHT' vs 50-DAY BATTLE LINE AVERAGEThe Dow Jones Industrial Average (DJIA), commonly known as the Dow Jones index, is a stock market index that tracks 30 of the largest and most established U.S. companies.
It serves as a barometer for overall market and economic health, reflecting investor sentiment and trends in blue-chip stocks. From a technical analysis perspective, the Dow Jones is studied to identify price trends, support and resistance levels, and potential reversal points to guide trading and investment decisions.
One key technical indicator used in analyzing the Dow Jones index is the 50-day Simple Moving Average (SMA). The 50-day SMA calculates the average closing price of the index over the past 50 trading days, smoothing out short-term price fluctuations to highlight the intermediate-term trend. Traders and investors widely monitor the 50-day SMA because it balances responsiveness to recent price changes with reduced noise compared to shorter-term averages.
When the Dow Jones index price is above the 50-day SMA, it generally indicates an upward or bullish trend with potential support around the SMA level. Conversely, if the price falls below the 50-day SMA, it may signal a weakening trend or bearish sentiment. The 50-day SMA can also act as a dynamic support or resistance level where price reactions may occur due to the collective attention of market participants at this average.
Currently, the Dow Jones trades slightly below its 50-day SMA, which stands at approximately 46,840 points for Dow Jones Futures CBOT_MINI:YM1! .
This technical setup suggests caution as the index might face resistance near this average before a possible trend confirmation or reversal. The 50-day SMA is often used in conjunction with other indicators like the 200-day SMA to generate signals, such as the "Golden Cross" or "Death Cross," which signal major trend shifts.
In summary, the Dow Jones index technical perspective focuses on using the 50-day SMA as an intermediate trend indicator and key level of market interest, helping traders gauge momentum and potential price direction over the medium term.
--
Best wishes,
@PandorraResearch Team

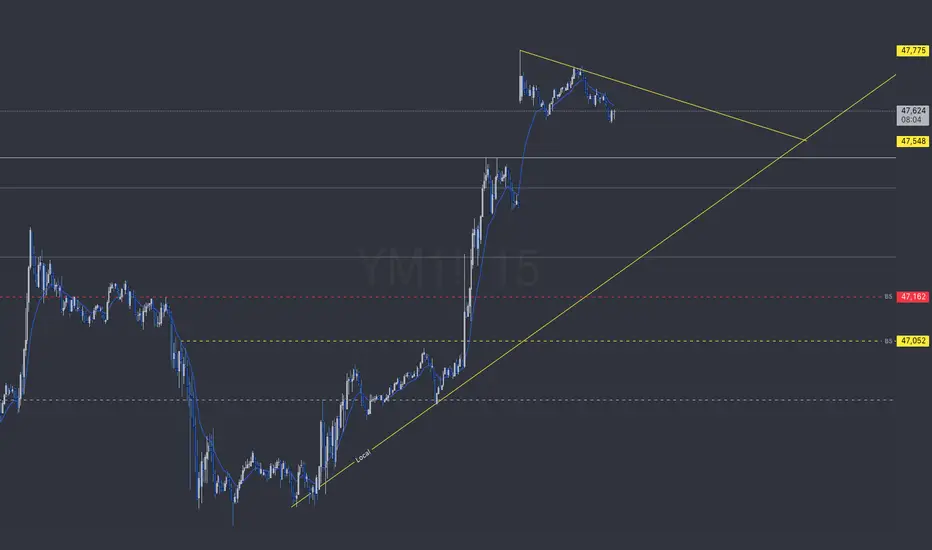
YM - 11/18 (15min chart)Added a Daily box in red, an Hourly SwingLow level in yellow and a 15min Inverse FS hold level in blue as resistance and a 15min accumulation trend in blue.
15min accumulation trend building off the 4hr trend in orange plus its backed by a yearly level in black.
Price broke the 4hr accumulation trend on a lower timeframe though so it's just a matter of time until it breaks so price can test lower levels. Unless, price can convince us long pants are trending again, sentiment is shorts all day.
T.A explained -
BackSide (BS)
FrontSide (FS)
Inverse BS (Inv.BS)
Inverse FS (Inv.FS)
BS & FS levels are expected support when dashed lines, tested when dotted and resistance when solid lines.
The inverse is true for the Inv. BS Inv. FS levels, they are resistance as dashed lines, tested as dotted and support as solid lines.
Monthly timeframe is color pink
weekly grey
daily is red
4hr is orange
1hr is yellow
15min is blue
5min is green if they are shown.
strength favors the higher timeframe.
2x dotted levels are origin levels where trends have or will originate. When trends break, price will target the origin of the trend. its math, when the trend breaks, the vertex breaks too so the higher timeframe level/trend that breaks, the more volatility there could be as strength in the orders flow in to fuel the move.

Ym/us30 buyI am looking at buying from @ 46200 demand level and I expect price to rally to 47214 in the next few days. Sl at 45138.
I usually do my analysis on futures market and place my trades on cfd.
Us30 cfd buy
Entry : 46173.97
Sl 45111.97
Tp 47187.97

YM Week 47T.A explained -
BackSide (BS)
FrontSide (FS)
Inverse BS (Inv.BS)
Inverse FS (Inv.FS)
BS & FS levels are expected support when dashed lines, tested when dotted and resistance when solid lines.
The inverse is true for the Inv. BS Inv. FS levels, they are resistance as dashed lines, tested as dotted and support as solid lines.
Monthly timeframe is color pink
weekly grey
daily is red
4hr is orange
1hr is yellow
15min is blue
5min is green if they are shown.
strength favors the higher timeframe.
2x dotted levels are origin levels where trends have or will originate. When trends break, price will target the origin of the trend. its math, when the trend breaks, the vertex breaks too so the higher timeframe level/trend that breaks, the more volatility there could be as strength in the orders flow in to fuel the move.

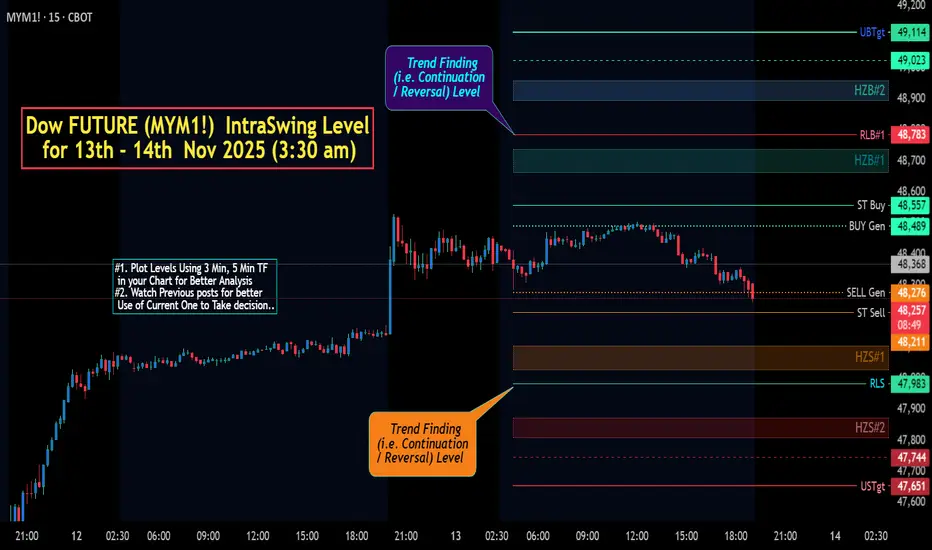
Dow FUTURE (MYM1!) IntraSwing Level for 13th - 14th Nov 2025Dow FUTURE (MYM1!) IntraSwing Level for 13th - 14th Nov 2025 (3:30 am)
Observed Short Range Directionless Trading.
Think Waiting for BIG NEWS.
Level description:
L#1: If the candle crossed & stays above the “Buy Gen”, it is treated / considered as Bullish bias.
L#2: Possibility / Probability of REVERSAL near RLB#1 & UBTgt
L#3: If the candle stays above “Sell Gen” but below “Buy Gen”, it is treated / considered as Sidewise. Aggressive Traders can take Long position near “Sell Gen” either retesting or crossed from Below & vice-versa i.e. can take Short position near “Buy Gen” either retesting or crossed downward from Above.
L#4: If the candle crossed & stays below the “Sell Gen”, it is treated / considered a Bearish bias.
L#5: Possibility / Probability of REVERSAL near RLS#1 & USTgt
HZB (Buy side) & HZS (Sell side) => Hurdle Zone,
*** Specialty of “HZB#1, HZB#2 HZS#1 & HZS#2” is Sidewise (behaviour in Nature)
Rest Plotted and Mentioned on Chart
Color code Used:
Green =. Positive bias.
Red =. Negative bias.
RED in Between Green means Trend Finder / Momentum Change
/ CYCLE Change and Vice Versa.
Notice One thing: HOW LEVELS are Working.
Use any Momentum Indicator / Oscillator or as you "USED to" to Take entry.
⚠️ DISCLAIMER:
The information, views, and ideas shared here are purely for educational and informational purposes only. They are not intended as investment advice or a recommendation to buy, sell, or hold any financial instruments. I am not a SEBI-registered financial adviser.
Trading and investing in the stock market involves risk, and you should do your own research and analysis. You are solely responsible for any decisions made based on this research.
"As HARD EARNED MONEY IS YOUR's, So DECISION SHOULD HAVE TO BE YOUR's".
Do comment if Helpful .
In depth Analysis will be added later (If time Permits)
$YM | "Resistance" Zone, or low key breakout area? Let's analyzeToday, we discuss some nuance, so put on your analyst hats and let's dive in!

$YM | Dow Futures Analysis | Long Scenario / IdeaAnalysis of today. We're currently in the dead center of two fairly strong levels with some bullish news premarket. Look to 'buy' at our green zone, and target the pink.

$YM | Mean reversion scalper's delightHeading into the open, we're still inside TPO prior value (see yellow area). Scalpers may be able to fade (short) from the top of VAH - particularly after a stop run of prior swing high.
If you're bullish, either wait for a breakout of the yellow area and pullback or wait to fade from the lower part of the yellow rectangle.
Higher timeframe bias unclear, so for scalpers, may be a good opportunity to just play inside this value area and take profits after 1-2 measured moves.
-StoicTraderCoach
YM (Dow), Short idea (30-minute+3-minute TF)See the bottom two charts for the red bear zone I have for today. While it's entirely possible (due to TFs above 30 minutes) for the market travel up past this bear zone, it's a great risk/reward opportunity to take a shot short this morning.
Look for an interaction with the red zone, and momentum shift based on your rules for entry.
Happy trading!
-StoicTrader

Dow Jones Intra-day IdeaDJ after fridays consolidation and sweeping liquidity of Current Week and mittigating 4H demand. Doing "V" shape reaction and creating 15min Demand that makes our POI for this Intra-day idea.
My stoploss will be under 15min Demand and TP1+BE point will be at 1:2RR.
T2 will be on 15min supply (Only if price will not mittigate this zone before entering the trade.
Our final TP will be on Thursdays VAH That almost perfectly corespondates with 30min Supply.
Disclaimer: This is not a trading or financial advice

Long Trade Limit Order 47,859 Stop 47,709 Target 48,259I am placing an order for OCO at 47,859.
Stop loss 150 ticks at 47,709
Target 400 ticks at 48,259
Thesis is pullback to the 50% mark and targeting the 0.5 range expansion

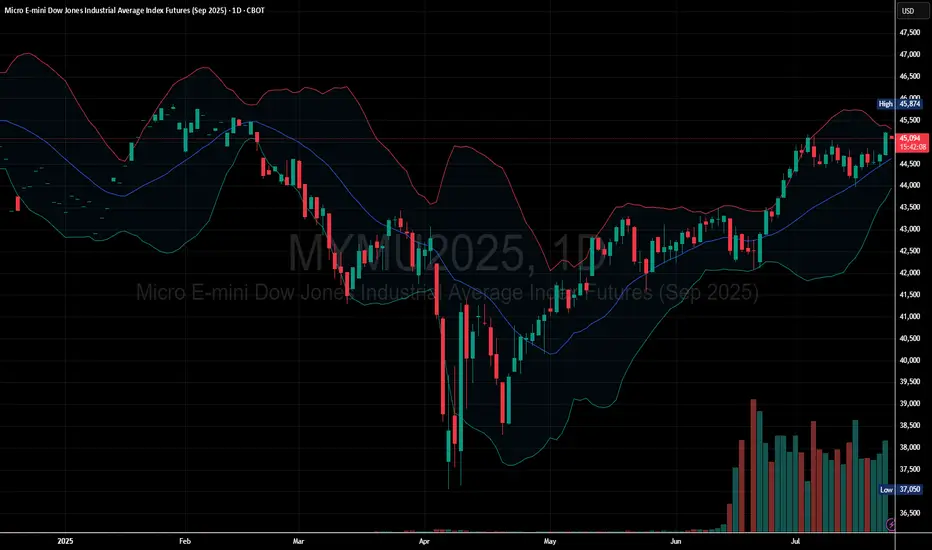
Buyers Dominate as Dow Micro Futures Push Higher
Price Above Moving Average: The current price is trading above the midline of the Bollinger Bands, showing bullish momentum.
Bands Expanding Upward: The Bollinger Bands are sloping upward, indicating increasing volatility in the direction of the trend.
Price near Upper Band: Price is near or hugging the upper band, which often signals strong bullish continuation.
Immediate Support: Around the middle Bollinger Band (~44,500 zone).
Next Resistance: Near recent highs around 45,100 – 45,200 area. If broken, this could trigger a breakout continuation.
FOMC Higher High Bull Trend Still In Progress Return to 43k SoonAnalyzing the long-term view of Dow Jones using my FOMC levels I have come to a conclusion that the bull move higher that started in April, is still in progress. I will explain my reasonings below why I am expecting a return to 43,000 as the next Major low.
I firmly believe that the June FOMC of 2025 will be defended and that price will not penetrate. Major lows are formed by price selling into an FOMC level and reversing on a hair.
I am still figuring out why the market chooses which FOMC level to defend and to tap into it by a penny and which ones it doesn't. Work in progress on this.
Since April, we have 5 FOMC releases that are in a higher high, higher low, straight line.
In summary, this is what I am expecting. Price to slam down into June FOMC and stop on a penny, taking out that swing low suspended above it. Price to form a major bottom low in this bull trend and continue up to the 50k's to 60k's

Live Day Trading Losing $1097Failed breakout to the upside.
Revenge traded by reentering several times.
Could of avoided if I quickly set my stop-loss at breakeven.
CBOT_MINI:YM1!

Live Trading - Breakeven pt.2Was aiming for a gap fill.
Sold at breakeven, and protected capital.
CBOT_MINI:YM1!

Live Trading pt.1Part 1 of a trade I am currently in right now.
Down around $300.
Aiming for a gap fill.

YM week 44T.A explained -
BS & FS levels are expected support when dashed lines, tested when dotted and resistance when solid lines.
The inverse is true for the Inv. BS Inv. FS levels, they are resistance as dashed lines, tested as dotted and support as solid lines.
Monthly timeframe is color pink
weekly grey
daily is red
4hr is orange
1hr is yellow
15min is blue
5min is green if they are shown.
strength favors the higher timeframe.
2x dotted levels are origin levels where trends have or will originate. When trends break, price will target the origin of the trend. its math, when the trend breaks, the vertex breaks too so the higher timeframe level/trend that breaks, the more volatility there could be as strength in the orders flow in to fuel the move.
US Stock Indexes Broke New RecordsCBOT: Micro E-Mini Dow Jones Futures ( CBOT_MINI:MYM1! )
After a 9-day delay due to the U.S. government shutdown, the Bureau of Labor Statistics (BLS) released the September CPI data on October 24th. Here are the highlights:
• The Consumer Price Index for All Urban Consumers (CPI-U) increased 0.3% on a seasonally adjusted basis in September, after rising 0.4% in August.
• On an annual basis, the headline inflation rose 3.0% before seasonal adjustment.
• The CPI index for all items less food and energy, commonly known as the Core CPI, rose 0.2% in September, after rising 0.3% in each of the 2 preceding months.
As cooling inflation data spurred investor optimism, U.S. stocks reached new heights again on Friday. The market expects the Federal Reserve to stay on its rate-cutting path, boosting the U.S. economy and justifying higher stock valuations.
The Dow Jones Industrial Average rose 472.51 points, or 1.01%, to 47,207.12, securing its first close above the 47,000 level. The S&P 500 added 0.79% to 6,791.69, while the Nasdaq Composite climbed 1.15% to 23,204.87. All three closed at records.
Following the CPI data, traders increased their stakes that the Fed will cut rates in October and December. Odds for a December cut jumped to 98.5% from roughly 91% before the data, per the CME FedWatch tool. Odds for a cut next week remained above 95%.
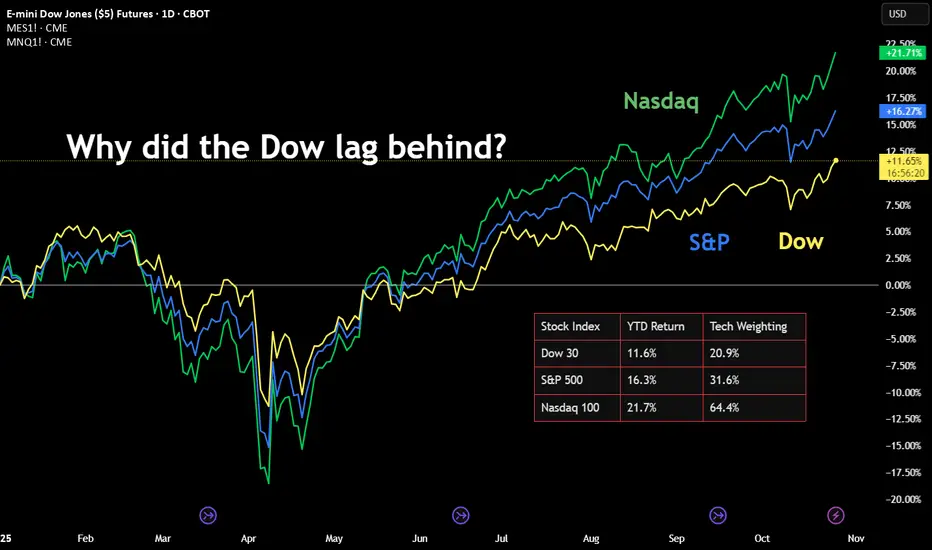
The Case of Dow over S&P and Nasdaq
As of Friday, the Dow gained 10.55% year-to-date, while the S&P rose 15.01% and the Nasdaq was 20.18% higher in 2025.
Why did the Dow lag behind the S&P and the Nasdaq? A simple answer is due to its lower index weight on technology. Since the current bull market is primarily driven by A.I., the Dow benefited less comparing to the other two stock indexes.
The Dow has six component companies in the technology sector. Their combined weight comes to 20.91% of the 30-stock index as of today.
• Microsoft (MSFT), 6.82%
• IBM (IBM), 4.00%
• Apple (AAPL), 3.42%
• Salesforce (CRM), 3.32%
• Nvidia (NVDA), 2.43%
• Cisco (CSCO), 0.92%
For a comparison, the S&P 500 has a weighing of 31.6% on Information Technology, while the Nasdaq-100 has a weighing between 62.48% - 64.45% for Technology.
In my opinion, the stock market has already beaten up so much on the A.I. hype, and it is late in the bull market cycle. The Nasdaq-100 has a lofty valuation with a Price/Earnings ratio of 33.25 (trailing 12-month), according to Birinyi Associates. Meanwhile, the Dow has a more reasonable P/E ratio of 24.90.
I am bullish on U.S. stocks long term. However, I share the growing concerns about potential collusion among AI companies. Types of AI collusion under investigation:
• Partnerships and investments: Tech giants invest billions into AI startups. Are these deals designed to control the AI ecosystem and suppress competition?
• Algorithmic price-fixing: Companies may use AI-powered pricing algorithms to inflate prices. Antitrust agencies are actively scrutinizing potential collusive outcomes.
• AI companies may use shared platforms or common algorithms to align market strategies, potentially forming a tacit "hub-and-spoke" conspiracy.
• Companies initially release AI models as "open source" to gain market share, accumulate data, and establish an ecosystem, only to later close off access.
• Dominant tech firms with control over cloud computing infrastructure, proprietary data, and massive financial resources could entrench their positions in the AI market.
To summarize, the Dow is a safer bull-market strategy given its more reasonable valuation. Investors are wise to stay clear off the potential crush on the A.I. hype.
Trading with Micro E-Mini Dow Jones Futures
If a trader shares a bullish view on the Dow, he may consider using stock index futures to enhance investment returns.
Micro E-Mini Dow Jones futures (MYM) offer smaller-sized versions of CME Group’s benchmark Dow Jones futures (YM) contracts. Micro futures have a contract size of 0.5 times the DJIA index, which is 1/10th of the standard contract.
CME data shows that the E-Mini and Micro Dow Jones futures have a combined open interest of 105,674 contracts as of Friday. Due to the government shutdown, the CFTC Commitment of Traders report has not been updated since September 23rd. We are currently in the dark about the “Smart Money” positions in the Dow.
Buying or selling one MYM contract requires an initial margin of $1,371. With Friday settlement price of 47,396, each December contract (MYMZ5) has a notional value of $23,857. Compared with investing in stocks, the futures contracts offer a built-in leverage of about 17 times (=23857/1371).
Hypothetically, if Dow futures price moves up 5% to 49,766 by December, the index gain of 2,370 points will translate into $1,185 for a long position, given each index point equal to $0.50 for the Micro contract. Using the initial margin of $1,371 as a cost base, the trade would produce a theoretical return of 86.4% (=1185/1371).
Futures contracts have expiration days, and you may not hold them forever like stocks. To stay long in the DJIA, a trader may consider a futures rollover strategy. An illustration:
• A trader buys the lead contract December now, and holds it till the end of November
• He will then sell December and buy March, which will become the next lead contract
• He will repeat this process: buy June 2025 and sell March 2026 in February 2026
• Repeat this again to buy September 2026 and sell June 2026 in August 2026
This series of trades allows a trader to establish a long position in the DJIA throughout the year, while holding the most liquid contracts.
There is no guarantee that each trade will yield positive returns. But if the Dow is trending up over time, the position would likely pay off.
The leverage feature in futures works both ways. It would magnify the losses as well as improving the winnings. The good news is, a trader could put stop-loss on his futures trades, limiting the downside risks.
For example, our trader may set stop-loss at 45,000 when he buys the MYM at 47,396. If the Dow falls to 40,000, his position will be liquidated well before that when the price hits 45,000. The maximum loss incurred will be $1,198 (= (47396 - 45000) * 0.5), which is less than the initial margin of $1,371.
The combination of Futures Rollover with Stop-loss could yield higher returns (thanks to the leverage) while maintaining a limited loss exposure. If the index bounces up and down but trends up in the long stretch, the trader will see both wins and losses. Since the wins are unbounded but the losses are contained, the overall returns would likely be positive.
Happy Trading.
Disclaimers
*Trade ideas cited above are for illustration only, as an integral part of a case study to demonstrate the fundamental concepts in risk management under the market scenarios being discussed. They shall not be construed as investment recommendations or advice. Nor are they used to promote any specific products, or services.
CME Real-time Market Data help identify trading set-ups and express my market views. If you have futures in your trading portfolio, you can check out on CME Group data plans available that suit your trading needs www.tradingview.com