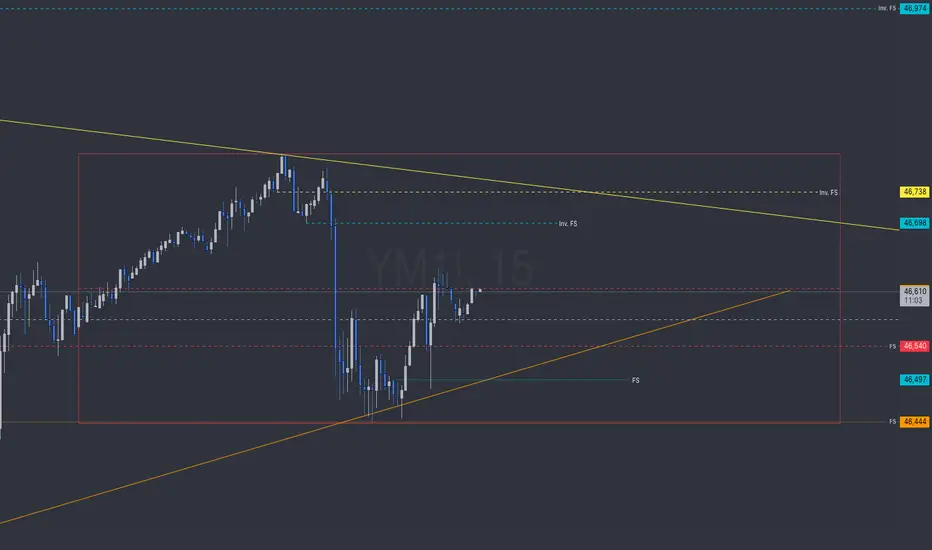
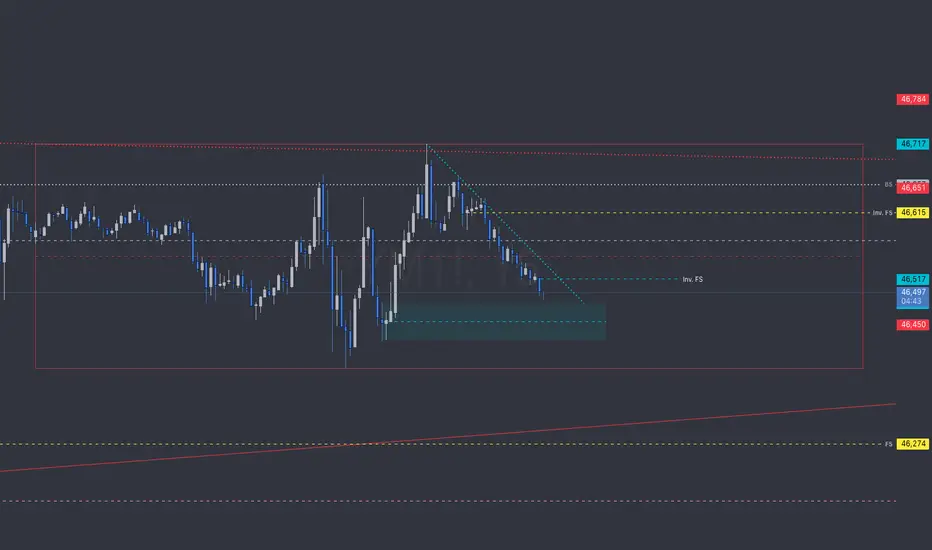
YM Updated levels for week 43
BS & FS levels are expected support when dashed lines, tested when dotted and resistance when solid lines.
The inverse is true for the Inv. BS Inv. FS levels, they are resistance as dashed lines, tested as dotted and support as solid lines.
Monthly timeframe is color pink
weekly grey
daily is red
4hr is orange
1hr is yellow
15min is blue
5min is green if they are shown.
strength favors the higher timeframe.
2x dotted levels are origin levels where trends have or will originate. When trends break, price will target the origin of the trend. its math, when the trend breaks, the vertex breaks too so the higher timeframe level/trend that breaks, the more volatility there could be as strength in the orders flow in to fuel the move.
Trade ideas


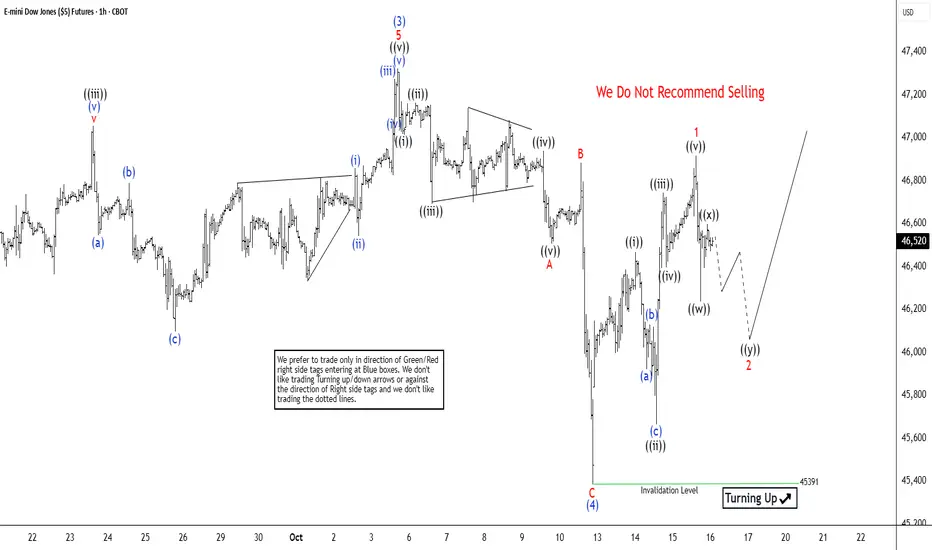
Dow Futures (YM) Eyeing Last Upside Push in Wave 5The short-term Elliott Wave outlook for Dow Futures (YM) indicates that the cycle from the April 2025 low continues as a five-wave impulse. As shown in the 1-hour chart, wave (3) of this impulse peaked at 47,323. The subsequent wave (4) pullback unfolded as a zigzag Elliott Wave structure. From wave (3), wave ((i)) declined to 47,014, followed by a wave ((ii)) rally to 47,162. Wave ((iii)) dropped to 46,693, wave ((iv)) rose to 46,938, and wave ((v)) concluded at 46,507, completing wave A. Wave B bounced to 46,883, and wave C extended lower to 45,391, finalizing wave (4) in the higher degree.
The Index has now turned higher in wave (5), but it must break above wave (3) at 47,323 to rule out a double correction. From wave (4), wave ((i)) reached 46,467, with wave ((ii)) pulling back to 45,663. Wave ((iii)) advanced to 46,743, wave ((iv)) dipped to 46,395, and wave ((v)) completed at 46,915, concluding wave 1. A wave 2 pullback is currently underway, correcting the cycle from the October 11 low before resuming higher. As long as the pivot low at 45,391 holds, expect the pullback to find support in a 3, 7, or 11-swing sequence, setting the stage for further upside.
Dow Jones - Looking To Sell Pullbacks In The Short TermH4 - Strong bearish move.
Uptrend line breakout.
No opposite signs.
Currently it looks like a pullback is happening.
Expecting bearish continuation after pullback until the strong resistance zone holds.
If you enjoy this idea, don’t forget to LIKE 👍, FOLLOW ✅, SHARE 🙌, and COMMENT ✍! Drop your thoughts and charts below to keep the discussion going. Your support helps keep this content free and reach more people! 🚀

YM 10/13I went a little overkill with the levels.
Black = last year and this year so far high, low, and median ranges
pink = monthly high, low, and median ranges
grey = weekly levels
red = daily
orange = 4hr
yellow = 1hr
blue = 15min levels
Inv. levels are resistance
BS / FS levels are support with different static expectations: BackSide levels should have a strong reaction to price while FrontSide levels should support price until accumulation candles can start engulfing to cause a reversal trend.
if, those expecations dont happen within 3-5 mins on a lower timeframe, they aren't happening on a higher timeframe without risk so exit and find a different range, untested level to target or wait until the correct candles begin forming after the level tests to re-enter.
These 4 candles (2 in the accumulation ranges, 2 in the distribution ranges) create 6 levels that paint a story. I don't mark the swingHigh or SwingLow's and favor the FS and inv.FS levels which reduce risk.

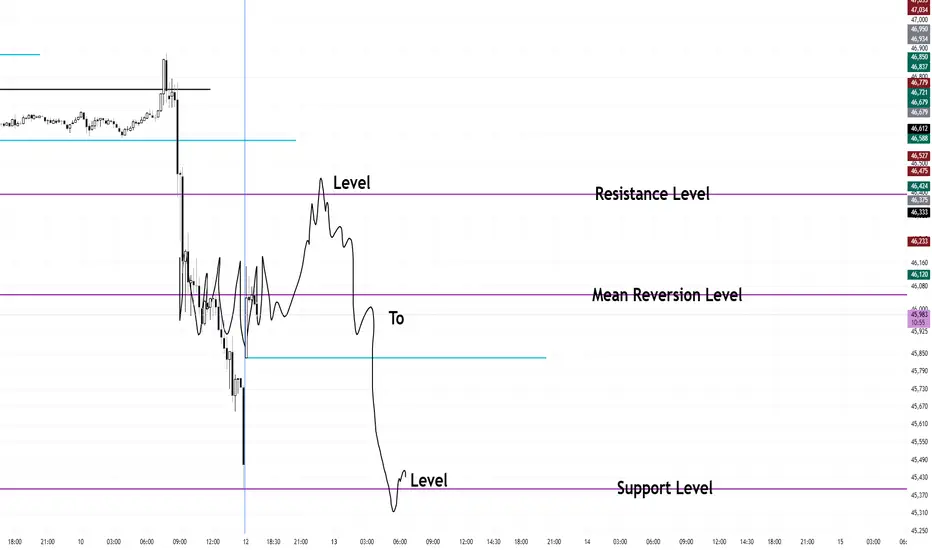
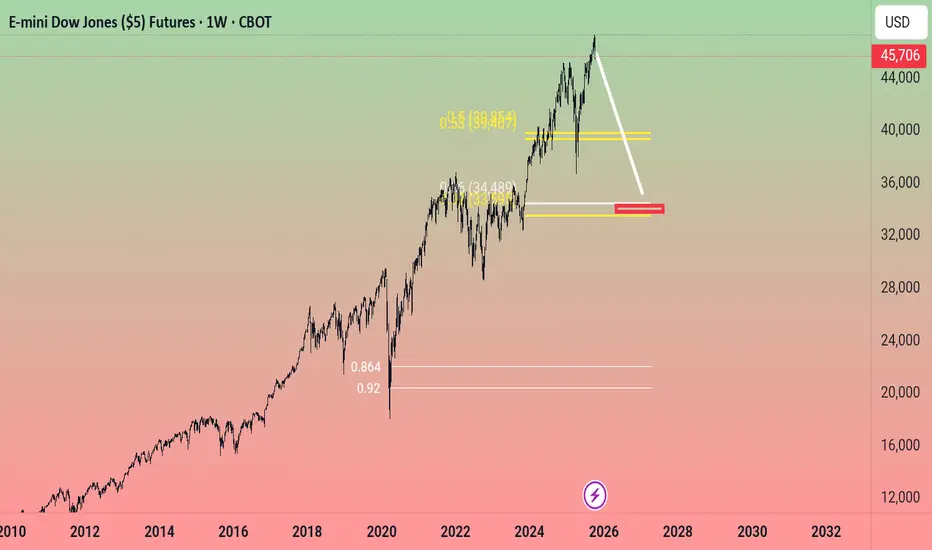
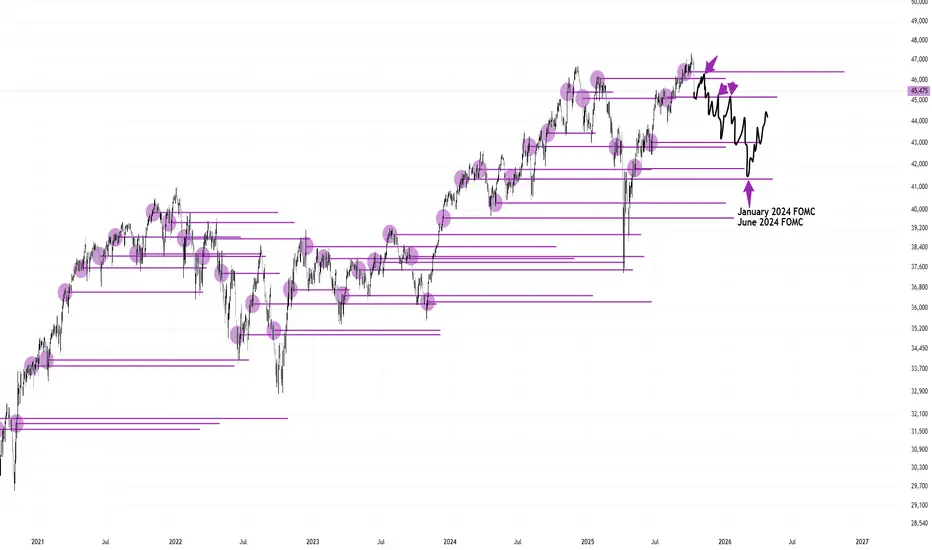
FOMC Level to Level Resistance TradeI am looking at the January 2025 FOMC level as mean reversion where price will oscillate between. I am looking at the September 2025 level as resistance where it should fail at today and sell off back down to the November 2024 FOMC level.
June FOMC Pullback to 43,000Using my FOMC levels, I am expecting a pullback back down to 43,000 to mitigate some orders and to find support. What am I basing this on? I am basing this on the huge gap between prices from June FOMC and July FOMC.
Below is the 8-hour chart showing my thought process
Here are examples of this price gap return
My long-term thesis is to use the top FOMC releases as resistance and when price does breakout into the 50k's, will turn them into major support
Dow jones started short movementIf some one ask me about next Target of YM , I can tell only one thing , the cycle was ended and dow jones started correction phase... I
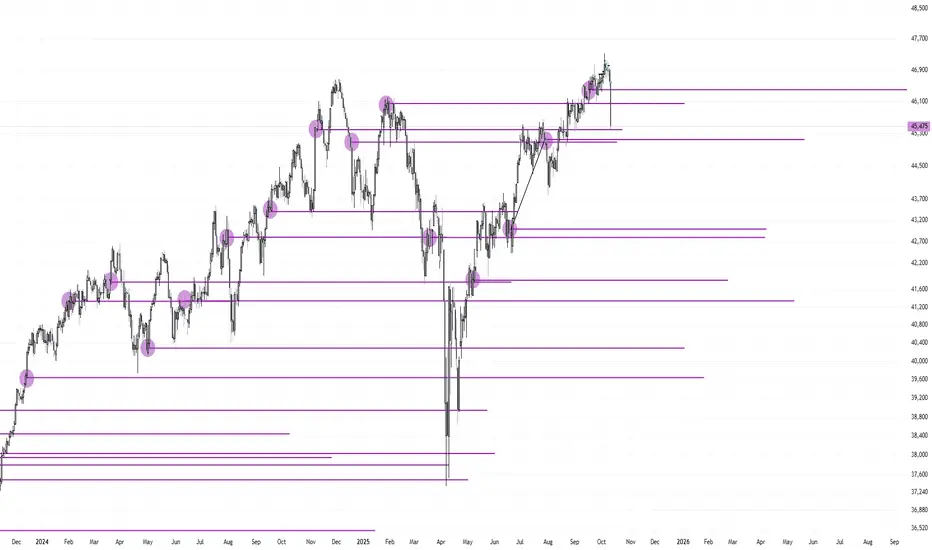
FOMC Support and Resistance Levels To Watch For 2025Below are my FOMC levels I have mapped out. Prices move SOLELY from FOMC releases.
This is a concept I first discovered last year and since then, have still been perfecting it.
I want to see the July FOMC hold as a short term support level before rallying into the September FOMC as resistance for the pullback dump.
Ultimately, I am looking for January 2024 FOMC to hold as the next major long term bottom before breaking out into the 48,000-50,000s
Below I will post screenshots of how FOMC levels are used as I am not good explaining. Take the time to study these charts and see for yourself that Dow Jones makes it's price action based on the releases of FOMC.
Protected Levels:
Levels that do not get touched and are defended.
Resistance Levels:
Support Levels:
And of course, the biggest support level used with the April dump right into May 2023 FOMC
Mean Reversion Levels:
These levels even work intra day. Take a look below to see how well these are respected.
YM 10/10The T.A paints the picture.
INV. levels. are resistance unless solid lines.
FS / BS levels are support unless solid lines
1x dotted are tested
2x dotted. are Origin levels where Trends originate from; a vertices in the fractals of time.
Each level is color coded to the timeframe the candle was found on.
Strength favors the higher timeframes
Pink = month
grey = week
red = day
orange - 4hr
yellow - 1 hr
15min - blue
5min - green

YM 10/7Highest timeframes are strongest
Weekly = grey
4hr = orange
1hr = yellow
15min = blue
5min = green
Inverse levels marked INV. FS or INV.BS are resistance levels unless solid lines
FS or BS levels are support unless solid lines
BS levels have an expectation to have a strong reaction to price while FS levels hold price stable until a reversal can occur. IF those expectations aren't being met in the first 5mins on a 1min timeframe, THEN price is likely targeting a different range/level and or liquidity is not there.

End of Year GameplanPrice is currently in a bullish spike and grind channel. Price is moving 1200 ticks up and 800 ticks down in a grindy up and down bullish trend. Friday, August 22nd was the breakout from the July range and since then, has now been grinding.
800 ticks down from the recent high would put Dow in the park around 46,300 or so. This would mean we are in a counter trend pullback phase with a couple of down days.
After the pullback, 1200 ticks higher would put Dow around 47,750 or so.
With the final quarter of 2025 upon us, I am curious where it will close at. So far it has been a choppy year.
Our current price action reminds me of late 2020, early 2021. Just a grinding march higher and a complete chop fest.

YM - 10/6Pink = Monthly timeframe levels
Grey = weekly
Red = Daily
Orange = 4hr
Yellow = 1hr
Inv. levels are resistance
BS or FS levels are support with different expectations. BS = strong reaction to price. FS = Slow reaction to price, creates an accumulation trend and candles.
If/ they statements guide my thinking. If The nearest 1hr BS level is tested, then is should have a strong reaction to price. If not, then the frontside candle will be targeted to create trend. If not, then a lower range, trend or level is being targeted.
If candles of support / resistance are not formed in 3-5mins then exit and find a better entry.

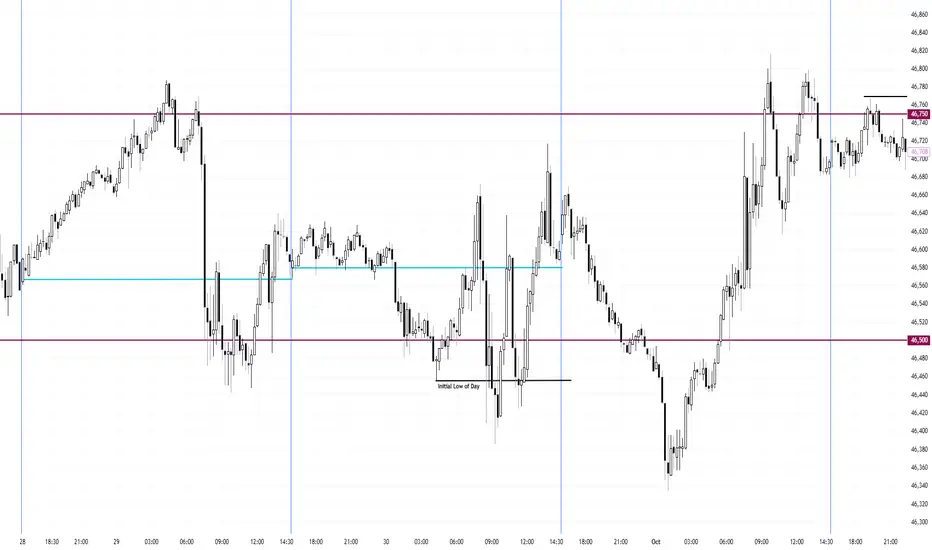
Daytrading Setup NY High of Day Dump Buy Low of Day TutorialOne of my favorite setups that I love to trade is the range day's New York High of Day dump buying Low of Day. This setup does not require ANY "top down" analysis and only requires the 15-minute chart. All you need is to wait a couple hours after NY opened and run its course.
By waiting, you accomplish a few things
1. Avoid getting faked out
2. Get to see the day's ATR
3. Ability to calculate the day's position size better
4. Buy near the low of day, targeting the full daily range
Below is the setup and the ideal entry point. One thing I have learned over the years is to never chase giant candles. The market will always give the best entry with the smallest possible candle.
Step One: 30 minutes before the open of New York
Mark the Daily Opening Price
Find and mark the initial low of day
Since you want to be buying the low of day, don't worry too much about the initial high of day. You are looking for the New York's high of day.
Initial HOD/LOD = Highs and Lows placed before NY
New York HOD/LOD = Highs and Lows made by NY
Step Two: Let NY open and do its thing. You are waiting for the NY HOD to be put in place.
How do you know when NY has put in it's High of Day? You wait for a swing point.
Step Three: Mark NY's High of Day
Step Four: Wait until price dumps down and takes out the initial Low of Day. You want to be buying as close to the lows as you can. Never get caught buying the highs of day.
Step Five: Mark the new NY Low of Day
Step Six: Wait for your entry
How will you know what the specific entry will be to enter? You won't 100% but what will help guide you is to not enter on giant bars.
Step Seven: Plan and Execute the trade
There are many variations of this setup and it is up to you to study and recognize the small differences. The market is not going to make it easy for you.
Two biggest tips is one, buy near the NY low of day and two, never chase giant candles. Wait for small bull candles near the low.
Another tip. If your high of day target has not been hit before NY closes, the best course of action is to set up a Good till Canceled bracket order and hold overnight until target hit. Taking small, partial profits will blow your account. You need full winners. The edge holding overnight is too good to close your trade at the NY close. Hold overnight.
YM week 39Monthly Timeframe levels are in pink
Weekly = grey
Daily = red
4hr = orange
1hr = yellow
15min = blue
The Grey box is last weeks candle so its showing High, Low, and Median range of last week.
I went overboard with 20 levels marked on the chart.

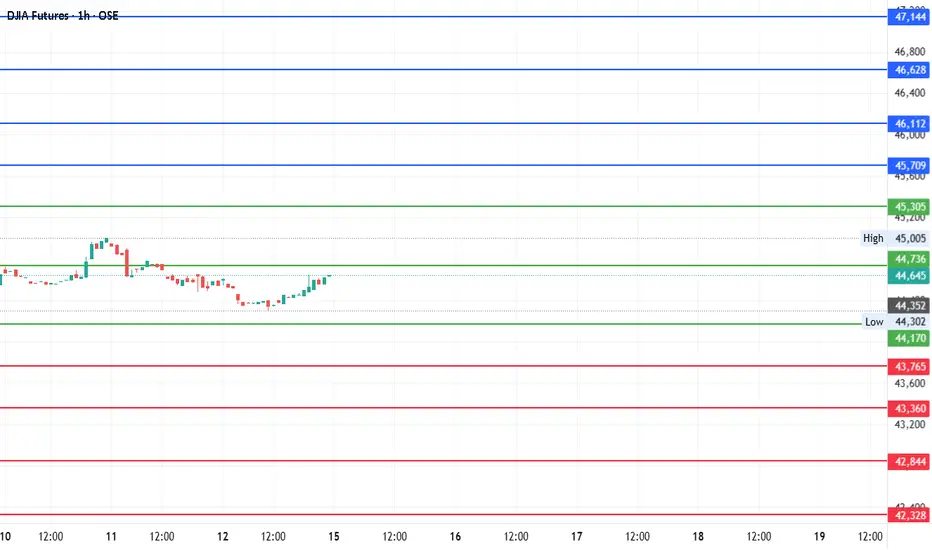
#DJI Futures Outlook: Key Levels to Watch Around Pivot 44,736Date: 14-07-2025
📊 Current Price: 44,645
📍 Pivot Point: 44,736.00
🔼 Upside / Bullish Scenario
If the price sustains above the pivot point (44,736), it could target the following resistance and bullish targets:
Immediate Resistance: 45,305.40
Target 1: 45,708.70
Target 2: 46,112.00
Target 3: 46,628.00
Target 4: 47,144.00
Bullish Bias Trigger: A break and hold above 45,305.40 increases confidence in these targets.
🔽 Downside / Bearish Scenario
If the price moves and holds below the pivot, the focus shifts to support levels and bearish targets:
Immediate Support: 44,170.04
Target 1: 43,765.02
Target 2: 43,360.00
Target 3: 42,844.00
Target 4: 42,328.00
Bearish Bias Trigger: A break below 44,170.04 opens the door to these downside levels.
#DowJones #TradingView #StockMarket #Investing #Trading #DJIFutures
#PivotPoints #DowJones #MarketOutlook #FuturesTrading
YM 10/3Lets see where this goes.
Inv.BS & Inv. FS dashed levels are resistance
BS & FS levels are support.
Black color = yearly timeframe
pink = monthly
grey = week
red = day
orange = 4hr
yellow = 1hr
blue = 15min
green = 5min.

AMP Futures | Introducing Table ViewIn this idea we will demonstrate how to access the new Table view feature using TradingView.

Non Farm Payroll IdeaThis post is mostly for myself and is for s.. and giggles. I am just curious how price will play out. I do not trade News Days but analyzing the chart, I am seeing price mean reverting around 750 and is bullish. Wednesday was the low of week. I am thinking Friday pullsback and ends the week at the highs.
This week is clearly in a bullish range bound weekly template.

YM 10/215min timeframe view
Color Coded to timeframe; strength favors higher timeframes
Monthly timeframe = Pink
Week = Grey
Day = Red
4hr = Orange
1hr = Yellow
15min = blue
The hourly distribution trend needs an hourly level to break. Could the Hourly Inv.BS level be the one? The current candle if closes blue will be the ladder forming to break the trend. We'll see. Hourly levels, trends activate the blue and orange timeframes.

A us30 Futures trade long us30 for Plus 150a dow futures live trade, a long 2 to 1 trade on the dow futures. previous day high using a measured move. daybreak out pull back and we are trading the entry long from previous day high to new high for 150 pips

YM - 10/112 lines color coded to the timeframe they were found on which shows the strength of the level. Higher timeframes stronger than lower ones
Month - pink
week - grey
day - red
4hr - orange
1hr - yellow
15min - blue
YM 9/30Levels are marked on the screen and color coded to the timeframe they were created on.
Weekly box is grey and shows the high, low and median range.
The red box is a daily high, low and median from yesterday.
Orange levels are 4hr timeframe
yellow is the hourly timeframe and blue is the 15min timeframe.