Neckline Breaks and Trader Nerves: A Quick Guide to Bearish H&S The head and shoulders pattern is like the market’s way of clearing its throat and saying, “Things might be changing up here.” Once that neckline snaps, traders often sit up straighter — not because something magical happened, but because the chart finally drew a clean line between “maybe” and “now
Mini Soybean Futures (Sep 2027)
No trades
Related commodities

From Neckline to Target: Setting H&S Bearish Entries and ExitsUnderstanding the Head & Shoulders Breakdown
A bearish head and shoulders pattern gives traders a structured way to define entries and exits using price geometry rather than emotion. The pattern forms when a market transitions from strength to distribution, creating a left shoulder, a higher head,
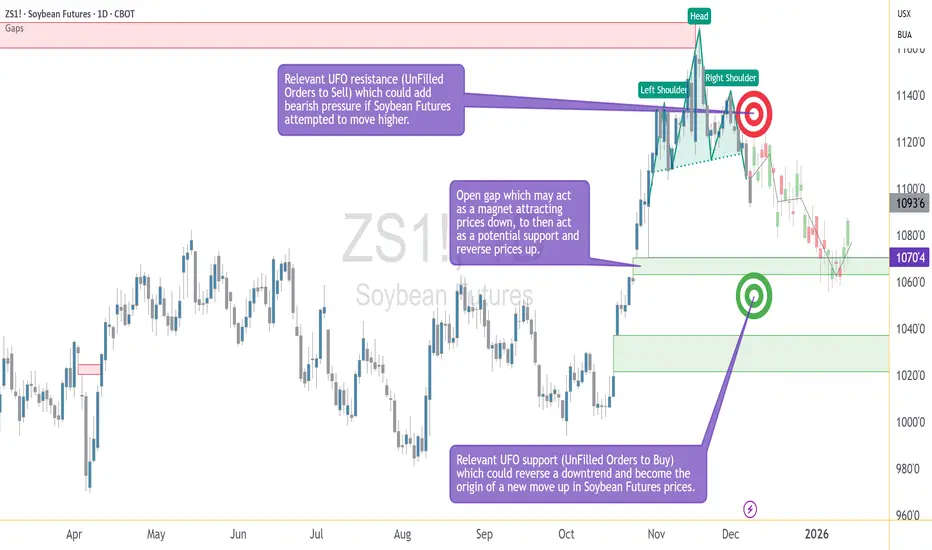
CBOT Soybean Technicals and Fundamentals (ZS1!) - Dec 05, 2025Soybeans remain in a corrective phase after confirming a short‑term top, with price likely to probe lower supports unless weather or WASDE headlines flip the sentiment.
🟤 CBOT Soybean Technicals (ZS1!)
- 🧱 **Pattern**: A clear **Head & Shoulders** has formed on the daily chart, with price breaking

ZS1!China is expected to purchase 12 million metric tons of soybeans from the United States, following the meeting in South Korea that took place several months ago. After Trump’s statements, the markets surged sharply, but I believe China has not made—and will not make—any public statements on the matt

Soybeans Surge on Thin Ice: Lessons from 2019Soybean prices have surged nearly 8% in two weeks, driven by renewed US-China trade tensions. While this looks like a familiar, event-driven rally, the fundamentals tell a different story.
Conflicting Weak Fundamentals
China has not purchased any US soybeans for the 2025/26 marketing year.

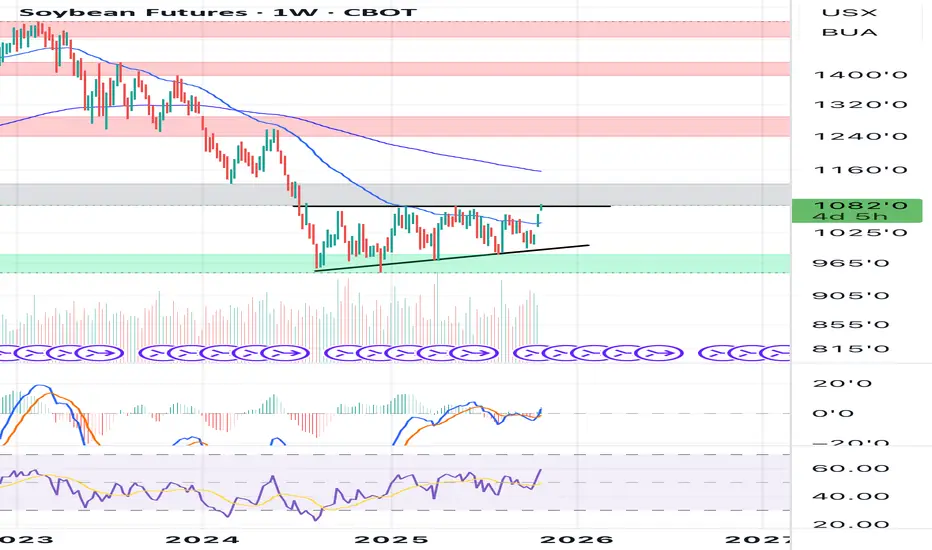
ZS - 14 months RECTANGLE══════════════════════════════
Since 2014, my markets approach is to spot
trading opportunities based solely on the
development of
CLASSICAL CHART PATTERNS
🤝Let’s learn and grow together 🤝
══════════════════════════════
Hello Traders ✌
After a careful consideration I came to the conclusion that:
-

Long on Soybeans Clear ascending triangle in play.
RSI, MACD are bullish and also above the 50 EMA.
I’m bullish on soybeans and current fundamentals.
I will long on breakout of ascending triangle.
TP - 1200
Soybeans on the RiseSoybean futures have seen a significant upward trend over the past two weeks, largely ignoring the pressure of the U.S. harvest season. This bullish move is not being driven by the fundamentals of crop supply, but almost entirely by political speculation surrounding the high-stakes trade talks betwe

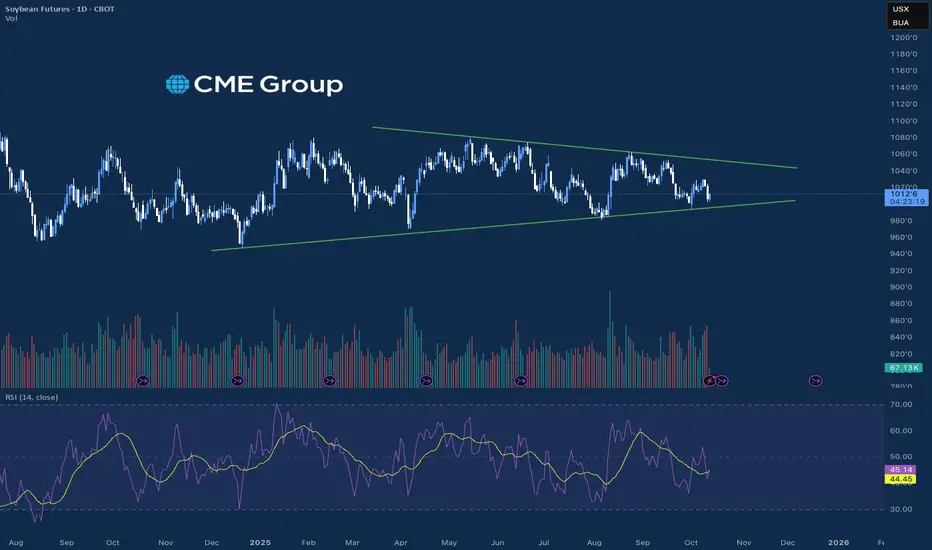
What's Next for Soybeans?The soybean market over the last four weeks has been volatile, largely driven by a combination of geopolitical tensions, U.S. harvest developments, and South American weather. The market has seen consolidation within a range where it seems to be carving out higher lows and may be on track for prices
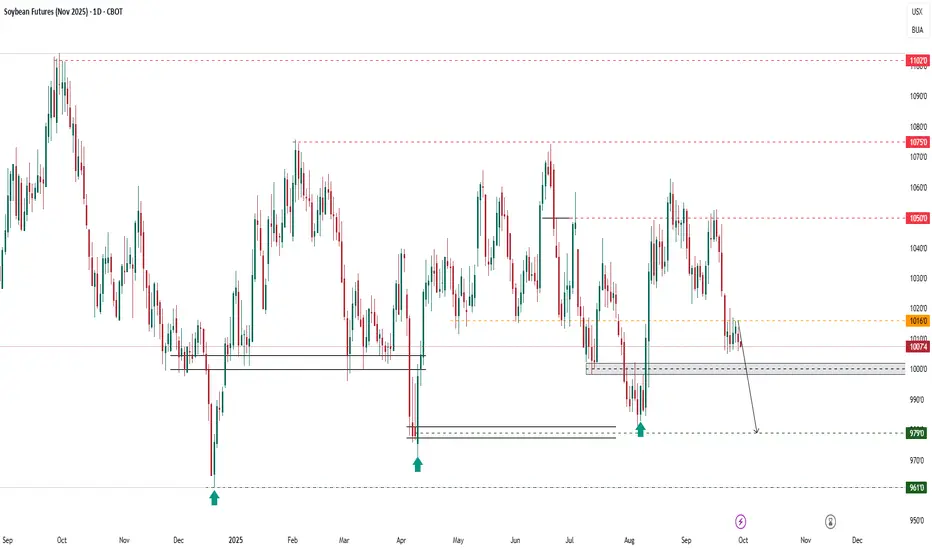
Analysis techniques – Soybean Futures (Nov 2025)Date: 30/09/2025 | Timeframe: D1 | Contract Code: ZSX25
1. Trend Overview and Price Structure
Soybean futures (Nov 2025) remain under pressure after failing to hold the 10,500 resistance. Prices are trading below 10,200 and are testing the psychological 10,000 level, with risks of retesting the 9
See all ideas
Summarizing what the indicators are suggesting.
Neutral
SellBuy
Strong sellStrong buy
Strong sellSellNeutralBuyStrong buy
Neutral
SellBuy
Strong sellStrong buy
Strong sellSellNeutralBuyStrong buy
Neutral
SellBuy
Strong sellStrong buy
Strong sellSellNeutralBuyStrong buy
A representation of what an asset is worth today and what the market thinks it will be worth in the future.
Frequently Asked Questions
The current price of Mini Soybean Futures (Sep 2027) is 1068'0 USX — it has risen 0.23% in the past 24 hours. Watch Mini Soybean Futures (Sep 2027) price in more detail on the chart.
Track more important stats on the Mini Soybean Futures (Sep 2027) chart.
The nearest expiration date for Mini Soybean Futures (Sep 2027) is Sep 14, 2027.
Traders prefer to sell futures contracts when they've already made money on the investment, but still have plenty of time left before the expiration date. Thus, many consider it a good option to sell Mini Soybean Futures (Sep 2027) before Sep 14, 2027.
Buying or selling futures contracts depends on many factors: season, underlying commodity, your own trading strategy. So mostly it's up to you, but if you look for some certain calculations to take into account, you can study technical analysis for Mini Soybean Futures (Sep 2027). Today its technical rating is sell, but remember that market conditions change all the time, so it's always crucial to do your own research. See more of Mini Soybean Futures (Sep 2027) technicals for a more comprehensive analysis.