Traditional|XW1!|LongLong XW1!
TA:
More accurate entry into the trade is possible when the upper border of the blue zone is broken (Screenshot attached).
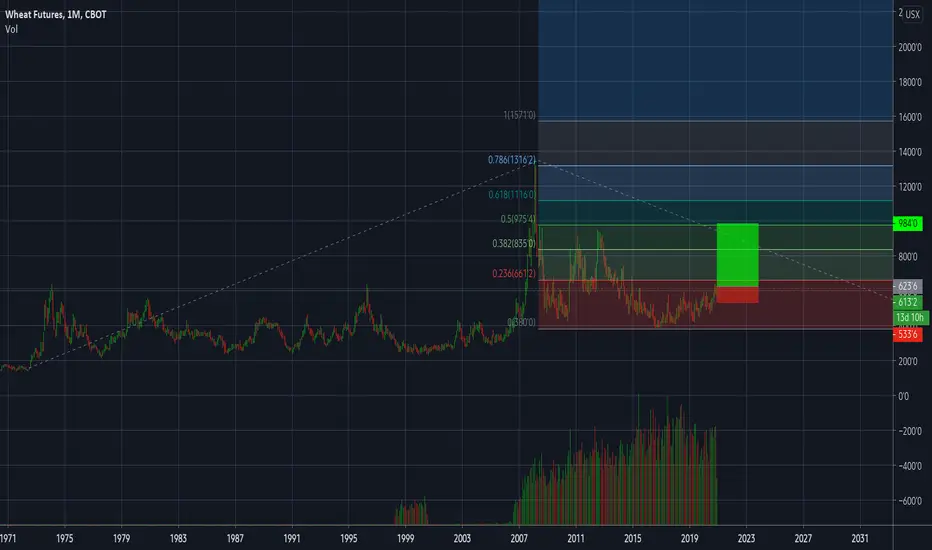
On the weekly timeframe, you can select 2 trend zones 23.07.12 to 08.08.16 and 09.08.16-28.09.20, the first trend zone is expressed by a price decline and a long-term downtrend (highlighted in red), the second zone is a price consolidation zone after a fall, and this zone can also act as an accumulation zone (highlighted in yellow). Since the consolidation zone was first formed by a new historical price low and lasted for a long period with constantly increasing min/max in the consolidation zone, I can conclude that it was an accumulation zone, after which in theory an uptrend begins (green zone) (Screenshot attached).
In the consolidation zone, due to rising by a small difference from the previous min/max, a channel was formed through which the accumulation zone passed, 12.10.20 this channel was broken. The initial attempt to gain a foothold above the channel was unsuccessful, but after repeated testing of the channel, the price again turned out to be above the resistance level of the channel, I can interpret this as the strength of buyers.
The output of the channel completely changes the dynamics of price movement with 09.08.16 because now the new maximum is much higher (compared to the update min/max in the consolidation area), therefore if to fix above channel does not work, then next low will be as much higher than the previous one, maybe he will be on the newly formed local trend support (Screenshot attached).
The possible take zone was determined using three fibonacci levels, the global, trending descending fibo level and the fibonacci level to determine the take price (orange zone) (Screenshot attached).
Other scenarios of development of events are also defined, with the exception of the first successful scenario (orange path), 2 other local options are highlighted:
1. Red way - it is impossible to gain a foothold above the channel resistance level and the price is adjusted to a new level of local trend support, after which it is sent to the channel resistance retest by rebound.
2. Red way - to gain a foothold above the resistance level of the channel does not work and the price is adjusted to the new level of local trendline of support, if we hold this support failed, price is free to fall to the support boundary of the channel, where you can gain solid purchase.
The stop zone can be determined based on the actions performed, in case of opening a trade on the breakout of the blue zone, the stop can be placed for the support level(former resistance) of the channel or for the level of local trend support.
Globally growing XW1! it can be higher than the specified take, it is possible to increase to the previous highs (947'0).
XW1! trade ideas


Wheat Sad story for people hungry in the world...
but at the make it or break it point
Still mostly bullish but rejected at the usual spot...

We Have Fort Probabilite to rise next days - weeks TO 700 USX We Have Fort Probabilite to rise next days - weeks
TO 700 USX
I ADvais You to buy it now

View on Wheat (12/4)General bias - bearish
Waiting to trade the break out for a confirmation of a downmove.
ep, tp , sl as per chart.
Disclaimer:
The information contained in this presentation is solely for educational purposes and does not constitute investment advice. We may or We may not take the trade.
The risk of trading in securities markets can be substantial. You should carefully consider if engaging in such activity is suitable to your own financial situation.
I am not responsible for any liabilities arising from the result of your market involvement or individual trade activity

CME CBOT:ZW Wheat Futures prices forecast, Buy, Target 951Chicago SRW Wheat Futures (CME CBOT: ZW)
Trade : Buy
Entry : 602
Target : 951 (349, +57.97%)
Stop : 557 (-45, -7.48%)
Posted on Saturday, December 12, 2020
Note : As I said before, we need to pay attention to grain prices. It seems that the wheat futures prices are ready for a big move. Wheat futures are on the upward trend. It's time to buy wheat. The next targets could be 685 and 951. The support could be 555. If wheat prices secure 950 level and the market is strong, the price of wheat would soar much higher than people can imagine. In the future, the suffering of the poor from rising grain prices will become even more serious. I hope everyone on earth live well together.


Buy Signal: 601'6Signal comes from our model-
Geometric Markov Model : In probability theory, a Markov model is a stochastic model used to predict randomly changing systems. Markov Models are used in all aspects of life from Google search to daily weather forecast. The randomly changing systems we focus on are the equity, futures, and forex markets. The geometric element of the model is the fractal wave structure you can find on any chart you look at across any market and across all time dimensions.
Our model focuses on the current wave formation (current state)- geometric price formation along with its volume and volatility over a given time period and using that information to predict the future state- future price movement.

A large probability that ZW is bearish this weekA large probability that ZW is going bearish in tendance this week, the targets probable after 584 is 566.5


I Recommend buying !ZW Will Rise Next Days I Advais You to Buy
Or Keep It in the portfolio
TArget is 631''2 USX
StoopLoss 585'6 USX

Wheat Futures potential long ideaWheat has validated H&H but we did not hit the target as per pattern, it can be that what we see is the bearish trap. In case wheat to clear and hold 598 level we can see the re-test of 640 highs or move on forward to 680-700 level.


Wheat cup and handle pattern to 900Bottoming pattern for the last 5 + years. This may breakout very strong before the end of this year.
Long term inflation play.
Good luck!

I Recommend buying !ZW Will Rise Next Days I Advais You to Buy
Or Keep It in the portfolio
TArget is 691 SD


Wheat (CBOT) weekly; SELLSelf explanatory. Beautiful, concurrent signals. There is also a gigantic wall of wheat out there!
