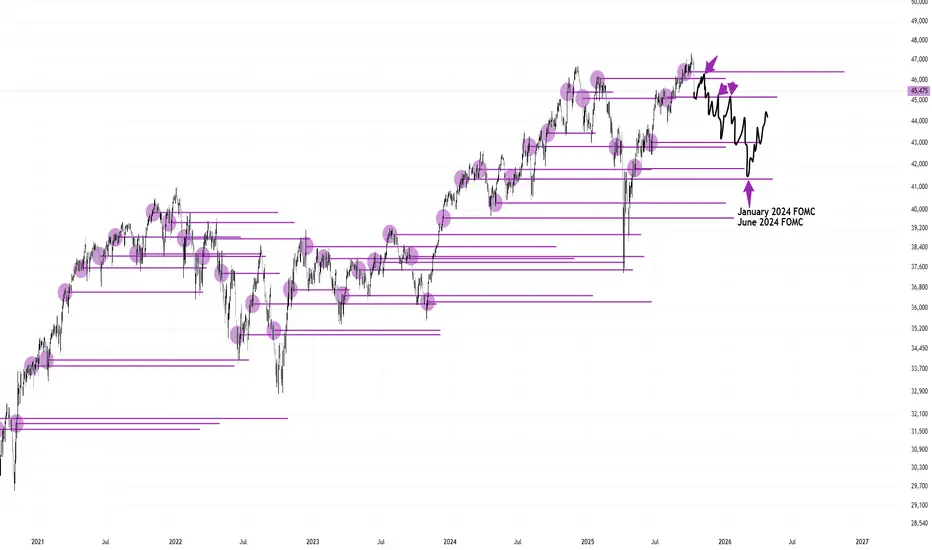
FOMC Support and Resistance Levels To Watch For 2025Below are my FOMC levels I have mapped out. Prices move SOLELY from FOMC releases.
This is a concept I first discovered last year and since then, have still been perfecting it.
I want to see the July FOMC hold as a short term support level before rallying into the September FOMC as resistance fo
About E-mini Dow Jones ($5) Futures
E-mini Dow Jones ($5) futures are derivative contracts with the Dow Jones Industrial Average (DJIA) Index as an underlying asset. These mini futures are electronically traded and give investors exposure to the US stock market through 30 US blue-chip companies, but they represent only a portion ($5) of standard Dow Jones futures, which makes them more accessible. Since these are still futures, traders use them to hedge their stock portfolios against risks that are inevitable in markets.
Related futures
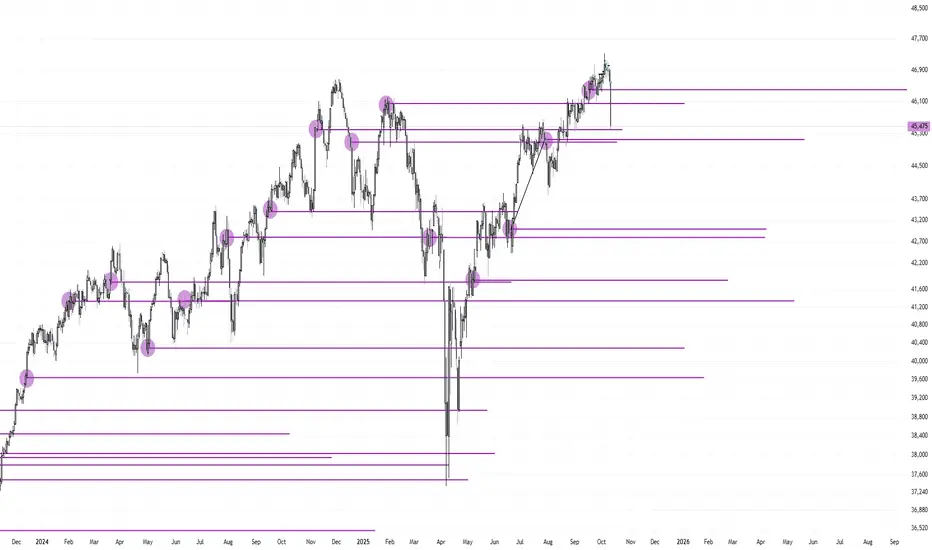
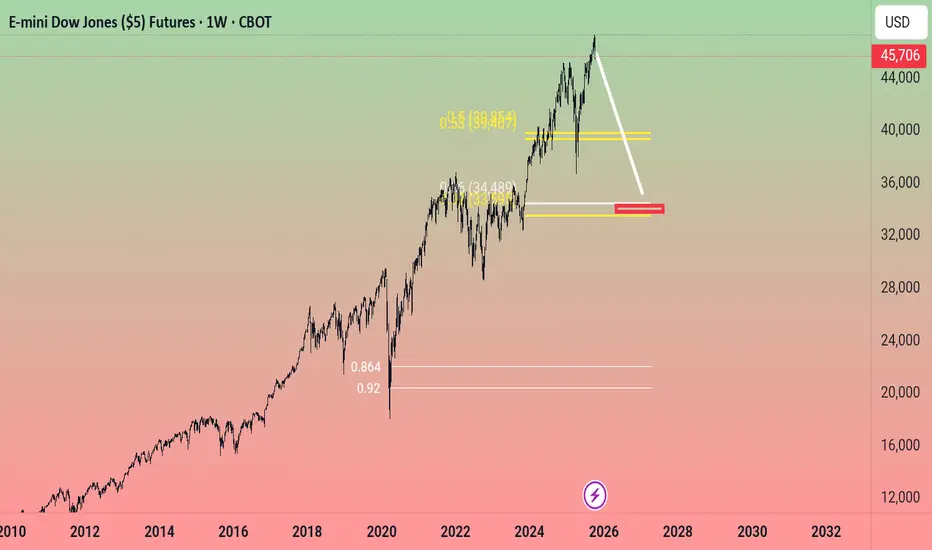
June FOMC Pullback to 43,000Using my FOMC levels, I am expecting a pullback back down to 43,000 to mitigate some orders and to find support. What am I basing this on? I am basing this on the huge gap between prices from June FOMC and July FOMC.
Below is the 8-hour chart showing my thought process
Here are examples of this
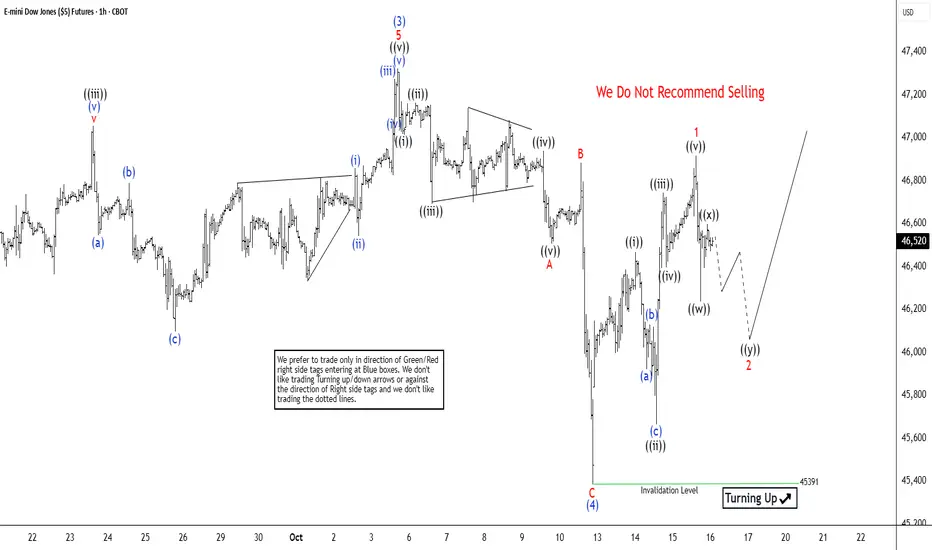
Dow Futures (YM) Eyeing Last Upside Push in Wave 5The short-term Elliott Wave outlook for Dow Futures (YM) indicates that the cycle from the April 2025 low continues as a five-wave impulse. As shown in the 1-hour chart, wave (3) of this impulse peaked at 47,323. The subsequent wave (4) pullback unfolded as a zigzag Elliott Wave structure. From wave
AMP Futures | Introducing Table ViewIn this idea we will demonstrate how to access the new Table view feature using TradingView.

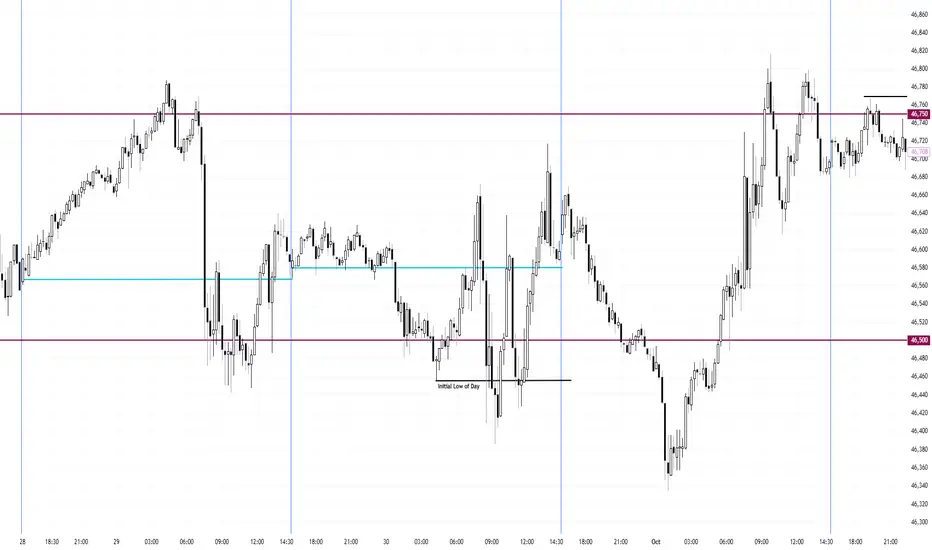
Daytrading Setup NY High of Day Dump Buy Low of Day TutorialOne of my favorite setups that I love to trade is the range day's New York High of Day dump buying Low of Day. This setup does not require ANY "top down" analysis and only requires the 15-minute chart. All you need is to wait a couple hours after NY opened and run its course.
By waiting, you accomp
YM week 39Monthly Timeframe levels are in pink
Weekly = grey
Daily = red
4hr = orange
1hr = yellow
15min = blue
The Grey box is last weeks candle so its showing High, Low, and Median range of last week.
I went overboard with 20 levels marked on the chart.

Dow Jones - Looking To Sell Pullbacks In The Short TermH4 - Strong bearish move.
Uptrend line breakout.
No opposite signs.
Currently it looks like a pullback is happening.
Expecting bearish continuation after pullback until the strong resistance zone holds.
If you enjoy this idea, don’t forget to LIKE 👍, FOLLOW ✅, SHARE 🙌, and COMMENT ✍! Drop your

YM 10/13I went a little overkill with the levels.
Black = last year and this year so far high, low, and median ranges
pink = monthly high, low, and median ranges
grey = weekly levels
red = daily
orange = 4hr
yellow = 1hr
blue = 15min levels
Inv. levels are resistance
BS / FS levels are support wi

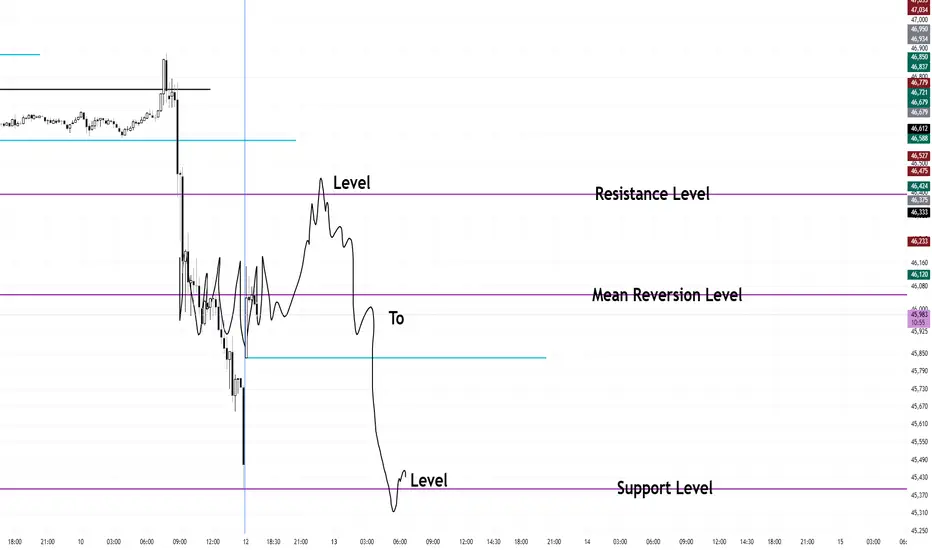
FOMC Level to Level Resistance TradeI am looking at the January 2025 FOMC level as mean reversion where price will oscillate between. I am looking at the September 2025 level as resistance where it should fail at today and sell off back down to the November 2024 FOMC level.
Dow jones started short movementIf some one ask me about next Target of YM , I can tell only one thing , the cycle was ended and dow jones started correction phase... I
See all ideas
Summarizing what the indicators are suggesting.
Neutral
SellBuy
Strong sellStrong buy
Strong sellSellNeutralBuyStrong buy
Neutral
SellBuy
Strong sellStrong buy
Strong sellSellNeutralBuyStrong buy
Neutral
SellBuy
Strong sellStrong buy
Strong sellSellNeutralBuyStrong buy
A representation of what an asset is worth today and what the market thinks it will be worth in the future.
Displays a symbol's price movements over previous years to identify recurring trends.
Frequently Asked Questions
The current price of E-mini Dow Jones ($5) Futures is 46,570 USD — it has risen 0.05% in the past 24 hours. Watch E-mini Dow Jones ($5) Futures price in more detail on the chart.
The volume of E-mini Dow Jones ($5) Futures is 20.70 K. Track more important stats on the E-mini Dow Jones ($5) Futures chart.
Open interest is the number of contracts held by traders in active positions — they're not closed or expired. For E-mini Dow Jones ($5) Futures this number is 85.21 K. You can use it to track a prevailing market trend and adjust your own strategy: declining open interest for E-mini Dow Jones ($5) Futures shows that traders are closing their positions, which means a weakening trend.
Buying or selling futures contracts depends on many factors: season, underlying commodity, your own trading strategy. So mostly it's up to you, but if you look for some certain calculations to take into account, you can study technical analysis for E-mini Dow Jones ($5) Futures. Today its technical rating is buy, but remember that market conditions change all the time, so it's always crucial to do your own research. See more of E-mini Dow Jones ($5) Futures technicals for a more comprehensive analysis.