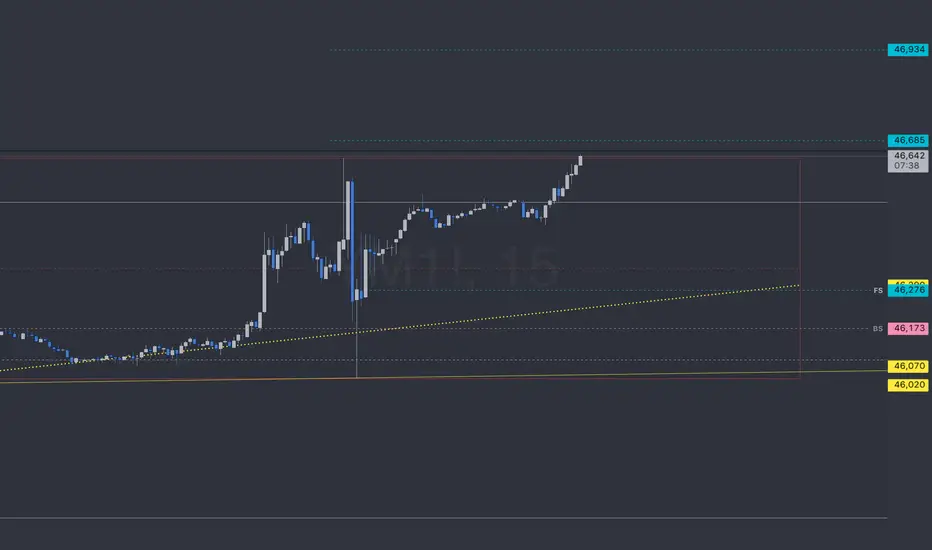
YM 9/18With a yearly high in black there might be some resistance above price. Its a major level of influence and strength. Above it I have two 15min fib levels as guesses at price targets.
below price is a weekly high support (grey), Daily median (red), an hourly trend (yellow) and a 5 min level at the
About E-mini Dow Jones ($5) Futures
E-mini Dow Jones ($5) futures are derivative contracts with the Dow Jones Industrial Average (DJIA) Index as an underlying asset. These mini futures are electronically traded and give investors exposure to the US stock market through 30 US blue-chip companies, but they represent only a portion ($5) of standard Dow Jones futures, which makes them more accessible. Since these are still futures, traders use them to hedge their stock portfolios against risks that are inevitable in markets.
Related futures
Dow Futures (YM) Resumes Upward Drive in Impulsive FormationThe short-term Elliott Wave analysis for Dow Futures (YM) indicates a cycle from the 1 August 2025 low is forming an impulse. The wave 1 peaked at 45,841, followed by a wave 2 pullback that ended at 44,996. Wave 2’s internal structure developed as a zigzag. From wave 1’s peak, wave ((a)) dropped to


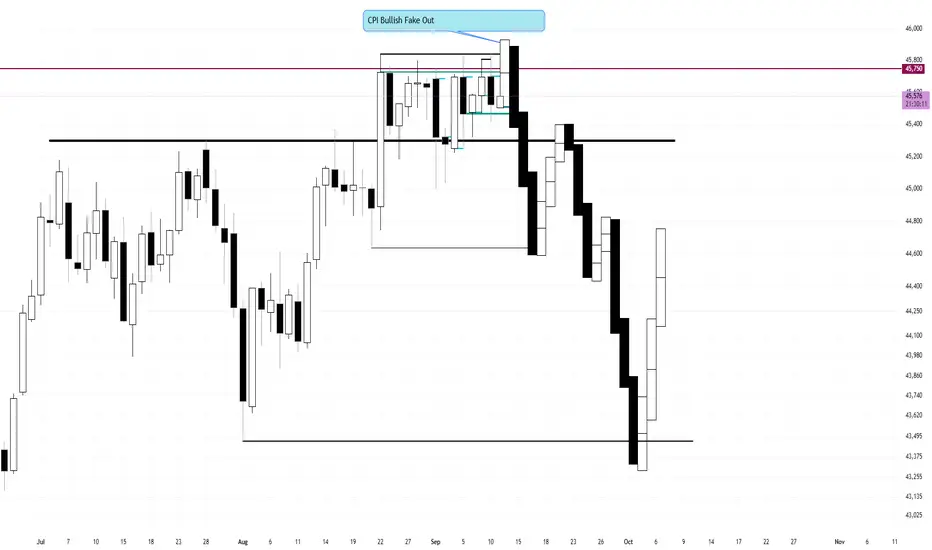
CPI Bullish Fake out (Bearish Range- False Break Reversal)
I am anticipating a Bullish close on Thursday to close above these highs for a 1% rally. Then Friday to wipe the board to start the move back down to the other side of the range for the true support Long.
I will continue to look for Sells until support. This is a Bearish range at the top.

ym short
Position: SHORT E-mini Dow Futures
Current Price: 46,749
Market Context: Range-bound consolidation after overnight session
SMC Analysis:
Order Blocks & Liquidity:
Sell-Side Liquidity: Above 46,840 (session high) - our stop location
Buy-Side Liquidity: Below 46,440 (session low) - our target zon


ym 9/199 lines on the chart today
The hourly local distribution trend seems to be gaining strength.
Monthly timeframe Pink
Weekly = Grey
Daily = Red
4hr = Orange
1hr = Yellow
15min = Blue
5min = Green
4 candles, 6 Levels, & MarketMeta
Range = 2 or consecutive candles of the same color.
Distribution R

All Day Expansion Daily Template Buy TriggeredBased on what I am seeing and, in the past, this is setting up to be an all-day expansion type day. I am Long now off support from that 15-minute doji at 03:15am
Here is an example of an all day expansion day type

YM : Long levelThe level has been activated, so you can buy it. I have slightly edited it since last time. It is best to scalp or pip it; I cannot promise any significant movement. Be careful when trading on news or at market close/open.

See all ideas
Summarizing what the indicators are suggesting.
Neutral
SellBuy
Strong sellStrong buy
Strong sellSellNeutralBuyStrong buy
Neutral
SellBuy
Strong sellStrong buy
Strong sellSellNeutralBuyStrong buy
Neutral
SellBuy
Strong sellStrong buy
Strong sellSellNeutralBuyStrong buy
A representation of what an asset is worth today and what the market thinks it will be worth in the future.
Displays a symbol's price movements over previous years to identify recurring trends.
Frequently Asked Questions
The current price of E-mini Dow Jones ($5) Futures is 46,463 USD — it has risen 0.14% in the past 24 hours. Watch E-mini Dow Jones ($5) Futures price in more detail on the chart.
The volume of E-mini Dow Jones ($5) Futures is 73.17 K. Track more important stats on the E-mini Dow Jones ($5) Futures chart.
Open interest is the number of contracts held by traders in active positions — they're not closed or expired. For E-mini Dow Jones ($5) Futures this number is 77.84 K. You can use it to track a prevailing market trend and adjust your own strategy: declining open interest for E-mini Dow Jones ($5) Futures shows that traders are closing their positions, which means a weakening trend.
Buying or selling futures contracts depends on many factors: season, underlying commodity, your own trading strategy. So mostly it's up to you, but if you look for some certain calculations to take into account, you can study technical analysis for E-mini Dow Jones ($5) Futures. Today its technical rating is buy, but remember that market conditions change all the time, so it's always crucial to do your own research. See more of E-mini Dow Jones ($5) Futures technicals for a more comprehensive analysis.