NAS100 Trade Set Up Nov 28 2025Price remains bullish making HH/HL on the 1h. I will want to see a tap in the 4h gap followed but 1m-5m IFVG/CISD to continue higher BSL
Trade ideas

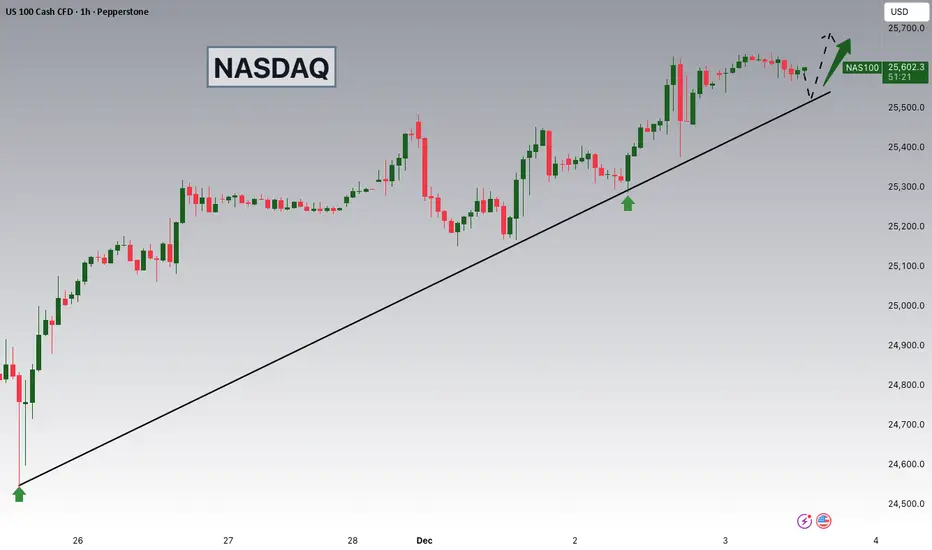
NASDAQ Potential UpsidesHey Traders, in today's trading session we are monitoring NAS100 for a buying opportunity around 25,520 zone, NASDAQ is trading in an uptrend and currently is in a correction phase in which it is approaching the trend at 25,520 support and resistance area.
Trade safe, Joe.
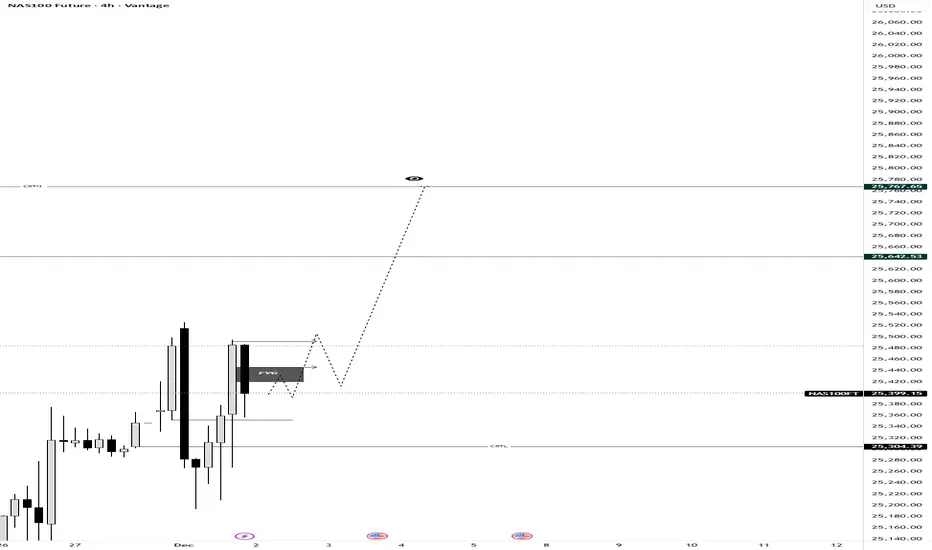
NAS100 Decoded: The Anatomy of a CRT SetupMost traders see random candles; we see a structured story. On this 4H NAS100 chart, we are witnessing a textbook example of Candle Range Theory (CRT) in motion.
If you understand the "Three-Phase Engine" inside every candle, the next move becomes clear.
The 3-Step Logic Behind This Setup:
The Purge (Accumulation): Notice how price dipped to sweep the CRTL (Candle Range Theory Low). This wasn't a random breakdown; it was a Purge Phase designed to grab liquidity and trap retail shorts. By sweeping the low (PL), the market collects the necessary fuel for the reversal.
The Mitigation (The Current Trap): Price has reclaimed the range and is currently mitigating within the FVG (Fair Value Gap). In CRT, this is the Mitigation Phase, where price returns to balance or "Equilibrium" (EQ) to fill imbalances before the real move begins. This phase often confuses traders, but it is simply smart money rebalancing positions.
The Expansion (The Delivery): With the internal liquidity harvested and the imbalance filled, the logic dictates a move toward the CRTH (Candle Range Theory High). This is our Expansion Phase, targeting the "Expansion Level" (EL). The "eye" icon on the chart represents the Draw on Liquidity (DOL)—the magnetic attraction pulling price toward the liquidity pools resting above the highs.
💡 The Lesson: Don't chase the red candles during the purge. Wait for the mitigation. As the theory states:
"The Purge phase creates the opportunity, the Mitigation phase provides the entry, and the Expansion phase delivers the profit".
Are you watching this FVG hold, or are you waiting for a break of structure confirmation? Let me know in the comments! 👇
Greetings,
MrYounity

NAS100 Trade Set Up Nov 26 2025Price remains in a bullish trend so as long as it stays closed above 1h swing low/London low i will look for internal SSL sweep to then target buys to higher BSL

NAS100 4h SELLchart presents a medium-term bearish outlook, followed by a long-term bullish reversal. combining Fibonacci retracements, cycle timing (bars/days), moving averages, and wave projections to create a full market roadmap.
Below is a structured analysis:
1️⃣ Current Market Structure
NAS100 reached a major top near 26,000 before reversing.
Price broke below the short-term trendline and is dropping toward deeper support.
The red zig-zag pattern reflects your expectation of continued selling pressure.
This suggests the index is entering a medium-term correction.

NASDAQ NAS100 Analysis and My Trade Plan📊 Currently analysing NAS100 (NASDAQ), we can see that price has broken structure to the upside, confirming bullish intent. Right now, NAS100 is retesting the value area and the Point of Control (POC) on the volume profile — a critical zone to watch 👀📈
⚠️ Price action is a bit precarious. After a strong impulsive move, we’ve now seen a deep and aggressive retracement, which opens the door for potential bearish movement this week.
📆 However, my higher-timeframe bias remains bullish, with the weekly chart still supporting upward continuation.
📌 My plan:
If price holds above the current POC, then breaks and retests cleanly, I’ll be looking for long opportunities. If it breaks below the POC, I will step aside and abandon the long bias 🚫
This is not financial advice — just my personal market outlook. 💬📉📈

Trump It...Think we're close to completing this bull trap before we slide down lower - Q the free fall.

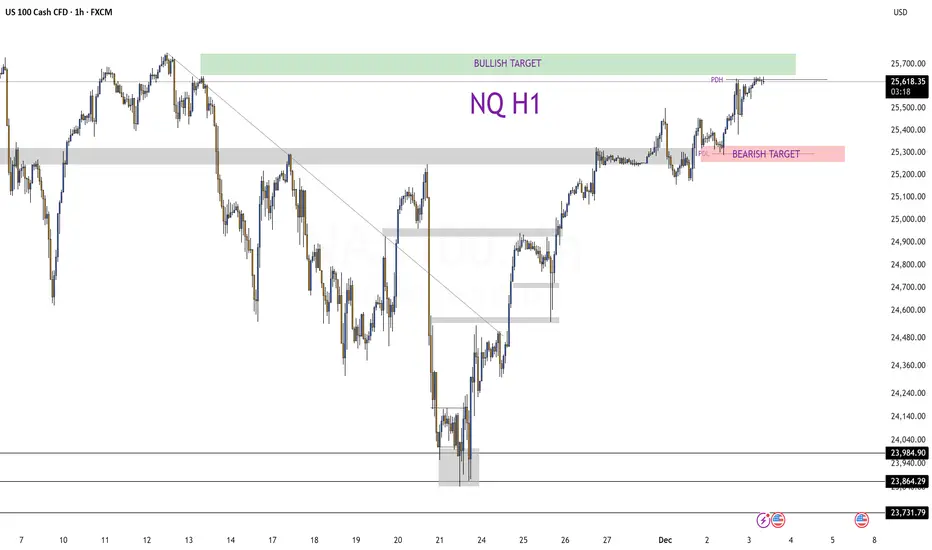
Nasdaq Hits Resistance: Pullback Before the Next Bullish Move?📊 Nasdaq – Technical Setup & Market Catalysts
The index recently tested a previously unfilled Fair Value Gap (H1 timeframe) and swept liquidity from last week’s accumulation — a process that often precedes new directional moves. The move cleared many trapped positions and reset the orderbook.
Currently, Nasdaq is sitting below a strong resistance zone; price appears to be weakening, which increases the probability of a short-term pullback toward the Previous Day Low (PDL) to collect more liquidity before any further upside attempt.
Momentum indicators and price structure suggest caution: while the general uptrend remains, a lack of upward acceleration and signs of hesitation point toward a possible consolidation or retracement.
🌍 Fundamental & Macro Context
Optimism remains in markets thanks to rising investor expectations of a rate cut by the Federal Reserve (Fed) this December. This sentiment supports risk assets, and tech stocks in particular — historically sensitive to interest rates and discounting future earnings.
However, some analysts warn that valuations in the tech sector — which heavily influence Nasdaq — are rich relative to earnings. The forward P/E ratio sits well above long-term averages, increasing vulnerability if economic data disappoints or if rate cuts are delayed.
Broader macro conditions remain fragile: global yield curves and bond markets show signs of stress, which could add volatility. Also, inflation trends and upcoming U.S. data releases could shift sentiment quickly.
🎯 What to Watch Next
Pullback zone: Look for support near the PDL or recent liquidity area — potential buying zone if price stabilizes.
Breakout zone: If Nasdaq breaks above resistance with strength and volume, upside is open toward higher targets set pre-rally.
Catalysts: Fed rate-cut expectations, upcoming economic data (inflation, employment, PMI), and tech sector earnings will influence direction strongly.
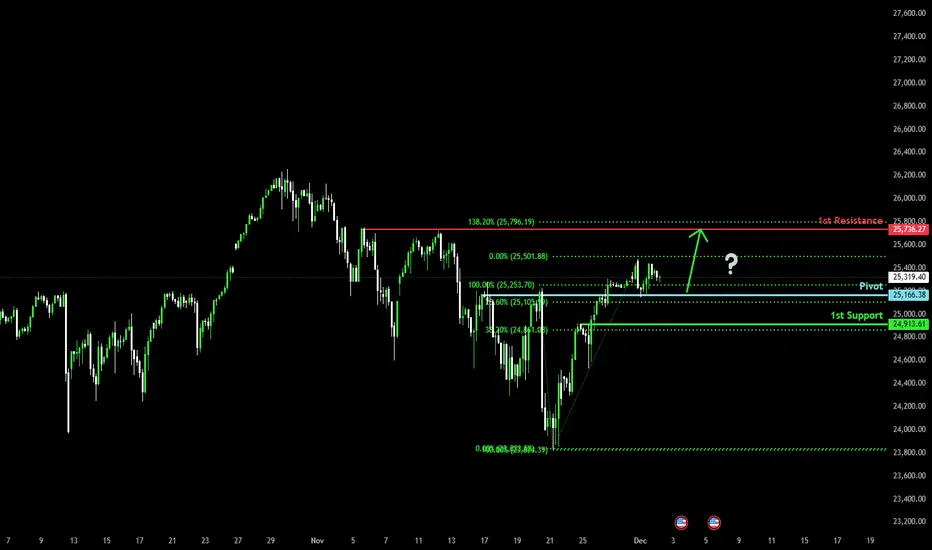
Bullish continuation setup?USTEC has bounced off the pivot and could potentially rise to the 1st resistance.
Pivot: 25,166.38
1st Support: 24,913.61
1st Resistance: 25,736.27
Disclaimer:
The opinions given above constitute general market commentary and do not constitute the opinion or advice of IC Markets or any form of personal or investment advice.
Any opinions, news, research, analyses, prices, other information, or links to third-party sites contained on this website are provided on an "as-is" basis, are intended to be informative only, and are not advice, a recommendation, research, a record of our trading prices, an offer of, or solicitation for, a transaction in any financial instrument and thus should not be treated as such. The information provided does not involve any specific investment objectives, financial situation, or needs of any specific person who may receive it. Please be aware that past performance is not a reliable indicator of future performance and/or results. Past performance or forward-looking scenarios based upon the reasonable beliefs of the third-party provider are not a guarantee of future performance. Actual results may differ materially from those anticipated in forward-looking or past performance statements. IC Markets makes no representation or warranty and assumes no liability as to the accuracy or completeness of the information provided, nor any loss arising from any investment based on a recommendation, forecast, or any information supplied by any third party.
Sell Nass100Price rejected strongly from the upper supply zone and slipped back below it. As long as price stays under that zone, bears stay in control. I’m expecting a deeper correction toward the demand zone around 24 690 – 24 700.
Bias: Bearish
Entry Zone: Below the broken supply
Target: 24 700
Invalidation: Break and hold above the supply zone

Buys or Sells1)Bullish Trend
2)Break of Structure
3)Above 50Moving Average.
I see a bullish start of the week for most markets, but very well could go to the downside to continue a very uncharacteristic 4th quarter. I believe fundamentals will play a huge part in trading decisions through the holiday season for most traders. I'm thinking about not trading at all the market is looking choppy.

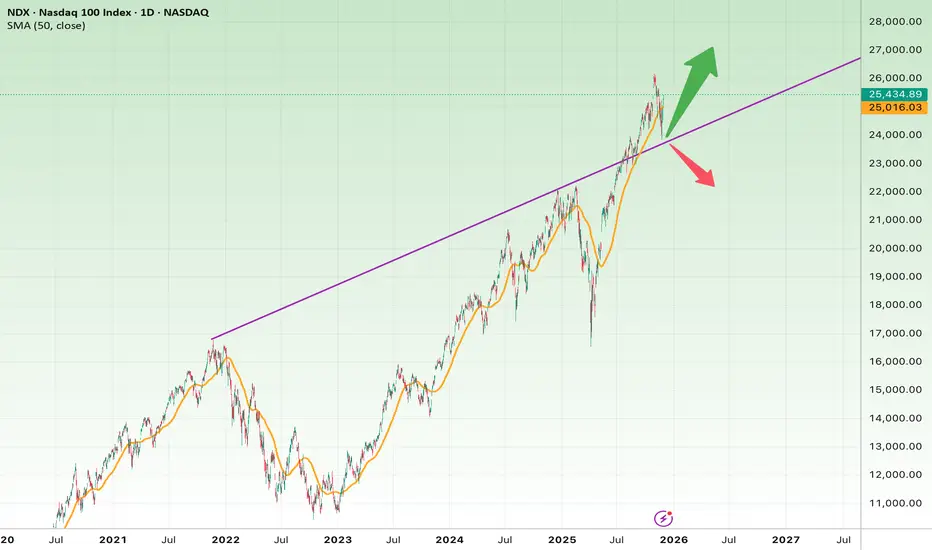
Nasdaq 100 (NDX) – Daily Chart AnalysisThe chart shows that the Nasdaq 100 has been in a strong multi-year uptrend from 2023 to 2025 and is now touching a major long-term ascending trendline (purple line).
This is one of the most critical decision zones for the index.
Bullish Scenario (More Likely at the Moment)
Price is currently holding above the long-term trendline and is also trading above the SMA50 (orange line), which still has a positive upward slope.
If the price continues to respect this trendline:
Bullish Targets
• 26,600
• 27,200
• 28,000 (major upside target)
Signals that strengthen the bullish case:
• A breakout above the previous high near 25,900–26,000
• Strong closing candles above the trendline
• Increasing bullish volume
Bearish Scenario (If the Trendline Breaks)
If the index breaks below the ascending trendline and then loses the SMA50, it could enter a broader corrective phase.
Bearish Targets
• 23,800 – first major support
• 22,500
• 20,800 – key structural support
Bearish confirmation signs:
• A strong breakdown candle below the trendline
• Failure to reclaim the SMA50
• Weak or failed retest (pullback) of the broken trendline
Logical Stop-Loss Zones
• Long positions: Below 24,600
• Short positions: Above 25,900
Quick Summary
• NDX is sitting right on a major long-term trendline.
• Bullish scenario remains stronger as long as the trendline holds.
• Breaking the trendline would likely trigger a deeper correction.
• Holding above it could push price toward 27K–28K.

2 DEC 2025: US100 MARKET RECAPJUST JOURNALLING
DISCLAIMER:
The owner of this page is an authorised Representative under supervision of TD MARKETS (PTY) LTD, an authorised Financial Services Provider (FSP No. 49128) licensed by the Financial Sector Conduct Authority (FSCA) under the Financial Advisory and Intermediary Services Act (FAIS).
The FSP is licensed to provide advice and intermediary services in respect of Category I financial products, including but not limited to derivative instruments, long-term deposits, and short-term deposits.
All investment ideas are provided in accordance with the scope of the FSP's license and applicable regulatory requirements. Derivative instruments is a leveraged products that carry high risks and could result in losing all of your capital, and past performance is not indicative of future results.
This idea and any attachments are informational/education and does not constitute a recommendation to buy/sell.
No guarantee is made regarding the accuracy or outcome of this trade idea.
If you choose to accept this idea, please do so at your own risk.

Nasdaq 100 Ahead of the HolidaysNasdaq 100 Ahead of the Holidays
As the chart shows, the Nasdaq 100 has rebounded from its roughly 2.5-month low recorded on 21 November. At that point, bearish sentiment was driven by fears of an “AI bubble”, expectations of higher interest rates, and other news-related pressures.
The recovery from that level was strong — in less than a week the index gained around 5.3%, signalling robust demand. This not only offsets last week’s concerns but also injects optimism into the near-term outlook.
Technical Analysis of the Nasdaq 100 Chart
Examining recent price action in the Nasdaq 100, we can outline an ascending channel in which:
→ the median line acted as support until mid-November;
→ support at the lower boundary helped form the 21 November low.
From the perspective of buying pressure:
→ The November dip appears to be an intermediate correction within a broader emerging uptrend.
→ The brief move below the psychological 24k level (where the notable September and October lows lie) resembles a Liquidity Grab pattern, suggesting so-called Smart Money may have used sellers’ liquidity to build long positions — a sign of bullish intent.
From the perspective of selling pressure:
→ the market remains within a corrective structure (highlighted in red);
→ today, the Nasdaq 100 is trading near 25,265, a level that acted as resistance on 17–20 November.
It is possible that trading near the channel’s median line will encourage a balance between buying and selling forces — just as market participants head off to celebrate Thanksgiving.
This article represents the opinion of the Companies operating under the FXOpen brand only. It is not to be construed as an offer, solicitation, or recommendation with respect to products and services provided by the Companies operating under the FXOpen brand, nor is it to be considered financial advice.

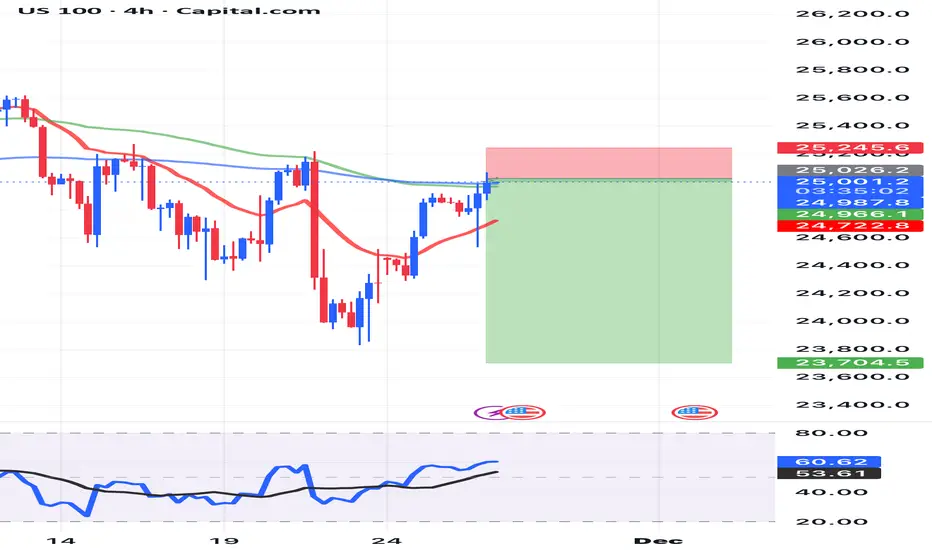
NAS100 H4 | Bearish Reversal Off Key ResistanceMomentum: Bearish
Price is showing rejection from the sell zone, which aligns with the 78.6% Fibonacci retracement level. The market remains below the descending trendline, supporting a bearish continuation bias.
Sell Entry: 24,926.07
Overlap resistance
78.6% Fibonacci confluence
Stop Loss: 25,314.56
Positioned above pullback resistance
Take Profit: 24,447.49
Pullback support zone
High Risk Investment Warning
Stratos Markets Limited (tradu.com ), Stratos Europe Ltd (tradu.com ):
CFDs are complex instruments and come with a high risk of losing money rapidly due to leverage. 70% of retail investor accounts lose money when trading CFDs with this provider. You should consider whether you understand how CFDs work and whether you can afford to take the high risk of losing your money.
Stratos Global LLC (tradu.com ): Losses can exceed deposits.
Please be advised that the information presented on TradingView is provided to Tradu (‘Company’, ‘we’) by a third-party provider (‘TFA Global Pte Ltd’). Please be reminded that you are solely responsible for the trading decisions on your account. Any information and/or content is intended entirely for research, educational and informational purposes only and does not constitute investment or consultation advice or investment strategy. The information is not tailored to the investment needs of any specific person and therefore does not involve a consideration of any of the investment objectives, financial situation or needs of any viewer that may receive it. Past performance is not a reliable indicator of future results. Actual results may differ materially from those anticipated in forward-looking or past performance statements. We assume no liability as to the accuracy or completeness of any of the information and/or content provided herein and the Company cannot be held responsible for any omission, mistake nor for any loss or damage including without limitation to any loss of profit which may arise from reliance on any information supplied by TFA Global Pte Ltd.

NAS100How to become successful in forex and stock trading: 1.Master fundamentals and technical analysis. 2,Build and follow a solid trading plan. 3.Apply strict risk management (1–2% rule). 4.Stay disciplined—control fear and greed. 5.Record and analyze every trade. 6.Focus on high-quality setups only. 7.Diversify across assets and markets. 8.Keep evolving—study, adapt, and grow daily.
NDX - 92% From ZeroI want you to always remember one thing:
Wherever the price goes, it’s always 100% from zero.
That’s why every now and then you need to take the chart off log and look at it with fresh eyes.
Occam’s razor.
I keep hearing the PERMA-BULL crowd screaming that “the bears are calling this an AI bubble,” and in the same breath whining that the pullback is “overdone” or “extreme.”
Really?
The S&P is down 5%, and they’re already crying about the bears?
SMH.
It’s all strawman nonsense. Don’t fall for it.
Take it off log…
Remember everything is 100% from zero…
Use your basic, instinctive judgment…
And then ask yourself what your eyes are telling you when you look at this chart.
That’s the truth — not the narratives.
THANK YOU for getting me to 5,000 followers! 🙏🔥
Let’s keep climbing.
If you enjoy the work:
👉 Boost
👉 Follow
👉 Drop a solid comment
Let’s push it to 6,000 and keep building a community grounded in truth, not hype.
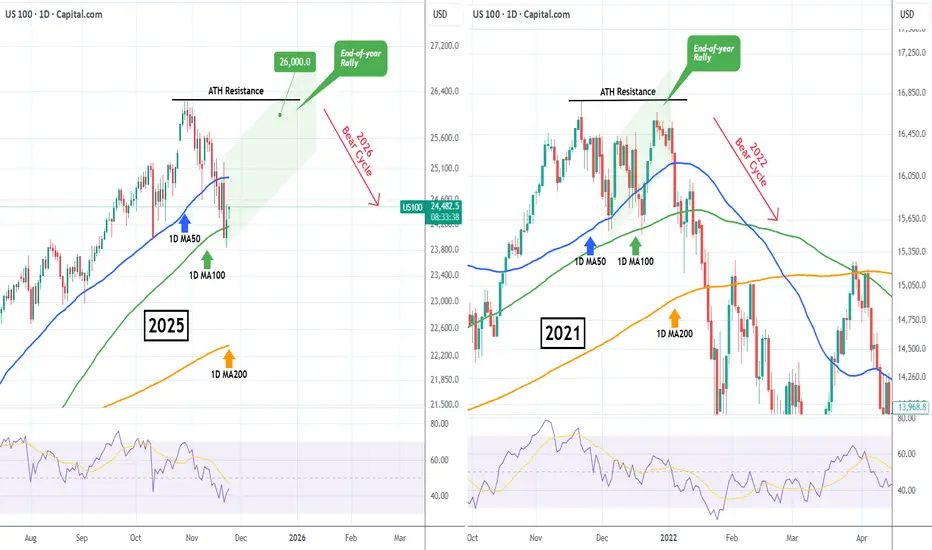
NASDAQ Santa Rally back to 26000 started?Nasdaq (NDX) rebounded on Friday after marginally breaching below its 1D MA100 (green trend-line) for the first time since May 09! The continuation today is a sign of a potentially strong rebound, the traditional end-of-year rally that is know as 'Santa's rally'.
Based on the 2021 Bull Cycle, which after touching its own 1D MA100 it started a final rally that almost tested its ATH Resistance, we can expect Nasdaq to now rise towards the end of the year to potentially 26000.
Could this be the last rally before a new Bear Cycle in 2026?
---
** Please LIKE 👍, FOLLOW ✅, SHARE 🙌 and COMMENT ✍ if you enjoy this idea! Also share your ideas and charts in the comments section below! This is best way to keep it relevant, support us, keep the content here free and allow the idea to reach as many people as possible. **
---
💸💸💸💸💸💸
👇 👇 👇 👇 👇 👇
NAS100 Trade Opportunity: Will Buyers Defend the Pullback?📊 NAS100 (NASDAQ-100) Swing Trade Opportunity 🚀
Bullish Pullback Setup | Super Trend ATR + TMA Confirmation
🎯 TRADE SETUP OVERVIEW
Instrument: NAS100 (NASDAQ-100 Index)
Timeframe: Swing Trade (4H-Daily)
Bias: BULLISH ✅
Setup Type: Super Trend ATR Line Pullback + Triangular Moving Average (TMA) Confirmation
🎬 ENTRY STRATEGY - "LAYERING METHOD" 📍
This strategy employs multiple limit order placement (Layer Entry Technique) to optimize entry points during the pullback phase.
Recommended Layer Entry Points:
🔵 Layer 1: 24,500
🔵 Layer 2: 24,600
🔵 Layer 3: 24,700
🔵 Layer 4: 24,800
⚡ Pro Tip: Scale layers based on your account size and risk tolerance. Each layer reduces average entry price.
🛑 STOP LOSS (SL)
Primary SL Level: 24,300
Strategy: Placed below the latest swing low + Super Trend confirmation
⚠️ DISCLAIMER: This SL is a guideline only. You must adjust based on your personal risk management strategy and account equity. Risk is YOUR responsibility.
🎁 PROFIT TARGETS (TP)
PRIMARY TARGET (TP1): 25,700 🎯
First resistance zone
Ideal for taking partial profits
Recommended exit: 30-50% position
SECONDARY TARGET (TP2): 26,200 🔥
Strong resistance + Historical overbought zone
⚠️ TRAP ALERT: Expect potential reversal or consolidation
Recommended exit: Remaining 50-70% position
Use trailing stop for final portion
📈 TECHNICAL CONFIRMATION
✅ Super Trend ATR: Aligned bullish
✅ TMA (Triangular MA): Pullback to key level confirmed
✅ Higher Lows Pattern: Intact
✅ Volume Analysis: Supporting move
🔗 RELATED PAIRS TO WATCH 💡
Positive Correlation (Move Together):
🔴 SPY (S&P 500 ETF) - $380-395 Range
Correlation: +0.92 | Often leads NAS100 lower-cap stocks
Key Point: If SPY breaks $390, expect NAS100 momentum confirmation
Watch for divergence signals
🔴 QQQ (Invesco QQQ Trust - Nasdaq 100 ETF) - $450-470 Range
Correlation: +0.99 | DIRECT tracking of NAS100
Key Point: Primary barometer for Nasdaq sentiment
Use for volume + volatility confirmation
🔴 TECH Sector ETF (XLK) - $205-215 Range
Correlation: +0.88 | Tech-heavy holdings overlap
Key Point: Tech rotation affects Nasdaq flow
Monitor for sector strength/weakness
Inverse Correlation (Move Opposite):
🔵 DXY (US Dollar Index) - $103-106 Range
Correlation: -0.65 | Stronger dollar = Risk-off mood
Key Point: If DXY spikes, expect NAS100 pullback extension
Monitor Fed rate expectations
🔵 TLT (20+ Year Treasury ETF) - $75-80 Range
Correlation: -0.58 | Rising yields hurt growth stocks
Key Point: Check 10Y yield trend for rate pressure
Watch Fed policy announcements
Key Monitoring Points:
📌 Earnings Season Impact: Tech earnings can create ±2% moves
📌 Fed Minutes/Announcements: Watch for rate guidance changes
📌 Market Breadth: Compare Advance/Decline lines for confirmation
📌 Volatility Index (VIX): Levels above 20 = Caution; Below 15 = Risk-on
📋 BEFORE YOU TRADE - CHECKLIST ✅
Is price currently at/near Layer 1 entry (24,500)?
Does current 4H chart show TMA pullback + Super Trend confluence?
Is volume confirming the setup?
Have you set your SL below 24,300?
Do you understand you're risking X to make Y?
Is this aligned with your trading plan?
🎓 FINAL NOTES
This is a mechanical swing trade setup designed for traders who use limit orders and layering technique. The confluence of Super Trend ATR + TMA creates higher probability entries during bullish pullbacks.
Remember: Trading involves substantial risk of loss. This idea is shared for educational analysis. Your trading decisions are YOUR responsibility alone.
Happy Trading! 🚀💎

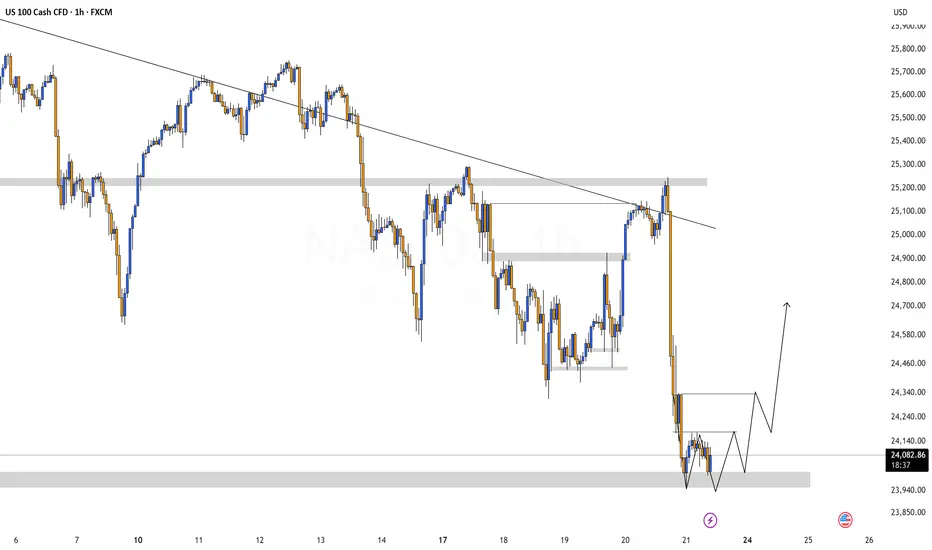
NASDAQ Analysis – Recovery Expected After an Overextended DropYesterday’s sharp Nasdaq drop was surprising, especially considering Nvidia’s exceptional earnings, renewed confidence that we’re not in a bubble, and the strong labor data from NFP. Under normal conditions, the market would likely have reacted with a 2%+ rally.
However, investors are now pricing in the idea that the Fed will not cut rates in December, which created fear-driven selling and an exaggerated move to the downside.
Today, I would like to see a relief recovery, as the index has started to form a double-bottom pattern, a typical structure before liquidity grabs to the upside. If confirmed, price could push back up to take out recent highs.
Historically, after large impulsive drops, the stock market tends to open in green, as investors take advantage of discounted prices. If momentum shifts, the Nasdaq could quickly reclaim lost ground.