CADCHFPairs going against CHF are looking bullish. In this instance, this pair has broken the resistance area of 0.57500 and came back for a possible retest.
Trade ideas

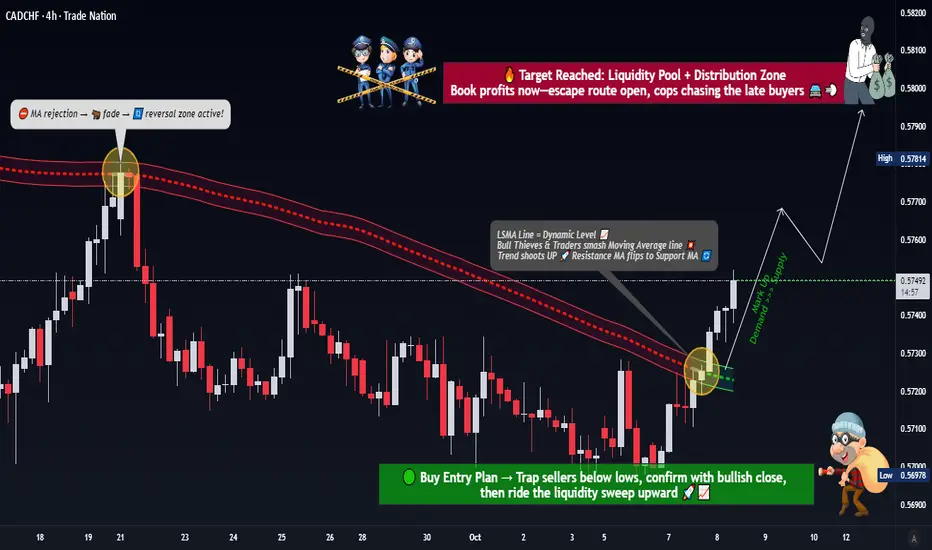
Is This the Start of a Momentum Shift for CAD/CHF Bulls?🎯 CADCHF: The Great Swiss Bank Heist! 🏦💰
📊 Market Overview: Loonie vs Swiss Showdown
Pair: CAD/CHF (The Maple Leaf meets the Alpine Fortress)
Strategy Type: Swing/Day Trade | Metals Market Cash Flow Management
Bias: 🐂 BULLISH (Confirmed with Accumulation + LSMA Breakout)
Trade Style: The "Thief Strategy" - Ocean's Eleven meets Wall Street 🎭
🎬 The Setup: Planning the Perfect Heist
We've spotted a golden opportunity in CADCHF! The accumulation phase is complete, and the Least Squares Moving Average (LSMA) has broken out like a master thief slipping through laser security systems. The Swiss vault is looking vulnerable, and the Loonie is ready to make its move! 🍁💨
Why This Setup? Metals market correlations are aligning beautifully with this pair, creating a cash flow momentum we can't ignore. The technical confluence is stronger than a bank vault door... but we've got the code! 😎
💼 The Heist Plan: Entry Strategy
🎯 "The Layering Method" - Multiple Entry Points
Instead of going all-in at one price (rookie mistake!), we're using multiple limit orders like a professional crew positioning themselves at different access points:
Recommended Layer Entries:
🥉 Layer 1: 0.57200 (The Ground Floor)
🥈 Layer 2: 0.57300 (The Mezzanine)
🥇 Layer 3: 0.57400 (VIP Access)
Flexibility Note: You can add MORE layers based on your account size and risk appetite. Scale in gradually - this isn't a smash-and-grab; it's a calculated operation! 🧠
Entry Philosophy: Any price level within the zone works, but layering gives you dollar-cost averaging benefits and reduces emotional decision-making.
🛡️ Risk Management: Don't Get Caught!
🚨 Stop Loss (Emergency Exit Plan)
Thief's SL: 0.57000
⚠️ IMPORTANT DISCLAIMER: This is MY stop loss based on technical invalidation levels. YOU should set YOUR OWN stop loss based on:
Your risk tolerance (1-2% of account recommended)
Your position size
Your account equity
Your sleep-at-night comfort level
Risk Management = Freedom. Don't let one trade blow up your account! 🎰❌
🎯 Target Zone: The Getaway Plan
🏦 Take Profit Target: 0.58000
Why This Level?
This is where the "Police Barricade" sits - a strong resistance zone with multiple technical factors:
Historical resistance area
Potential overbought conditions forming
Classic bull trap territory
The Pro Move: As we approach 0.58000, consider:
Taking 50% profits at 0.57800
Moving stop loss to breakeven
Letting remaining position run with trailing stop
GET OUT BEFORE THE TRAP CLOSES! 🚓
📢 CRITICAL NOTE: This is MY target based on risk/reward analysis. YOU should take profits when YOU feel comfortable. No one ever went broke taking profits! Lock in those gains and live to trade another day, Thief OGs! 💎🙌
🌍 Correlated Pairs to Watch (Global Context)
Related Opportunities:
OANDA:USDCHF - The big brother move (inverse correlation)
OANDA:EURCHF - European cousin in the Swiss franc family
OANDA:XAUUSD (Gold) - Metals correlation play! 🥇
OANDA:XAGUSD (Silver) - Industrial metals momentum 🥈
Crude Oil ( BLACKBULL:WTI ) - Canadian dollar's best friend (CAD is oil-sensitive) 🛢️
Why These Matter?
CAD strength = Rising commodity prices (especially oil & metals)
CHF weakness = Risk-on sentiment in markets
When Gold & Oil rally together, CAD typically follows. Watch these correlations for confirmation! 🔗
🔑 Key Technical Points
✅ LSMA Breakout Confirmed - Momentum is building
✅ Accumulation Phase Complete - Smart money is positioned
✅ Higher Lows Forming - Bullish market structure
✅ Volume Supporting Move - Not a fake breakout
✅ Metals Market Tailwinds - Macro environment favorable
🎓 Trading Psychology Corner
For the Thief OGs out there:
⏳ Patience is your superpower - don't force trades
📏 Position sizing > being right - manage risk first
🎯 Plan your trade, trade your plan - no improvising mid-heist!
💰 Take profits like a pro - greed is the enemy
🧘 Stay emotionless - this is business, not personal
🎬 Final Word from Your Friendly Neighborhood Thief
Remember, the best traders are the ones who live to trade another day. We're not here to hit home runs every time - we're here to stack consistent singles and doubles. This CADCHF setup looks promising, but the market always has the final say.
Stay sharp, stay disciplined, and may the pips be ever in your favor! 🎯
Good luck out there, Thief OGs! Let's make this heist count! 🏦💰🚀
✨ If you find value in my analysis, a 👍 and 🚀 boost is much appreciated — it helps me share more setups with the community!
#CADCHF #ForexTrading #SwingTrading #DayTrading #TechnicalAnalysis #PriceAction #ForexSignals #TradingStrategy #RiskManagement #LSMA #BullishSetup #ForexEducation #TradingCommunity #MetalsMarket #CommodityCorrelation #CAD #CHF #ForexIdeas #TradingView #ChartAnalysis #ForexLife #ThiefStrategy
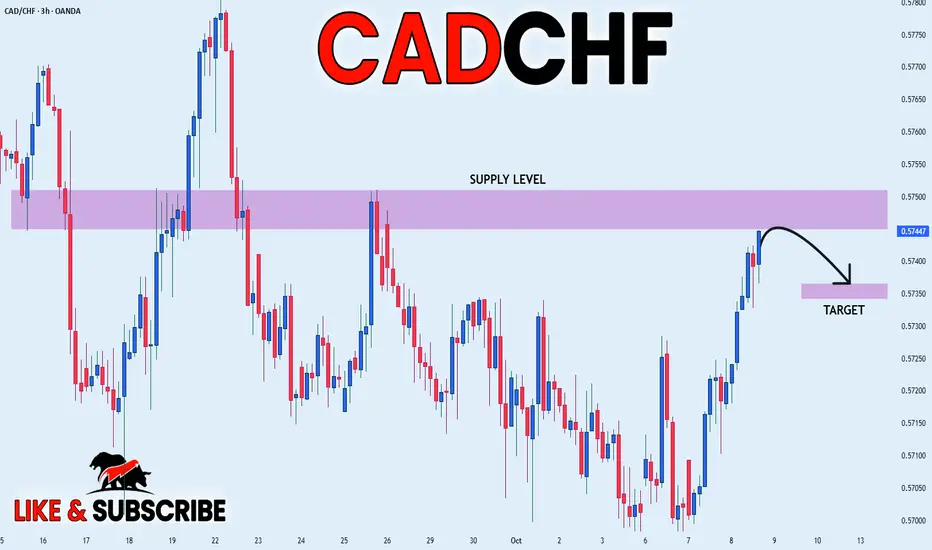
CADCHF SHORT FROM SUPPLY LEVEL|
✅CADCHF is about to retest the supply zone where price previously distributed. Liquidity above equal highs has been engineered, suggesting Smart Money may reprice lower once the zone is mitigated. Time Frame 3H.
SHORT🔥
✅Like and subscribe to never miss a new idea!✅
CAD/CHF SHORT FROM RESISTANCE
Hello, Friends!
Bearish trend on CAD/CHF, defined by the red colour of the last week candle combined with the fact the pair is overbought based on the BB upper band proximity, makes me expect a bearish rebound from the resistance line above and a retest of the local target below at 0.570.
Disclosure: I am part of Trade Nation's Influencer program and receive a monthly fee for using their TradingView charts in my analysis.
✅LIKE AND COMMENT MY IDEAS✅

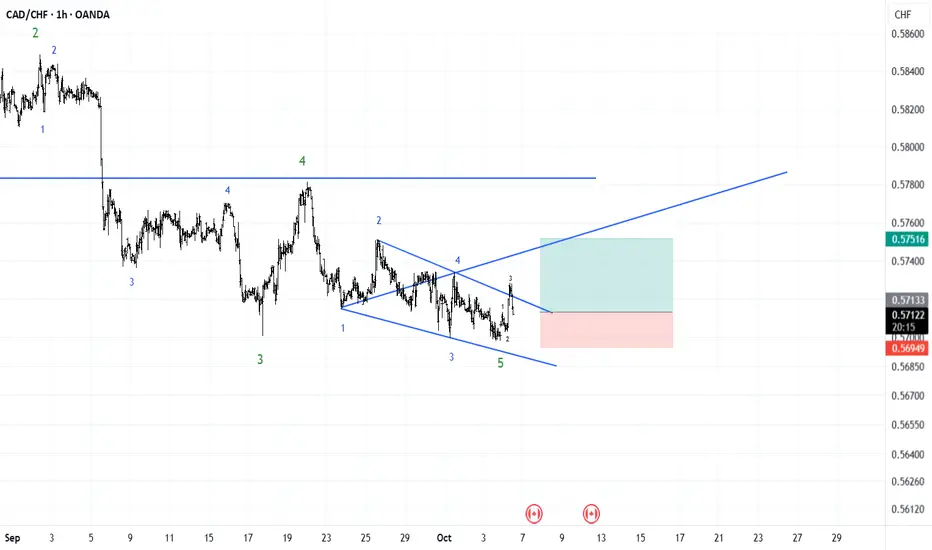
Elliott Wave Analysis – CADCHF (1H)It appears that an Ending Diagonal pattern has formed at the end of the bearish trend on CADCHF (1-hour timeframe), indicating a potential trend reversal and the beginning of a new bullish phase.
In the current upward structure, waves 1 to 3 have already completed, and the market is now in the corrective wave 4.
If wave 4 aligns (fits) with wave 1, it could offer a great buying opportunity (long setup).
📈 A breakout above the top of wave 3, along with increasing volume, would provide confirmation for the continuation of the bullish trend.
Possible bullish outlook on can cutPrevious bullish liquidity that was engineered has been taken out, would be watching to see a bullish run on cadchf


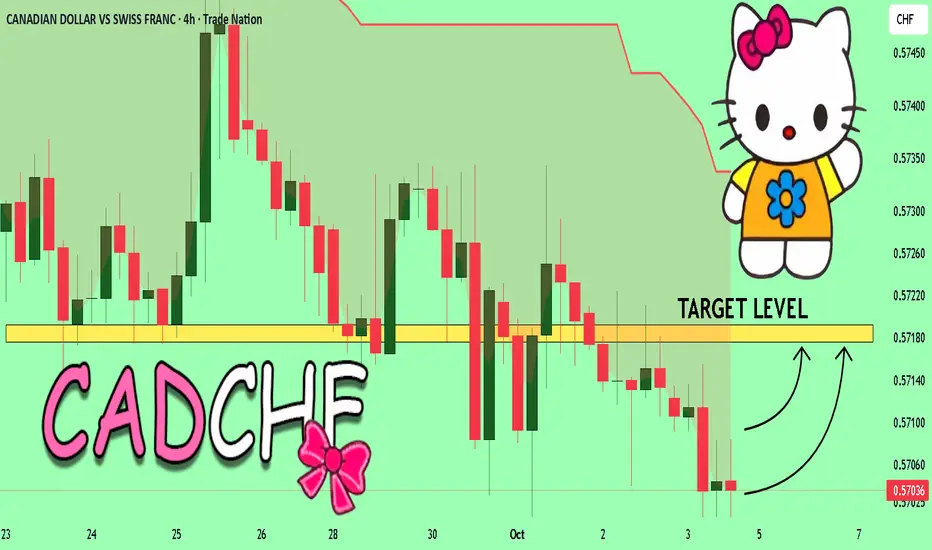
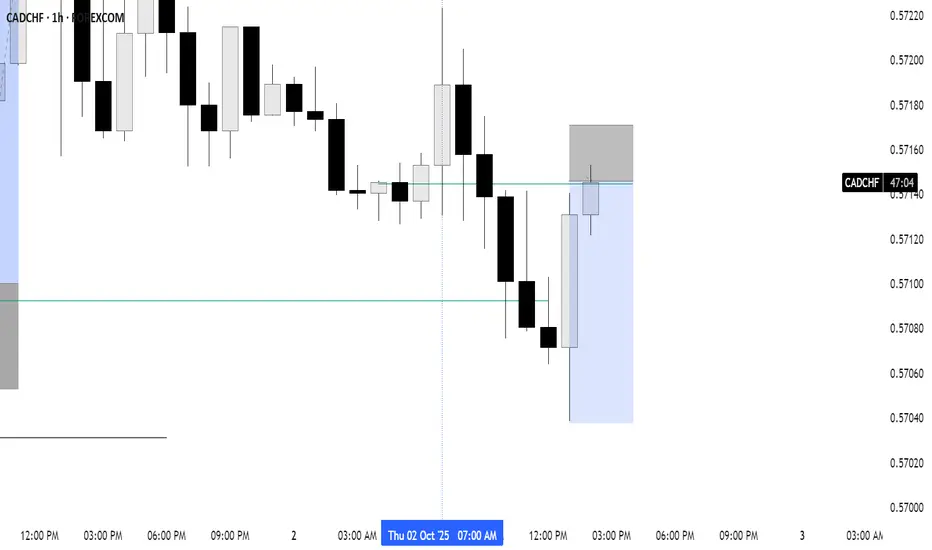
CADCHF My Opinion! BUY!
My dear subscribers,
This is my opinion on the CADCHF next move:
The instrument tests an important psychological level 0.5705
Bias - Bullish
Technical Indicators: Supper Trend gives a precise Bullish signal, while Pivot Point HL predicts price changes and potential reversals in the market.
Target - 0.5717
About Used Indicators:
On the subsequent day, trading above the pivot point is thought to indicate ongoing bullish sentiment, while trading below the pivot point indicates bearish sentiment.
Disclosure: I am part of Trade Nation's Influencer program and receive a monthly fee for using their TradingView charts in my analysis.
———————————
WISH YOU ALL LUCK
CADCHF Sell Setup CADCHF Sell Setup - price action reacted from a bullish support and resistance level, but failed to follow through, so we need to trade against it, therefore we have a QM SnR level price is rejecting from.
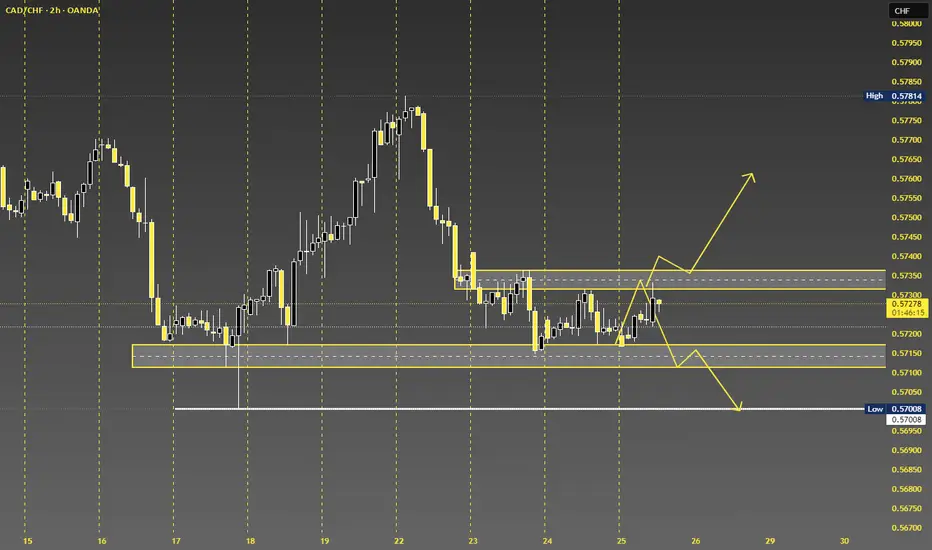
Range Theory - Daily Chart - CADCHFTrading via ranges through daily chart.
Looking for a fall/rise at price, checking the consolidation area which defines the stop levels as chart shows.
CADCHF - BUY - RR: 6:1Price is currently at a HUGE H4 demand zone with a lot of sell orders trapped, an enormous amount of liquidity from both Daily and Weekly timeframe.
BUY NOW with TP and SL as published!
CADCHF Rally Meets Resistance, Bears Eye Fresh DownsideCADCHF has recovered into resistance near the 0.5770 zone after an aggressive drop earlier in September. The bounce looks corrective rather than structural, and the broader downtrend remains intact. With Canada facing stagflation risks and Switzerland maintaining low but stable inflation, the franc’s safe-haven demand keeps pressure on CAD.
Current Bias
Bearish – recent strength appears corrective; sellers are likely to re-engage below resistance.
Key Fundamental Drivers
Bank of Canada: Rate cut expectations are rising after soft GDP and weak labor data, weighing on CAD.
Swiss National Bank (SNB): Steady policy with inflation under control keeps CHF stable.
Oil Prices: Weak oil performance undermines CAD, given Canada’s reliance on energy exports.
Macro Context
Interest Rates: BoC is tilting dovish, while the SNB holds steady. Divergence favors CHF strength.
Growth Trends: Canadian economy shows stagnation risks; Switzerland remains resilient with moderate growth.
Commodity Flows: Oil remains a drag on CAD, with geopolitical headlines adding volatility.
Geopolitics: CHF demand often spikes during global risk-off events, while CAD suffers in those conditions.
Primary Risk to the Trend
A sharp rebound in oil prices or stronger-than-expected Canadian economic data could give CAD relief and weaken the bearish case.
Most Critical Upcoming News/Event
Canada GDP and inflation data
SNB commentary on currency strength
Global energy headlines affecting oil prices
Leader/Lagger Dynamics
CADCHF is generally a lagger, reflecting moves in oil and broader CHF sentiment. Watch oil for CAD momentum and EURCHF for CHF direction.
Key Levels
Support Levels: 0.5736, 0.5701
Resistance Levels: 0.5776, 0.5816
Stop Loss (SL): 0.5816 (above key resistance)
Take Profit (TP): 0.5736 (first target), 0.5701 (secondary target)
Summary: Bias and Watchpoints
CADCHF holds a bearish bias with the recovery stalling at 0.5770. The broader fundamental backdrop favors CHF as BoC shifts dovish and oil remains under pressure. A stop loss above 0.5816 helps protect against false breakouts, while profit-taking targets are set at 0.5736 and 0.5701. This pair is more of a lagger, following oil and CHF flows, so traders should stay alert to energy headlines and safe-haven demand.

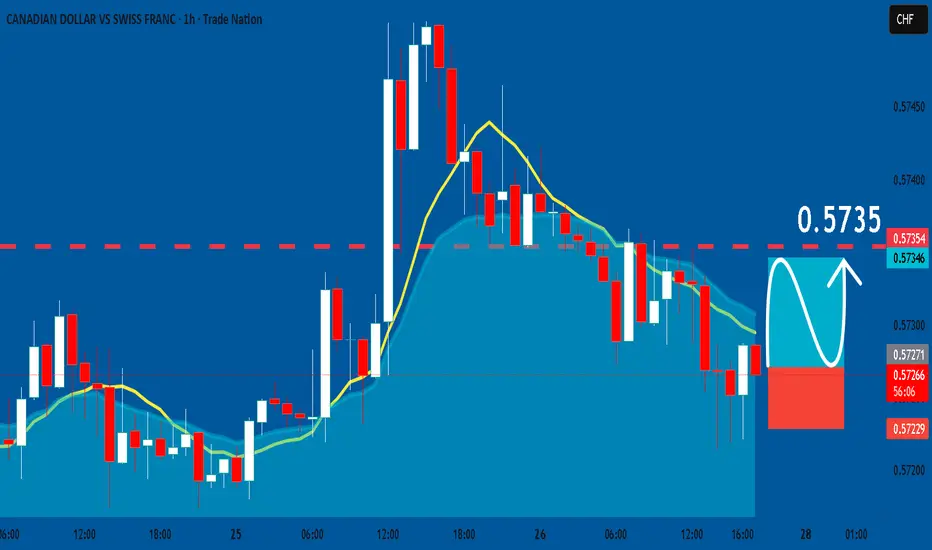
CADCHF: Long Signal Explained
CADCHF
- Classic bullish setup
- Our team expects bullish continuation
SUGGESTED TRADE:
Swing Trade
Long CADCHF
Entry Point - 0.5727
Stop Loss - 0.5722
Take Profit - 0.5735
Our Risk - 1%
Start protection of your profits from lower levels
Disclosure: I am part of Trade Nation's Influencer program and receive a monthly fee for using their TradingView charts in my analysis.
❤️ Please, support our work with like & comment! ❤️
CADCHF: Rate differential and oil sensitivity short.CADCHF: Rate differential and oil sensitivity short.
Summary
Bias is short CAD against CHF. Canada’s growth is softer and more rate sensitive, with inflation nearer target and a central bank that is further along an easing path. Switzerland’s inflation is lower and stable, with policy calibrated and the currency retaining safe-haven characteristics. The mix favors CHF over CAD, especially if global growth or commodities wobble.
Macro Overview
Growth and inflation: Canada shows slower activity and disinflation toward target. Switzerland remains low-inflation with steady domestic demand.
Implication: Relative yields and macro resilience favor CHF when risk appetite is fragile or commodity momentum fades.
Monetary and Fiscal Policy
BoC vs SNB: BoC guidance is more dovish given weaker growth. SNB policy is measured and inflation remains contained.
Rate differentials: Front-end spreads are prone to narrow against CAD on weak Canadian data or risk-off, supporting CHF.
Geopolitical and Structural Risks
Oil sensitivity: CAD is leveraged to crude. Sustained oil strength aids CAD, while range-bound or softer oil weighs on CAD.
Risk regime: CHF tends to benefit in risk-off episodes and periods of tighter global financial conditions.
Market Impact Assessment
Drivers: Short-end spreads, oil trend, and risk sentiment.
Flows: In slower global growth, safe-haven demand and lower beta work in CHF’s favor.
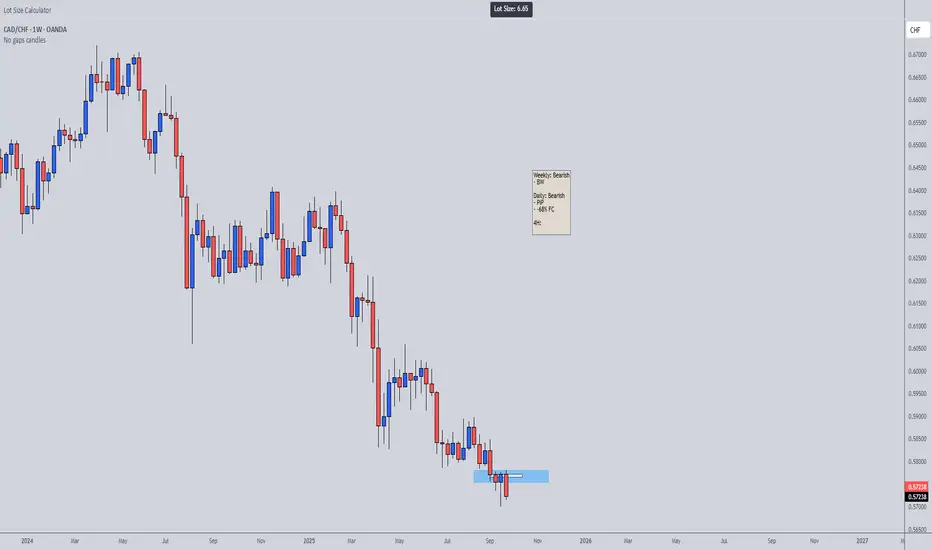
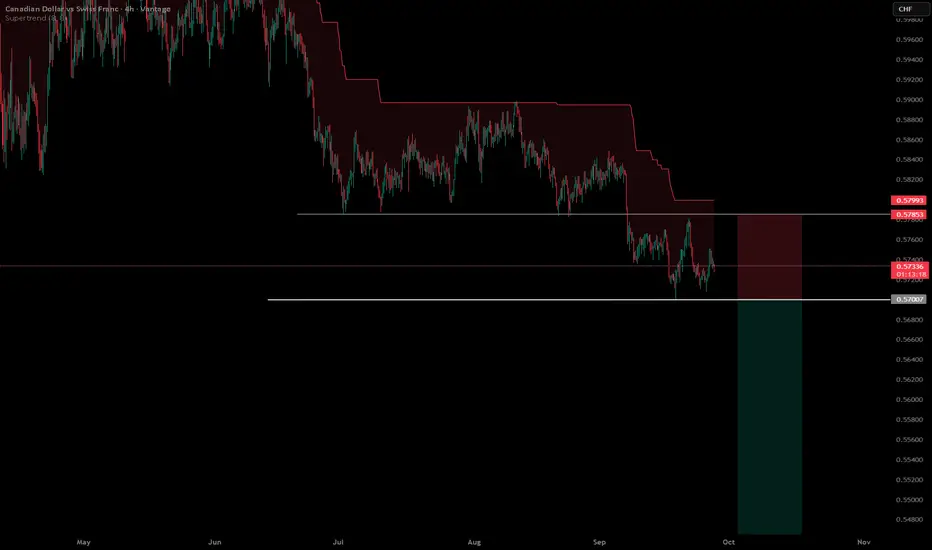
CADCHF — Trade Idea
Management — ATR trailing, no fixed targets
Timeframe: 4h ATR period: 8 Multiplier: 8 Update: at the daily close only.
At entry (short): ATR stop = day’s high + 8 × ATR(8). If this sits above your hard stop, cap it at the hard stop.
Each day: new stop = min(previous stop, today’s high + 8 × ATR(8)). Never loosen.
Exit: Close the position on a daily close above the trailing stop.
Event mode: Before major Canada or Switzerland releases or central-bank decisions, if in profit, tighten to max(breakeven, current ATR stop). Resume normal trailing after the event day’s close.
Reference levels from chart: swing high area 0.57812–0.57907; base/break level 0.56999; measured extension checkpoint around 0.55945.
CADCHF — Potential Invalidation/Shift Triggers (Next 8–10 Weeks)
October 2025
Thu 2 Oct — Switzerland CPI (m/m, y/y)
A firm print supports CHF; a soft print weakens the short-CAD/long-CHF view.
Fri 3 Oct — Canada Employment (jobs, unemployment rate)
Strong jobs could lift CAD; weak data support the short.
Tue 21 Oct — Canada CPI suite (headline and core measures)
Hot inflation risks a less-dovish BoC path and CAD squeeze.
Wed 29 Oct — Bank of Canada rate decision, statement, press conference
Hawkish guidance supports CAD; dovish follow-through supports the short.
Thu 30 Oct — Switzerland KOF Leading Indicator
Upside strengthens CHF; downside softens it.
Fri 31 Oct — Canada GDP m/m
Stronger growth aids CAD; weak print supports the short.
November 2025
Tue 4 Nov — Switzerland CPI (m/m, y/y)
Re-acceleration would be CHF-positive; disinflation would ease CHF support.
Fri 7 Nov — Canada Employment
Another strong jobs print could pressure shorts; softening supports them.
Tue 18 Nov — Canada CPI suite
A hotter run of inflation would slow BoC easing and favor CAD.
Fri 28 Nov — Switzerland KOF Leading Indicator and Q3 GDP (approx. window)
Better Swiss growth data would reinforce CHF support.
How to use this list
- Primary invalidation themes: CAD bullish shocks from Canadian CPI, jobs, GDP, or a hawkish BoC pivot; CHF-negative shocks from softer Swiss CPI or weaker Swiss growth.
- Protocol: Tighten risk into these releases; reassess the short if outcomes narrow the CAD–CHF policy gap or materially improve Canada’s growth outlook.
Reassessment Triggers
- Canadian activity or inflation re-accelerates enough to slow BoC easing.
- A durable rise in oil materially improves Canada’s terms of trade.
- A clear shift in SNB communication that meaningfully weakens CHF support.
Finishing statement
Maintain a short bias while the Canada–Switzerland policy differential trends against CAD, oil lacks a sustained uptrend, and global growth or risk appetite remains fragile. Reassess if Canadian data firm and BoC easing expectations fade, if oil enters a durable bullish regime, or if SNB guidance turns more accommodative in a way that reduces CHF support.
Risk Warning
This material is educational research only and does not constitute financial advice, investment recommendation, or a solicitation to buy or sell any instrument. Foreign exchange and CFDs are complex, leveraged products that carry a high risk of rapid losses; leverage amplifies both gains and losses, and you should not trade with funds you cannot afford to lose. Market conditions can change without notice, and news or illiquidity may cause gaps and slippage; stop-loss orders are not guaranteed.
The analysis presented does not take into account your objectives, financial situation, or risk tolerance. Before acting, assess suitability in light of your circumstances and consider seeking advice from a licensed professional. Past performance and back-tested or hypothetical scenarios are not reliable indicators of future results, and no outcome or level mentioned here is assured. You are solely responsible for all trading decisions, including position sizing and risk management. No external links, promotions, or contact details are provided, in line with TradingView House Rules.
CADCHF - Buy - RR: 2-1Price is being at a H4 demand zone, absorbing more buy orders, expecting a move up high.
Buy now, TP and SL as published!

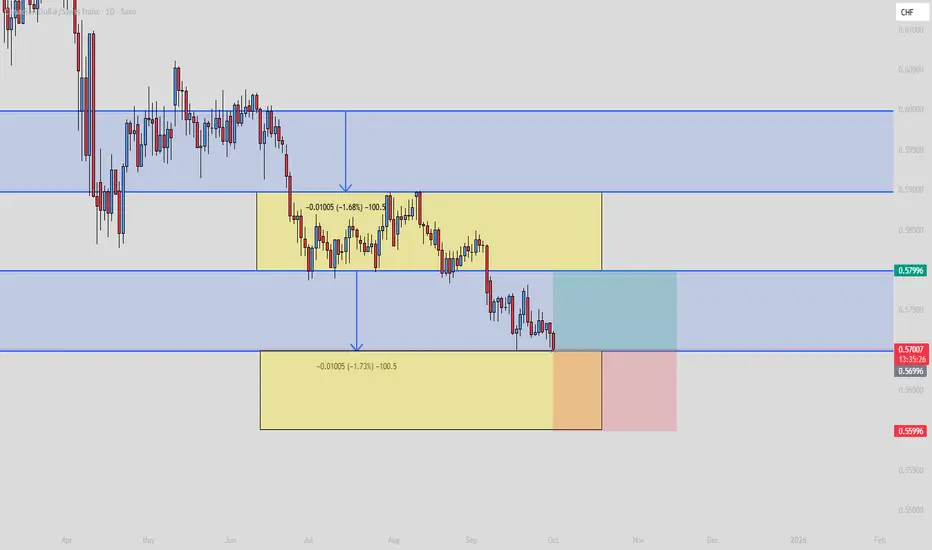
Is it time for break out?Swiss Franc has one of the best performance 1.50% last month, 2.36% last 3 months and 7.06% the last 6 months. The price is right now at the last two days supply zone it is possible the price fall at the last demand zone and even go lower on 0.57008 or it will break the zone and the break out will start. Most favourable scenario is to sell now.
CAD/CHF Buy Setup Reasons Behind Buy Setup
W Pattern formed with bullish momentum after market was oversold
Profit target near resistance level which may be a possibility turning point.

CAD/CHF Bearish Continuation Setup: Flag + Rising WedgeHello guys!
Let's analyze CADCHF!
1. Flag Pattern Formation
Firstly, CAD/CHF formed a bearish flag pattern. The flagpole was created by the sharp drop from around 0.5820 down to 0.5730, followed by the consolidation phase. The measured move of the flag points to a target around 0.5685, which is clearly marked on your chart.
2. Descending Trendline
We can also see a descending trendline drawn from the recent highs. This confirms that the dominant trend remains bearish, as sellers continue to push the price lower at each bounce.
3. Rising Wedge in Play
Currently, price is trading inside a rising wedge, moving upwards from the recent low near 0.5700 up to 0.5755. This wedge hasn’t broken down yet, but if it does, it will provide a strong short opportunity.
Target of the wedge breakdown: around 0.5720
Target of the flag pattern: around 0.5685
Disclaimer: As part of ThinkMarkets’ Influencer Program, I am sponsored to share and publish their charts in my analysis.


CADCHF Long Trade OANDA:CADCHF Long Trade
Entry:0.57550 - 0.5776
TP-1: 0.57950 - Breakeven here
TP-2: 0.58200
This is good trade.
Don't overload your risk like Greedy gambler!!!
Be Disciplined Trader, risk what you can afford.
Use proper risk management.
Disclaimer: Trading is risky, only idea, not advice.

CAD/CHF BEARS ARE STRONG HERE|SHORT
Hello, Friends!
CAD/CHF is trending down which is obvious from the red colour of the previous weekly candle. However, the price has locally surged into the overbought territory. Which can be told from its proximity to the BB upper band. Which presents a great trend following opportunity for a short trade from the resistance line above towards the demand level of 0.570.
Disclosure: I am part of Trade Nation's Influencer program and receive a monthly fee for using their TradingView charts in my analysis.
✅LIKE AND COMMENT MY IDEAS✅

CADCHF Retest of Major Support Level at (0.58004 - 0.57835)Price is in heavy downtrend.
Price broke major support level that will turn to resistance at (0.58004 - 0.57835).
Bearish falling trendline with 2 touches at Key Support Level.
Price is in 50% - 61.8% Fib Zone.
