CADCHF: Rate differential and oil sensitivity short.CADCHF: Rate differential and oil sensitivity short.
Summary
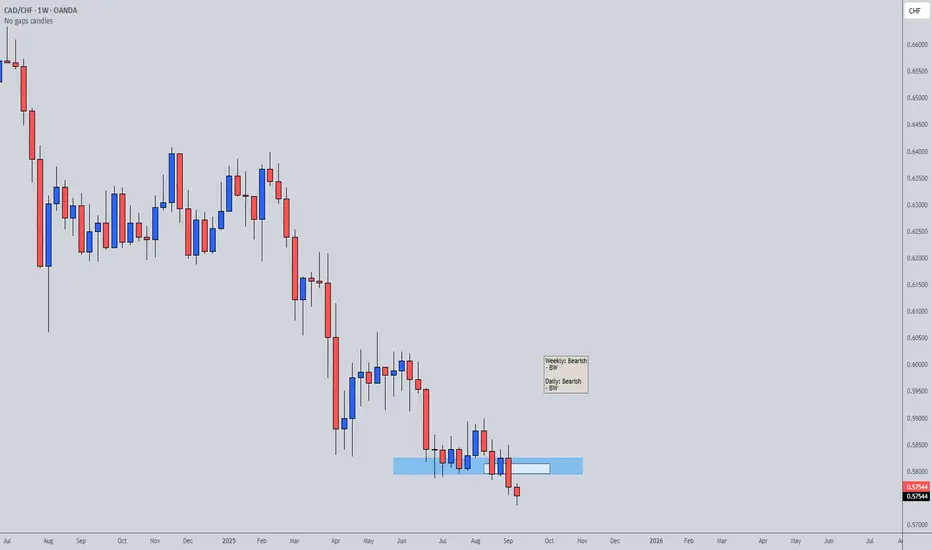
Bias is short CAD against CHF. Canada’s growth is softer and more rate sensitive, with inflation nearer target and a central bank that is further along an easing path. Switzerland’s inflation is lower and stable, with policy calibrated and the currency retaining safe-haven characteristics. The mix favors CHF over CAD, especially if global growth or commodities wobble.
Macro Overview
Growth and inflation: Canada shows slower activity and disinflation toward target. Switzerland remains low-inflation with steady domestic demand.
Implication: Relative yields and macro resilience favor CHF when risk appetite is fragile or commodity momentum fades.
Monetary and Fiscal Policy
BoC vs SNB: BoC guidance is more dovish given weaker growth. SNB policy is measured and inflation remains contained.
Rate differentials: Front-end spreads are prone to narrow against CAD on weak Canadian data or risk-off, supporting CHF.
Geopolitical and Structural Risks
Oil sensitivity: CAD is leveraged to crude. Sustained oil strength aids CAD, while range-bound or softer oil weighs on CAD.
Risk regime: CHF tends to benefit in risk-off episodes and periods of tighter global financial conditions.
Market Impact Assessment
Drivers: Short-end spreads, oil trend, and risk sentiment.
Flows: In slower global growth, safe-haven demand and lower beta work in CHF’s favor.
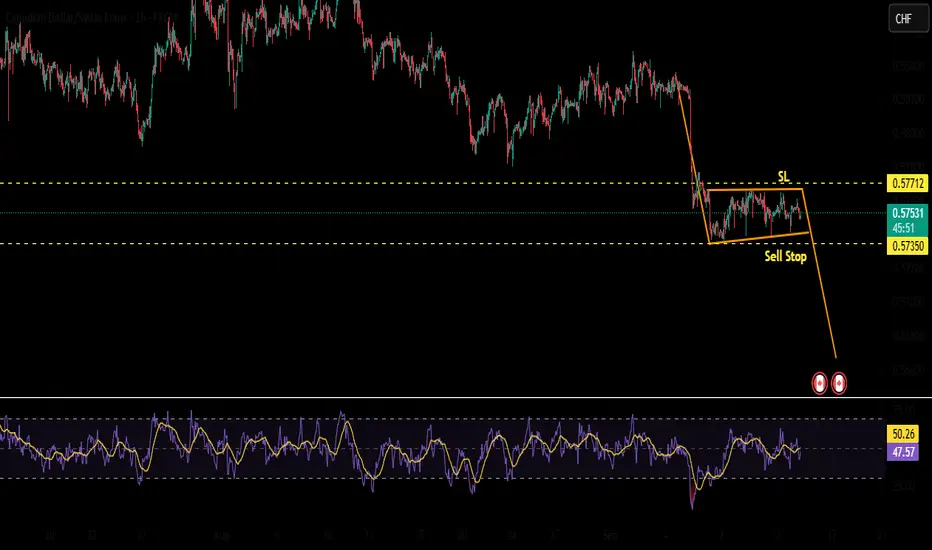
CADCHF — Trade Idea
Management — ATR trailing, no fixed targets
Timeframe: 4h ATR period: 8 Multiplier: 8 Update: at the daily close only.
At entry (short): ATR stop = day’s high + 8 × ATR(8). If this sits above your hard stop, cap it at the hard stop.
Each day: new stop = min(previous stop, today’s high + 8 × ATR(8)). Never loosen.
Exit: Close the position on a daily close above the trailing stop.
Event mode: Before major Canada or Switzerland releases or central-bank decisions, if in profit, tighten to max(breakeven, current ATR stop). Resume normal trailing after the event day’s close.
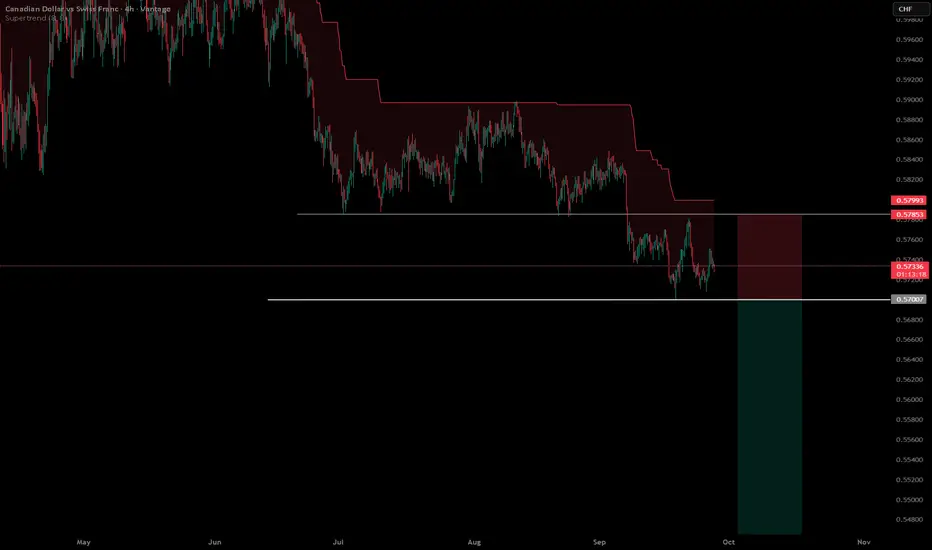
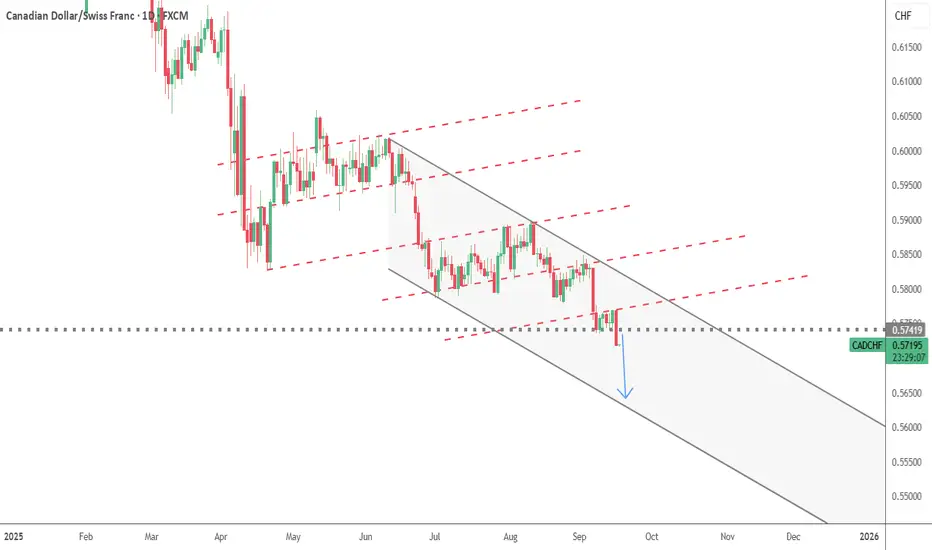
Reference levels from chart: swing high area 0.57812–0.57907; base/break level 0.56999; measured extension checkpoint around 0.55945.
CADCHF — Potential Invalidation/Shift Triggers (Next 8–10 Weeks)
October 2025
Thu 2 Oct — Switzerland CPI (m/m, y/y)
A firm print supports CHF; a soft print weakens the short-CAD/long-CHF view.
Fri 3 Oct — Canada Employment (jobs, unemployment rate)
Strong jobs could lift CAD; weak data support the short.
Tue 21 Oct — Canada CPI suite (headline and core measures)
Hot inflation risks a less-dovish BoC path and CAD squeeze.
Wed 29 Oct — Bank of Canada rate decision, statement, press conference
Hawkish guidance supports CAD; dovish follow-through supports the short.
Thu 30 Oct — Switzerland KOF Leading Indicator
Upside strengthens CHF; downside softens it.
Fri 31 Oct — Canada GDP m/m
Stronger growth aids CAD; weak print supports the short.
November 2025
Tue 4 Nov — Switzerland CPI (m/m, y/y)
Re-acceleration would be CHF-positive; disinflation would ease CHF support.
Fri 7 Nov — Canada Employment
Another strong jobs print could pressure shorts; softening supports them.
Tue 18 Nov — Canada CPI suite
A hotter run of inflation would slow BoC easing and favor CAD.
Fri 28 Nov — Switzerland KOF Leading Indicator and Q3 GDP (approx. window)
Better Swiss growth data would reinforce CHF support.
How to use this list
- Primary invalidation themes: CAD bullish shocks from Canadian CPI, jobs, GDP, or a hawkish BoC pivot; CHF-negative shocks from softer Swiss CPI or weaker Swiss growth.
- Protocol: Tighten risk into these releases; reassess the short if outcomes narrow the CAD–CHF policy gap or materially improve Canada’s growth outlook.
Reassessment Triggers
- Canadian activity or inflation re-accelerates enough to slow BoC easing.
- A durable rise in oil materially improves Canada’s terms of trade.
- A clear shift in SNB communication that meaningfully weakens CHF support.
Finishing statement
Maintain a short bias while the Canada–Switzerland policy differential trends against CAD, oil lacks a sustained uptrend, and global growth or risk appetite remains fragile. Reassess if Canadian data firm and BoC easing expectations fade, if oil enters a durable bullish regime, or if SNB guidance turns more accommodative in a way that reduces CHF support.
Risk Warning
This material is educational research only and does not constitute financial advice, investment recommendation, or a solicitation to buy or sell any instrument. Foreign exchange and CFDs are complex, leveraged products that carry a high risk of rapid losses; leverage amplifies both gains and losses, and you should not trade with funds you cannot afford to lose. Market conditions can change without notice, and news or illiquidity may cause gaps and slippage; stop-loss orders are not guaranteed.
The analysis presented does not take into account your objectives, financial situation, or risk tolerance. Before acting, assess suitability in light of your circumstances and consider seeking advice from a licensed professional. Past performance and back-tested or hypothetical scenarios are not reliable indicators of future results, and no outcome or level mentioned here is assured. You are solely responsible for all trading decisions, including position sizing and risk management. No external links, promotions, or contact details are provided, in line with TradingView House Rules.
Trade ideas
CADCHF - Buy - RR: 2-1Price is being at a H4 demand zone, absorbing more buy orders, expecting a move up high.
Buy now, TP and SL as published!

Is it time for break out?Swiss Franc has one of the best performance 1.50% last month, 2.36% last 3 months and 7.06% the last 6 months. The price is right now at the last two days supply zone it is possible the price fall at the last demand zone and even go lower on 0.57008 or it will break the zone and the break out will start. Most favourable scenario is to sell now.
CAD/CHF Buy Setup Reasons Behind Buy Setup
W Pattern formed with bullish momentum after market was oversold
Profit target near resistance level which may be a possibility turning point.

CAD/CHF Bearish Continuation Setup: Flag + Rising WedgeHello guys!
Let's analyze CADCHF!
1. Flag Pattern Formation
Firstly, CAD/CHF formed a bearish flag pattern. The flagpole was created by the sharp drop from around 0.5820 down to 0.5730, followed by the consolidation phase. The measured move of the flag points to a target around 0.5685, which is clearly marked on your chart.
2. Descending Trendline
We can also see a descending trendline drawn from the recent highs. This confirms that the dominant trend remains bearish, as sellers continue to push the price lower at each bounce.
3. Rising Wedge in Play
Currently, price is trading inside a rising wedge, moving upwards from the recent low near 0.5700 up to 0.5755. This wedge hasn’t broken down yet, but if it does, it will provide a strong short opportunity.
Target of the wedge breakdown: around 0.5720
Target of the flag pattern: around 0.5685
Disclaimer: As part of ThinkMarkets’ Influencer Program, I am sponsored to share and publish their charts in my analysis.


CADCHF Long Trade OANDA:CADCHF Long Trade
Entry:0.57550 - 0.5776
TP-1: 0.57950 - Breakeven here
TP-2: 0.58200
This is good trade.
Don't overload your risk like Greedy gambler!!!
Be Disciplined Trader, risk what you can afford.
Use proper risk management.
Disclaimer: Trading is risky, only idea, not advice.

CAD/CHF BEARS ARE STRONG HERE|SHORT
Hello, Friends!
CAD/CHF is trending down which is obvious from the red colour of the previous weekly candle. However, the price has locally surged into the overbought territory. Which can be told from its proximity to the BB upper band. Which presents a great trend following opportunity for a short trade from the resistance line above towards the demand level of 0.570.
Disclosure: I am part of Trade Nation's Influencer program and receive a monthly fee for using their TradingView charts in my analysis.
✅LIKE AND COMMENT MY IDEAS✅

CADCHF Retest of Major Support Level at (0.58004 - 0.57835)Price is in heavy downtrend.
Price broke major support level that will turn to resistance at (0.58004 - 0.57835).
Bearish falling trendline with 2 touches at Key Support Level.
Price is in 50% - 61.8% Fib Zone.

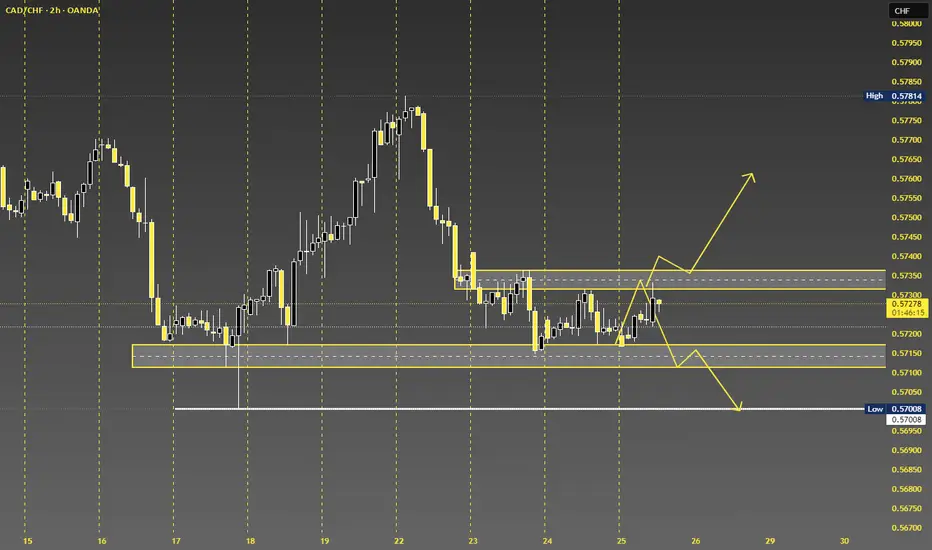
CAD_CHF RESISTANCE AHEAD|SHORT|
✅CAD_CHF is set to retest
A strong resistance level
Above at 0.5790 after trading
In a local uptrend for some time
Which makes a bearish pullback
A likely scenario with the target
Being a local support
Below at 0.5763
SHORT🔥
✅Like and subscribe to never miss a new idea!✅

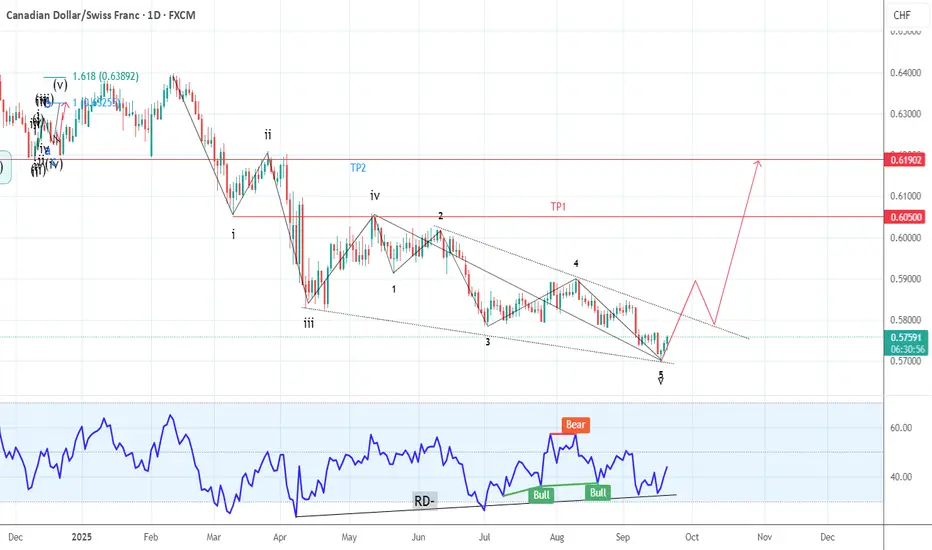
CADCHF Elliott Wave AnalysisHello friends
We are witnessing the formation of a complete Elliott wave pattern on the CADCHF chart. These waves from 1 to 5 are quite distinct and you can even count their subwaves (especially the microwaves of the main wave 5).
Now wave 5 is completing and moving inside a descending channel. The microwaves of wave 5 have already been completed. But after the completion of wave 5, with the breakdown of the trend line drawn above and a return to it, we can expect the price to grow to the specified support.
The first resistance is 0.60500 and the second target is 0.6200.
Of course, the price increase in wave 5 is always accompanied by divergence and a decrease in the slope of the chart, as you can see, the slope of wave 5 is much less than wave 3, and the divergence occurred between the main waves 5 and 3.
Good luck and be profitable.
CADCHF SELL IDEACADCHF - Canadian Dollar was weak today and Swiss Franc one of the strongest. Price is possible to fall on 0.60595

Bearish reversal off major resistance?CAD/CHF is rising towards the pivot which is an overlap resistance, and could reverse to the 1st support.
Pivot: 0.57794
1st Support: 0.57164
1st Resistance: 0.58228
Disclaimer:
The above opinions given constitute general market commentary, and do not constitute the opinion or advice of IC Markets or any form of personal or investment advice.
Any opinions, news, research, analyses, prices, other information, or links to third-party sites contained on this website are provided on an "as-is" basis, are intended only to be informative, is not an advice nor a recommendation, nor research, or a record of our trading prices, or an offer of, or solicitation for a transaction in any financial instrument and thus should not be treated as such. The information provided does not involve any specific investment objectives, financial situation and needs of any specific person who may receive it. Please be aware, that past performance is not a reliable indicator of future performance and/or results. Past Performance or Forward-looking scenarios based upon the reasonable beliefs of the third-party provider are not a guarantee of future performance. Actual results may differ materially from those anticipated in forward-looking or past performance statements. IC Markets makes no representation or warranty and assumes no liability as to the accuracy or completeness of the information provided, nor any loss arising from any investment based on a recommendation, forecast or any information supplied by any third-party.

CADCHF: Trend ContinuationCADCHF continues to remain bearish as it holds below the key level on the daily timeframe. Here's a summary of my key observations over on the daily and intraday timeframes.
Daily Timeframe:
Price broke the key support level in early September
After some sideways price action, price is currently making a bearish bar that engulfs the prior day's doji
H1 Timeframe:
Price broke through the ATL, which shows confluence with the downtrend
EMA20 is also below EMA60, moving further apart to signal momentum is picking up
Price is also below EMA20, which signals confluence with downtrend as well

CADCHF | ABCD PatternCADCHF has formed an ABCD pattern.Once it gives a breakout then it will further go downside and continue bearish trend.
CADCHFthe price respected it and formed sweep then choch and engulfing candle
which indicate uptrend wave
Exit point is 0.57700

CADCHF POSSIBLE LONGCADCHF Showing possible FLAT FORMATION?. We have seen 3 corrective waves in WAVE A, 3 corrective waves in B?. If CADCHF stays above 0.57350, then CADCHF should be expected to rally to 0.58900 TO COMPLETE C

CADCHF - Short - Conviction: Low | Chronex (London • Sep 12)Hello Guys! Overall trend from all timeframe is Downtrend, sellers are in control. We are now on pretty good supply zone
Risks
1. Do we have economic high impact news release? No
2. Any higher-timeframe counter-trend zones? No
3. Has better zone above/below? None
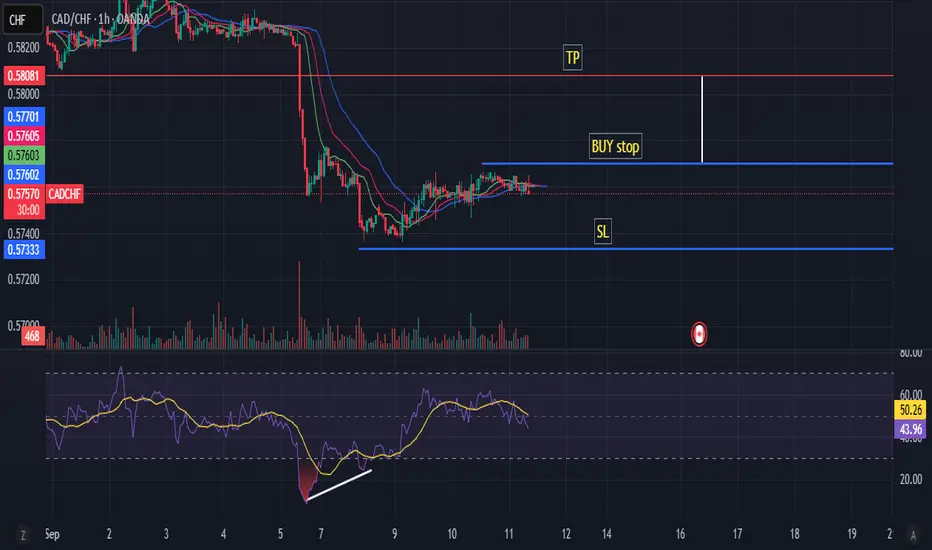
CADCHF in bearish trend CADCHF in bearish trend, RSI bullish diversion can be seen. My fx book bias 92% bullish entry with a buy stop RR 1:1
Sell CADCHF CADCHF Bearish Idea: A bearish flag is seen on the 3hr chart. We can expect price to decline today with sharp bearish moves before a potential change of direction

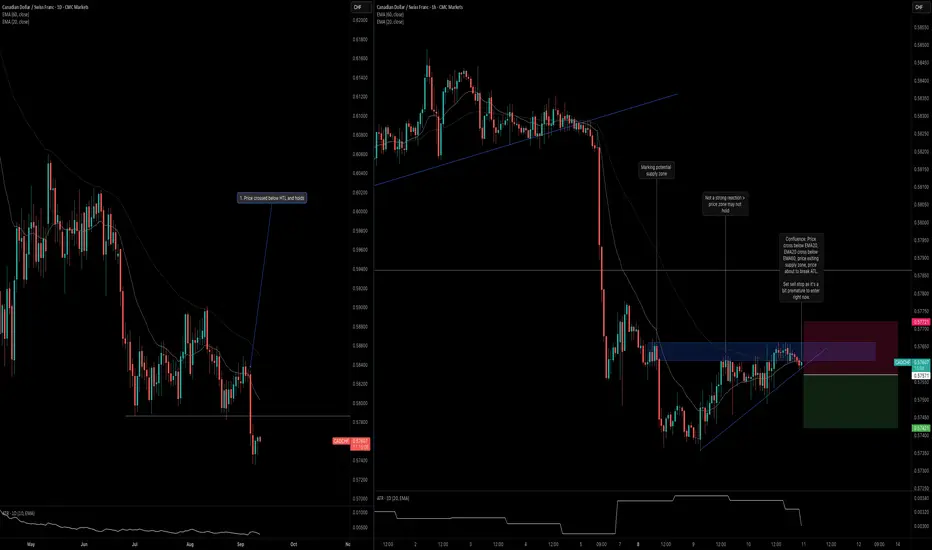
CADCHF: Trend Continues Below Daily LevelCADCHF is beginning to show confluence, which gives me an opportunity to frame my entry opportunity. Here are the key observations across the daily and H1 timeframes.
Daily Timeframe:
Price made a strong break below the HTL and is holding below it.
Although two bullish bar formed, they did not engulf the previous bearish bar, which is a good indication that buying strengh just isn't there.
H1 Timeframe:
There's quite a bit of confluence on the H1 timeframe with the first being price entering and exiting the potential supply zone.
In addition, price is about to cross below the ATL, which is another sign that the counter-trend move is ending.
Finally, there's confluence with the moving averages where EMA20 is crossing below EMA60; price is also beginning to cross below EMA20.