NIFTY Strong selling pressure. Two potential targets.Last time we looked at the Nifty 50 Index (NIFTY) was almost at the start of the year (February 13, see chart below), giving a strong Sell Signal which quickly hit our 22250 Target:
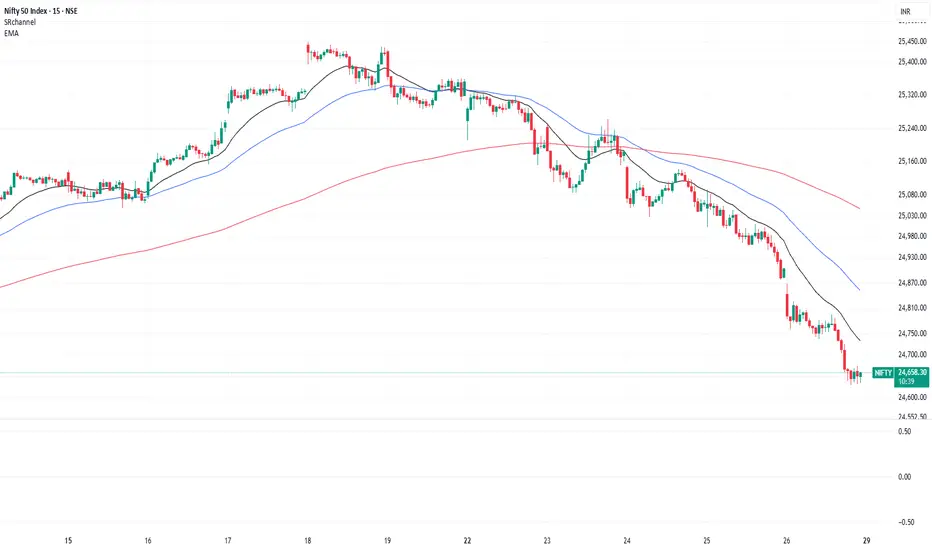
This time the index finds itself within a Channel Down, currently on a strong Bearish Leg, with the last sell signal being the 1D MA50/ 100 Bearish Cross. Our immediate Target is 24500, which is the Higher Lows trend-line, the next level of Support.
If that breaks and then the price gets rejected on it again after a bounce, we expect further decline, targeting the 1D MA200 (orange trend-line) and the bottom of the Channel Down at 24200.
-------------------------------------------------------------------------------
** Please LIKE 👍, FOLLOW ✅, SHARE 🙌 and COMMENT ✍ if you enjoy this idea! Also share your ideas and charts in the comments section below! This is best way to keep it relevant, support us, keep the content here free and allow the idea to reach as many people as possible. **
-------------------------------------------------------------------------------
💸💸💸💸💸💸
👇 👇 👇 👇 👇 👇
Trade ideas

Nifty 50 Analysis and Forecast: Key Levels and PredictionsAs the trading week wraps up at 02:54 PM IST on September 26, 2025, the Nifty 50 is making headlines with its recent downturn, currently sitting at 24,691.40. With technical indicators flashing red, let’s dive into the latest chart analysis to uncover critical support and resistance levels, and offer a prediction for tomorrow, September 27, 2025. Whether you’re a seasoned trader or a curious investor, this breakdown is your guide to navigating the market’s next move!
EMA Insights: A Bearish Turn
The Nifty 50’s daily chart paints a bearish picture, with the index plunging below key Exponential Moving Averages (EMAs). The 20-period EMA at 24,929.33, 50-period EMA at 25,048.97, and 200-period EMA at 25,000.94 have all turned into resistance zones as the price drops. This decisive break below the 50 EMA signals a shift to a short-term downtrend, hinting at further weakness unless a reversal pattern emerges to challenge the bearish momentum.
RSI Breakdown: Oversold Territory Beckons
The Relative Strength Index (RSI) at 16.443 places the Nifty 50 deep in oversold territory (below 30), suggesting extreme selling pressure and a potential exhaustion point for bears. While this often sets the stage for a technical rebound, the accompanying negative MACD at -127.11 warns that any bounce might be fleeting without strong bullish confirmation. Traders should watch this level closely for signs of a turnaround.
Support and Resistance Levels to Watch
Key support levels are critical for the Nifty 50’s next move. Immediate support lies at 24,716 (S1 pivot), 24,695 (S2), and 24,655 (S3), where buyers might step in for a relief rally, especially given the oversold RSI. A deeper drop could find footing at 24,600, aligning with recent lows. On the resistance side, initial hurdles are at 24,777 (R1) and 24,816 (R2); a sustained break above 24,838 (R3) could indicate stabilization, though the current sell bias favors resistance holding firm.
Tomorrow’s Market Prediction: What Lies Ahead
Looking ahead to September 27, 2025, the Nifty 50 faces intensified downside risks, with the potential to test supports at 24,695-24,655 if selling continues. However, the deeply oversold RSI opens the door for an intraday bounce toward 24,777-24,800, particularly if positive global cues emerge overnight. The bias leans bearish/neutral, with volume being the key to spotting reversal signs. Expect range-bound action unless the index breaches below 24,650, which could accelerate a move toward 24,500. Stay vigilant and ready to adapt!
This analysis blends real-time data with technical expertise, offering a clear roadmap for tomorrow’s trading session. Keep this page bookmarked for updates, and let’s tackle the Nifty 50’s next chapter together!
Nifty levels - Sep 29, 2025Nifty support and resistance levels are valuable tools for making informed trading decisions, specifically when combined with the analysis of 5-minute timeframe candlesticks and VWAP. By closely monitoring these levels and observing the price movements within this timeframe, traders can enhance the accuracy of their entry and exit points. It is important to bear in mind that support and resistance levels are not fixed, and they can change over time as market conditions evolve.
The dashed lines on the chart indicate the reaction levels, serving as additional points of significance to consider. Furthermore, take note of the response at the levels of the High, Low, and Close values from the day prior.
We hope you find this information beneficial in your trading endeavors.
* If you found the idea appealing, kindly tap the Boost icon located below the chart. We encourage you to share your thoughts and comments regarding it.
Wishing you success in your trading activities!

Nifty50 long setupNifty 50 long setup
Entry - 24715.05
Stop loss - 24522.35
Target - 25448.95
Risk Reward - 1:3.8

Nifty 50 : Sell Signal Triggered Nifty 50 : Sell Signal Triggered .
Support at 24600 and another major support at 24400.
( Not a Buy / Sell Recommendation
Do your own due diligence ,Market is subject to risks, This is my own view and for learning only .)

Domestic vs Global Markets1. Definition of Domestic and Global Markets
Domestic Market
A domestic market refers to the economic environment within a country's borders where goods, services, labor, and capital are exchanged. It is governed by local regulations, currency, taxation policies, and market structures. The domestic market serves as the primary platform for local businesses to sell products, engage consumers, and stimulate economic growth.
Examples:
India’s retail market primarily serving Indian consumers.
U.S. domestic stock market, such as NYSE or NASDAQ, dealing mainly in dollars.
Global Market
A global market (or international market) refers to the interconnected system of trade, finance, and investment across multiple countries. It involves cross-border exchange of goods, services, capital, and labor, influenced by global supply-demand dynamics, foreign currencies, international regulations, and geopolitical factors.
Examples:
The global oil market, where prices are determined internationally.
Forex market, which is inherently global, with currencies traded worldwide.
Companies like Apple, which sell products across multiple countries.
2. Key Characteristics
Domestic Market
Local Regulation: The market follows the country’s legal framework, tax policies, and consumer protection laws.
Single Currency: Transactions are primarily in the local currency, reducing foreign exchange risk.
Cultural Familiarity: Businesses have deeper knowledge of consumer behavior and local preferences.
Limited Exposure: Domestic markets are less impacted by global political or economic crises.
Global Market
Multiple Regulations: Operations span different countries, requiring compliance with diverse laws and standards.
Currency Fluctuations: Exposure to foreign exchange risk due to multiple currencies.
Wider Customer Base: Access to international consumers and markets increases potential revenue.
Higher Volatility: Global economic crises, geopolitical tensions, and trade policies can affect performance.
3. Advantages of Domestic Markets
Stability: Less affected by global economic shocks, providing consistent demand.
Regulatory Familiarity: Easier for businesses to comply with local laws and taxation.
Consumer Insight: Businesses can adapt products to local tastes and cultural nuances.
Lower Transaction Costs: No need to manage foreign exchange risks or international logistics.
Government Support: Domestic markets often benefit from incentives, subsidies, or protective tariffs.
4. Advantages of Global Markets
Market Expansion: Companies can access millions of new customers globally.
Diversification: Exposure to multiple markets reduces dependency on one economy.
Higher Profit Potential: International markets often have higher growth potential.
Learning Opportunities: Exposure to global trends fosters innovation and competitiveness.
Investment Access: Global financial markets provide opportunities for foreign capital and partnerships.
5. Challenges in Domestic Markets
Limited Growth: Once saturated, domestic markets may offer limited expansion opportunities.
High Local Competition: Localized industries may be competitive, making profit margins narrow.
Economic Vulnerability: Economic downturns in the country can significantly affect businesses.
Regulatory Constraints: Stringent local laws may limit flexibility.
6. Challenges in Global Markets
Currency Risk: Exchange rate fluctuations can erode profits.
Political Risk: Political instability in foreign countries can disrupt operations.
Cultural Barriers: Misunderstanding local customs can impact brand acceptance.
Logistics and Supply Chain: Managing international shipping, tariffs, and customs can be complex.
Regulatory Compliance: Adhering to multiple countries’ regulations increases costs and operational complexity.
7. Domestic vs Global Market Strategies
For Businesses in Domestic Markets
Focus on Brand Loyalty: Build strong local relationships.
Cost Optimization: Streamline operations for local efficiency.
Market Research: Analyze local consumer trends thoroughly.
Policy Leverage: Utilize government incentives and subsidies.
For Businesses in Global Markets
Diversify Operations: Spread operations across different countries to reduce risk.
Hedging Currency Risk: Use financial instruments like forwards or options.
Cultural Adaptation: Localize products and marketing strategies.
Global Partnerships: Collaborate with local firms to ease market entry.
8. Economic Impact of Domestic vs Global Markets
Domestic Market Impact
Drives local employment and entrepreneurship.
Increases government revenue through taxes and tariffs.
Supports national economic stability, cushioning against global shocks.
Global Market Impact
Encourages economic integration and global cooperation.
Stimulates foreign investment inflows and technology transfer.
Can create volatility, as economies become interdependent.
9. Investment Considerations
Domestic Market Investment
Lower Risk: Investments are less exposed to foreign policy or currency fluctuations.
Predictable Returns: Local trends are easier to anticipate.
Examples: Investing in national stock exchanges or government bonds.
Global Market Investment
High Returns Potential: International diversification can offer superior returns.
Hedging Benefits: Helps mitigate domestic economic slowdown.
Examples: Global ETFs, foreign real estate, international stocks.
10. Case Studies
Domestic Success Story
Reliance Jio in India: Focused on penetrating India’s telecom market, leveraging local consumer behavior and government policies.
Global Success Story
Apple Inc.: Operates in over 100 countries, generates significant revenue internationally, and adapts products to local markets (e.g., dual SIM iPhones in Asia).
11. Technological Influence
Both markets are increasingly shaped by technology:
Domestic: E-commerce platforms, digital payments, local delivery systems.
Global: Cloud computing, international payment gateways, global logistics networks, and data analytics for multi-country market strategies.
12. Policy Implications
Governments shape market dynamics through:
Domestic Market: Subsidies, tariffs, local content requirements, and tax incentives.
Global Market: Trade agreements, export-import regulations, foreign investment rules, and geopolitical diplomacy.
13. Future Trends
Domestic Market:
Increased digital adoption.
Localized production (e.g., Make in India).
Enhanced consumer-focused innovation.
Global Market:
Greater global interconnectivity via technology and logistics.
Rising influence of emerging markets in global trade.
Sustainability and ESG (Environmental, Social, Governance) shaping international investments.
14. Conclusion
Understanding domestic vs global markets is crucial for businesses, investors, and policymakers. Domestic markets offer stability, cultural familiarity, and lower risk, while global markets provide diversification, higher profit potential, and exposure to innovation and growth. Both markets are interlinked, with decisions in one often influencing the other. Businesses and investors must balance the benefits and challenges of each, leveraging technology, strategic partnerships, and risk management to thrive in today’s interconnected world.

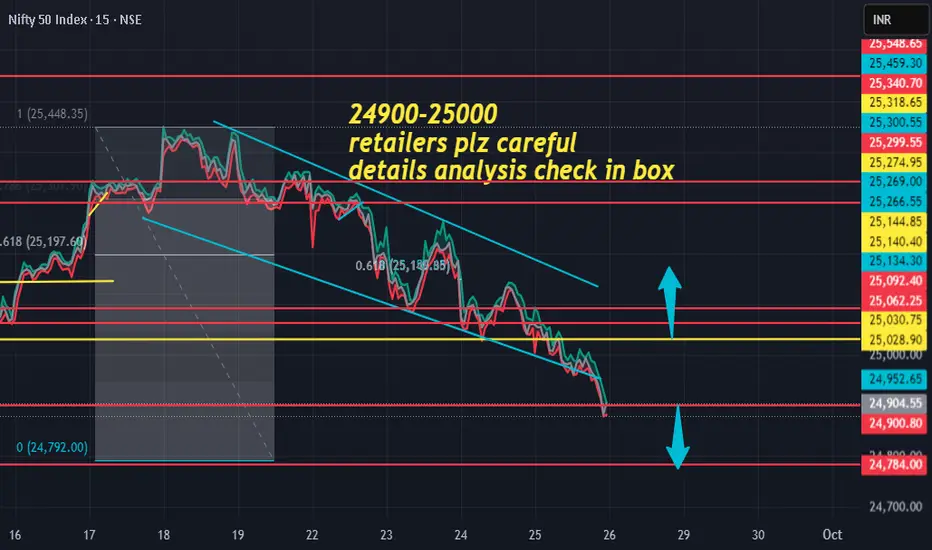
26 /sept/2026tgt was hit .
now
yesteray
my levels was multiples time provide safety to retail trraders and stop to trade in stoploss hunting zone.
now level for today .
25900-25000 strict range follow for retailer traders safety avoid stoploss hunting .
put below 25900
call above 25000
tgt extend 50/100/200 points.
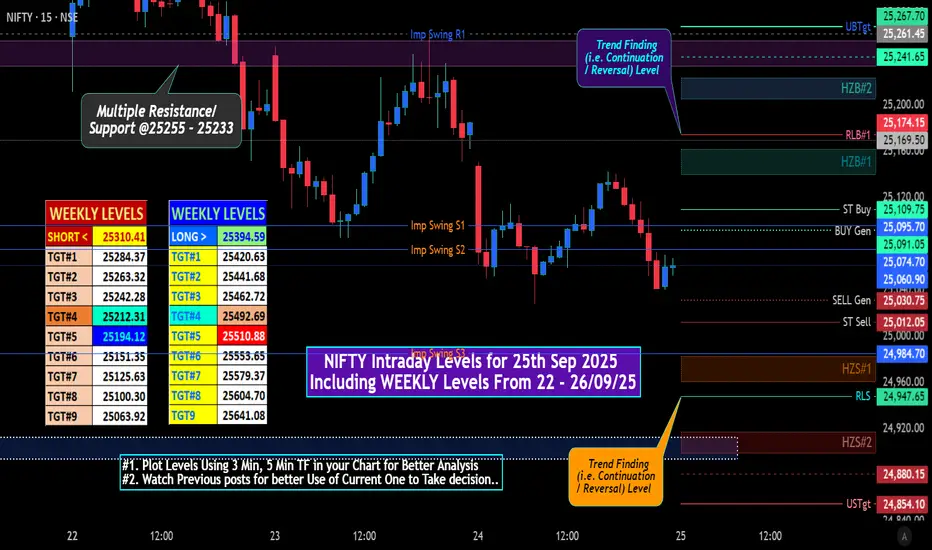
NIFTY Intraday Levels for 25th Sep 2025NIFTY Intraday Levels for 25th Sep 2025
# "WEEKLY Levels" mentioned in BOX format.
^^^^^^^ Plot Levels Using 3 Min, 5 Min Time frame in your Chart for Better Analysis ^^^^^^^
L#1: If the candle crossed & stays above the “Buy Gen”, it is treated / considered as Bullish bias.
L#2: Possibility / Probability of REVERSAL near RLB#1 & UBTgt
L#3: If the candle stays above “Sell Gen” but below “Buy Gen”, it is treated / considered as Sidewise. Aggressive Traders can take Long position near “Sell Gen” either retesting or crossed from Below & vice-versa i.e. can take Short position near “Buy Gen” either retesting or crossed downward from Above.
L#4: If the candle crossed & stays below the “Sell Gen”, it is treated / considered a Bearish bias.
L#5: Possibility / Probability of REVERSAL near RLS#1 & USTgt
HZB (Buy side) & HZS (Sell side) => Hurdle Zone,
*** Specialty of “HZB#1, HZB#2 HZS#1 & HZS#2” is Sidewise (behaviour in Nature)
Rest Plotted and Mentioned on Chart
Color code Used:
Green =. Positive bias.
Red =. Negative bias.
RED in Between Green means Trend Finder / Momentum Change
/ CYCLE Change and Vice Versa.
Notice One thing: HOW LEVELS are Working.
Use any Momentum Indicator / Oscillator or as you "USED to" to Take entry.
📊 Disclaimer
I am not a SEBI-registered financial adviser.
The information, views, and ideas shared here are purely for educational and informational purposes only. They are not intended as investment advice or a recommendation to buy, sell, or hold any financial instruments.
Trading and investing in the stock market involves risk, and you should do your own research and analysis. You are solely responsible for any decisions made based on this research.
"As HARD EARNED MONEY IS YOUR's, So DECISION SHOULD HAVE TO BE YOUR's".
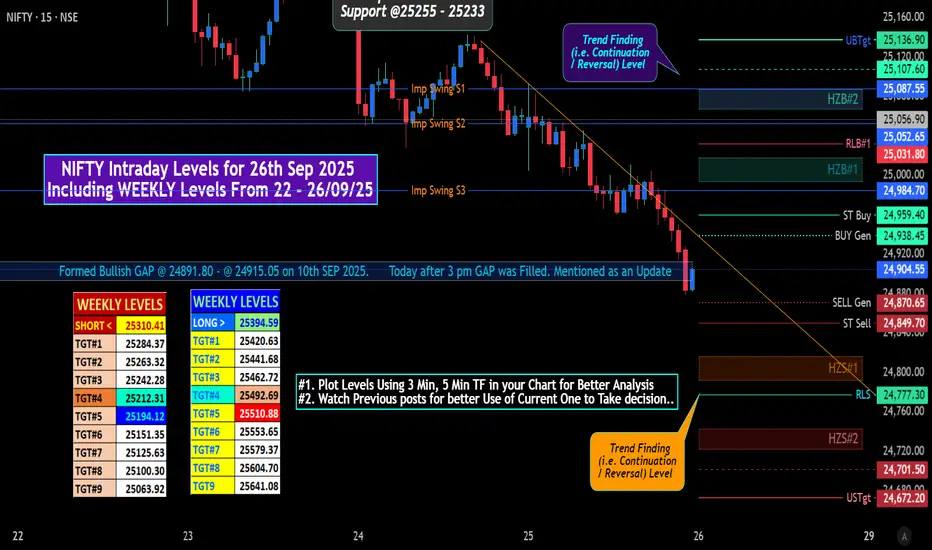
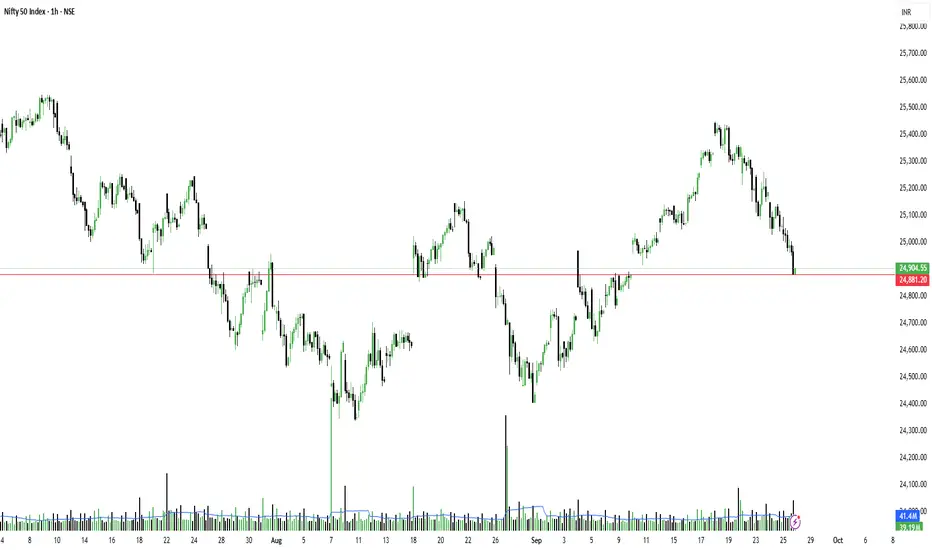
NIFTY Hourly Analysis & Intraday Levels for 26th Sep 2025NIFTY Intraday Levels for 26th Sep 2025
NIFTY — 1-hour technical read
Short version — Structure & Bias
• The 1-hour structure has flipped from a clean rally (early Sep → 17–18 Sep peak) into a short-term downtrend ( mentioned on 19th Sep 2025 POST ) : lower highs after the mid-Sep peak and a sharp sequence of bearish candles the past few sessions.
• Price is sitting at ~24,904.55 (blue line on the chart). That area is an important near-term pivot: holding it likely produces a short bounce / range; losing it opens the way to the next support zone.
Market structure (what I see)
• Uptrend → distribution → Down move . From Sep 3 → Sep 17 saw Higher Highs /Higher Lows. After topping ~25,48.95 there was a distribution phase and sellers pushed price lower.
• Recent price action: Steady series of red hourly candles with only small corrective candles — momentum favors bears on the 1-hour.
• Shorter horizon: immediate reaction (last candle) shows a small blue candle near the dotted line — indicates a short pause, not yet a reversal.
### For more Details do comment.
GIFTNIFTY TRADING fLAT TO -vE.
# "WEEKLY Levels" mentioned in BOX format.
^^^^^^^ Plot Levels Using 3 Min, 5 Min Time frame in your Chart for Better Analysis ^^^^^^^
L#1: If the candle crossed & stays above the “Buy Gen”, it is treated / considered as Bullish bias.
L#2: Possibility / Probability of REVERSAL near RLB#1 & UBTgt
L#3: If the candle stays above “Sell Gen” but below “Buy Gen”, it is treated / considered as Sidewise. Aggressive Traders can take Long position near “Sell Gen” either retesting or crossed from Below & vice-versa i.e. can take Short position near “Buy Gen” either retesting or crossed downward from Above.
L#4: If the candle crossed & stays below the “Sell Gen”, it is treated / considered a Bearish bias.
L#5: Possibility / Probability of REVERSAL near RLS#1 & USTgt
HZB (Buy side) & HZS (Sell side) => Hurdle Zone,
*** Specialty of “HZB#1, HZB#2 HZS#1 & HZS#2” is Sidewise (behaviour in Nature)
Rest Plotted and Mentioned on Chart
Color code Used:
Green =. Positive bias.
Red =. Negative bias.
RED in Between Green means Trend Finder / Momentum Change
/ CYCLE Change and Vice Versa.
Notice One thing: HOW LEVELS are Working.
Use any Momentum Indicator / Oscillator or as you "USED to" to Take entry.
📊 Disclaimer
I am not a SEBI-registered financial adviser.
The information, views, and ideas shared here are purely for educational and informational purposes only. They are not intended as investment advice or a recommendation to buy, sell, or hold any financial instruments.
Trading and investing in the stock market involves risk, and you should do your own research and analysis. You are solely responsible for any decisions made based on this research.
"As HARD EARNED MONEY IS YOUR's, So DECISION SHOULD HAVE TO BE YOUR's".
Expecting a turnaround in Nifty from hereOk, so everything once again went as we planned yesterday. Sellers' volume in NSE:NIFTY was higher than buyers', which got reflected today.
We are totally rocking it with the index options trading!
Now, what I see today is that the index has found support on the 1-hour and weekly charts.
Plus, in the middle of the day, the sellers' volume was around 20 million, but by the end of the day, it dried up to only 6 million. That confirms the index has found support and is trying to bounce.
The support with confluence is at 24880. Closing above that today really gave a good hint.
However, I wouldn't jump to the long side unless and until the market confirms my view. So here is my strategy for tomorrow for playing index options:
The pivot for Nifty is at 24954. The PP is 0.25.
I would like to see Nifty opening above that pivot tomorrow if I plan to go long. Now, as the PP is wide, I can't expect a sharp move day. Rather, a consolidation here would be really good to go long for another few days. For the time being, my target would be 25050. The first batch of my long trade I will book near this point, and I will only hold positional longs, which I do with index futures + options strategy, if Nifty closes above this point on the daily chart.
One thing is for sure - I won't short the index from here on. At least wait for the bounce and see whose volume is bigger.
For the equity side - I will focus on minerals and specialty chemical industry stocks.
That's it for the day. Take care. Have a profitable tomorrow.
---
📊 Levels at a glance:
Pivot: 24954
Support: 24880
Resistance: 25050
Pivot Percentile: 0.25 (wide, hints at consolidation)
Bias: Wait for confirmation, bullish above pivot, no shorts from here
Sectors to watch: Minerals, Specialty Chemicals
Weak closing but market on the verge of being oversold.We saw a closing today that has dragged Nifty below Father line support and mid channel support of hourly chart. RSI is indicating that the market is oversold and there are slim chances of recovery from support near 24872. If 24872 is broken than we can see Nifty further slipping towards 24772, 24644 or even channel bottom near 24473. If 24473 is broken then market can end up in total bear grip.
Resistances for market seem to be near 24959 Mid channel resistance, followed by father line and Mother line resistance near 24999 and 24125. Closing above 25125 can take the market upwards towards 25215, 25343 and 25431. As of now 25431 is the channel top.
As of now shadow of the candle is neutral but with a tinge of red. Meaning we can have a flat to positive start but later market can become laggard again. For market to sustain upward momentum we need a closing above both Mother and Father line resistances on daily chart.
Disclaimer: The above information is provided for educational purpose, analysis and paper trading only. Please don't treat this as a buy or sell recommendation for the stock or index. The Techno-Funda analysis is based on data that is more than 3 months old. Supports and Resistances are determined by historic past peaks and Valley in the chart. Many other indicators and patterns like EMA, RSI, MACD, Volumes, Fibonacci, parallel channel etc. use historic data which is 3 months or older cyclical points. There is no guarantee they will work in future as markets are highly volatile and swings in prices are also due to macro and micro factors based on actions taken by the company as well as region and global events. Equity investment is subject to risks. I or my clients or family members might have positions in the stocks that we mention in our educational posts. We will not be responsible for any Profit or loss that may occur due to any financial decision taken based on any data provided in this message. Do consult your investment advisor before taking any financial decisions. Stop losses should be an important part of any investment in equity.

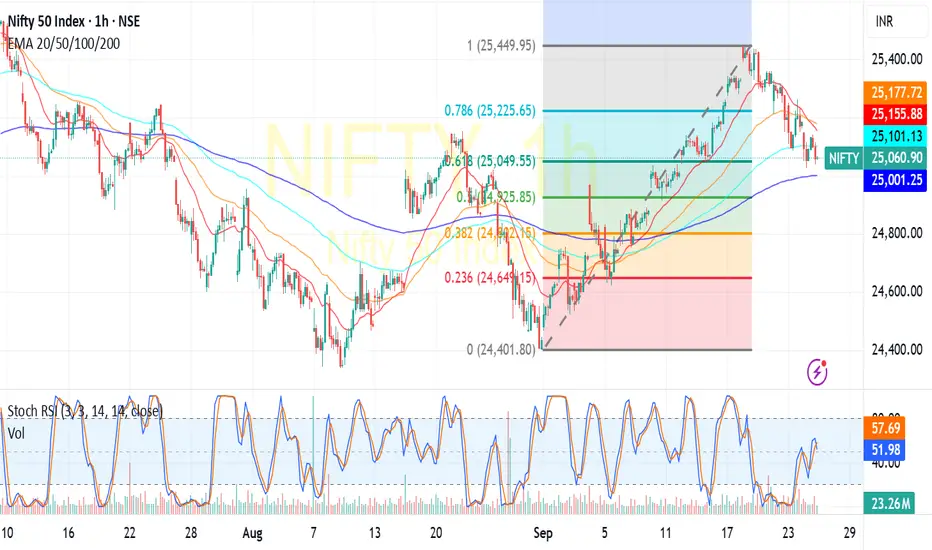
NIFTY-FIBONAC SUPPORT& RESISTANCE LEVELSNIFTY :As per the Fib low/high levels in Sep,2025 the critical levels are
SEP-2025 :Low level :24400 Peak :25440
FIBONACCI : 61.8% Support levels :25050
50% Support level falls at around 24950-975 which should act as one of the major support
Next major 38% Fib retracement support lies at 24800
My approach would be
i) Sell on rise till it breaches 25228
ii)Sell below 25025 on 15 min basis for 24950 levels target .would get into aggressive buy only when NIFTY holds above 25228-250 on a closing basis (for educational purpose only)
Nifty : Expecting short term bearishnessThe price has now broken below both its 20-day and 50-day EMAs with momentum, signalling a shift in market character and underlying weakness.
At the same time, institutional flows have been unimpressive over the past several sessions — foreign institutions (FIIs) have been net sellers, while domestic institutions (DIIs) are offering only modest support.
From a valuation lens, the index trades at a P/E of ~22x, roughly in the ballpark of its historical average — not cheap enough to invoke a confident “value play.”
With Q2 earnings starting to trickle out from the second week of October, the key question is: will companies deliver meaningful upside surprises? In the absence of strong earnings triggers or fresh catalysts, there’s a heightened risk of further downside.
Thus, rather than chasing new swing positions now, a more prudent approach is to pause, reassess, and wait for clearer confirmation of stability or reversal before reentering.
📢📢📢
If my perspective changes or if I gather additional fundamental data that influences my views, I will provide updates accordingly.
Thank you for following along with this journey, and I remain committed to sharing insights and updates as my trading strategy evolves. As always, please feel free to reach out with any questions or comments.
Other posts related to this particular position and scrip, if any, will be attached underneath. Do check those out too.
Disclaimer : The analysis shared here is for informational purposes only and should not be considered as financial advice. Trading in all markets carries inherent risks, and past performance is not indicative of future results. It’s essential to conduct your own research and assess your risk tolerance before making any investment decisions. The views expressed in this analysis are solely mine. It’s important to note that I am not a SEBI registered analyst, so the analysis provided does not constitute formal investment advice under SEBI regulations.

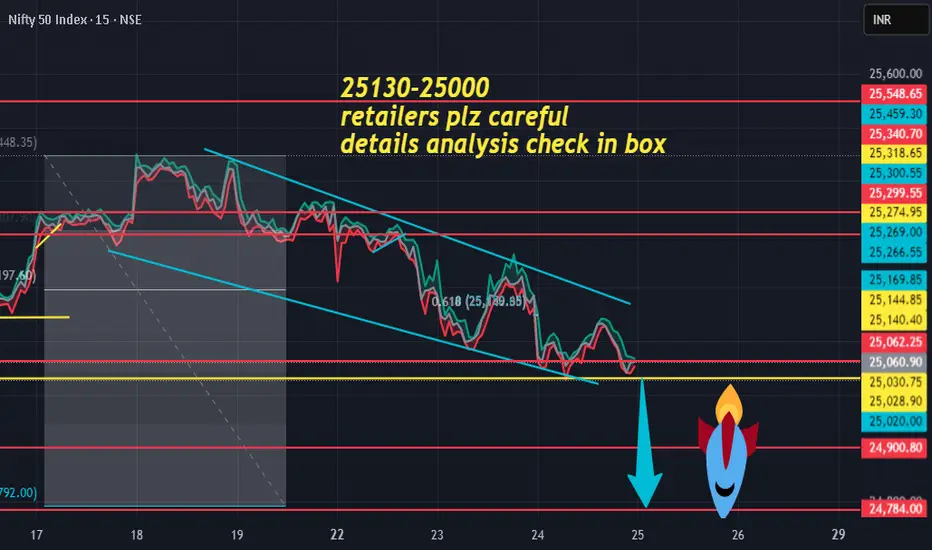
nifty setup for 25/sept/2025past setup was hit .
25130-25000 range .
nifty is running on downtrend .
25130 above 25200/25300
25000 is break than possible points 100+
25000 below tgt -25900/25800
dear traders dont getting trapped ,wait for levels
than go ahead .
Nifty 50 Chart Analysis: Key Support, ResistanceGet the latest insights into the Nifty 50 as markets brace for action! As of today, September 25, 2025, at 03:15 PM IST, our technical analysis dives deep into the Nifty 50's recent performance, spotlighting critical support and resistance levels, and offering a bold prediction for tomorrow, September 26, 2025. Buckle up for a data-driven breakdown that could shape your trading strategy!
EMA Insights: Riding the Trend Waves
The Nifty 50 chart reveals a fascinating dance with its Exponential Moving Averages (EMAs). The 20-period EMA hovers around 25,042, acting as a short-term pivot, while the 50-period EMA (25,040-25,132) and 200-period EMA (around 25,132) underpin a broader bullish trend. Recently, the index dipped below the 20 EMA, signaling short-term weakness, but its position above the 50 and 200 EMAs keeps long-term optimism alive. Watch for a potential bearish crossover that could trigger further declines if momentum shifts.
RSI Breakdown: Neutral Territory Holds the Key
The Relative Strength Index (RSI) stands at 52.17, placing it in neutral territory (45-55). This balance suggests no immediate overbought or oversold conditions, with recent bearish candlesticks hinting at caution. An RSI above 50 still supports consolidation, but traders should stay alert for any breakouts that could signal the next big move.
Support and Resistance Levels to Watch
Key support levels are emerging as critical battlegrounds. The psychological mark of 25,000, reinforced by recent lows, offers immediate cushioning, with stronger support at 24,900 (aligned with the 50-day EMA and 50% Fibonacci retracement). A deeper drop could test 24,400. On the upside, resistance kicks in at 25,600 (past highs) and 25,630. A breakout above 25,600 could ignite bullish momentum, while a fall below 25,000 might accelerate selling toward 24,900.
Tomorrow's Market Prediction: What to Expect
Looking ahead to September 26, 2025, the Nifty 50 is poised for a cautious start, likely consolidating around the 25,000 support. A close below this level could spark a decline toward 24,900, fueled by recent EMA softness. However, a rebound from 25,000-25,042 (20 EMA) with strong volume might push prices toward 25,600. The bias leans neutral, with global cues and an opening above 25,100 as key bullish triggers. Stay tuned!
This analysis blends cutting-edge technical tools with real-time market vibes, making it a must-read for investors and traders alike. Bookmark this page for updates, and let’s navigate the Nifty 50’s next move together!

Nifty levels - Sep 26, 2025Nifty support and resistance levels are valuable tools for making informed trading decisions, specifically when combined with the analysis of 5-minute timeframe candlesticks and VWAP. By closely monitoring these levels and observing the price movements within this timeframe, traders can enhance the accuracy of their entry and exit points. It is important to bear in mind that support and resistance levels are not fixed, and they can change over time as market conditions evolve.
The dashed lines on the chart indicate the reaction levels, serving as additional points of significance to consider. Furthermore, take note of the response at the levels of the High, Low, and Close values from the day prior.
We hope you find this information beneficial in your trading endeavors.
* If you found the idea appealing, kindly tap the Boost icon located below the chart. We encourage you to share your thoughts and comments regarding it.
Wishing you success in your trading activities!
Nifty 50 – Symmetrical Triangle SetupNifty is consolidating inside a large symmetrical triangle.
Support: 24,000–23,500 zone (rising trendline)
Resistance: 25,500–25,800 (falling trendline)
Volume: Contracting, confirming consolidation
Scenarios:
Above 25,800 → room toward 26,500–27,000
Below 24,000 → risk opens toward 22,500–22,000
Bias: Long-term trend is still up. Near-term, likely sideways between 24,000–25,800 until breakout.
⚠️ Disclaimer: This post is for educational purposes only. I am not SEBI registered. Not investment advice.

Introduction: The Timeless Role of Gold in Global Trade1. The Enduring Allure of Gold
From the earliest days of civilization, gold has held a unique place in human society. Unlike other metals, gold does not tarnish, corrode, or lose its luster. Its rarity, beauty, and durability gave it symbolic and economic importance across cultures. While silver, copper, and iron found widespread use in tools and daily necessities, gold was reserved for temples, thrones, crowns, and coins. Its association with divinity, immortality, and wealth made it the ultimate store of value.
In global trade, gold became more than just a precious metal—it evolved into a universal medium of exchange, a unit of account, and a reserve of wealth. Whether in ancient Mesopotamia, medieval Europe, or modern-day financial markets, gold has been deeply interwoven with the dynamics of commerce and global economic power.
2. Gold in Early Civilizations and Trade Networks
2.1 Ancient Mesopotamia and Egypt
Records from Mesopotamia (around 3000 BCE) reveal the use of gold in temple offerings, jewelry, and early forms of trade settlement. In Egypt, gold mining in Nubia became a cornerstone of the pharaohs’ wealth. Egyptian traders exchanged gold for cedarwood from Lebanon, incense from Arabia, and lapis lazuli from Afghanistan.
2.2 India and China
India, often referred to as the “Golden Bird,” was historically one of the world’s largest consumers of gold. Gold was central to Hindu rituals, dowries, and wealth preservation. Ancient trade routes such as the Silk Road facilitated the flow of gold into China, where it was prized in ornaments and as tribute currency.
2.3 The Mediterranean World
For the Greeks and Romans, gold coinage was critical in organizing commerce across vast empires. The Roman aureus became an international currency, accepted in transactions stretching from Britain to Asia Minor. Roman conquest and expansion were often driven by the desire to secure gold mines and trading routes.
3. Gold as the Foundation of Monetary Systems
3.1 Emergence of Gold Coinage
The invention of standardized gold coins by the Lydians (7th century BCE) revolutionized trade. Coins allowed merchants and states to conduct transactions with a reliable measure of value. This innovation spread across civilizations, creating trust in cross-border exchanges.
3.2 Medieval Europe and Islamic Trade
Gold coinage resurfaced in medieval Europe with the Florentine florin and Venetian ducat, which dominated European and Mediterranean trade. Meanwhile, Islamic caliphates issued the gold dinar, which facilitated trans-Saharan trade in salt, slaves, and textiles. Gold mined in West Africa, especially from Mali and Ghana, fueled Mediterranean commerce and even influenced the rise of cities such as Timbuktu.
3.3 The Gold Standard Era
By the 19th century, gold became the backbone of international finance. The gold standard, formally adopted in Britain in 1821, linked national currencies directly to fixed amounts of gold. This system enabled stable exchange rates and fueled global trade expansion during the Industrial Revolution. The reliability of gold-backed currencies helped finance colonial empires, international investments, and the integration of global markets.
4. Gold and the Age of Exploration
4.1 The Spanish Conquest and the “Gold Rush”
The European Age of Exploration was driven largely by the pursuit of gold. The Spanish conquest of the Americas in the 16th century brought enormous quantities of gold and silver into Europe. Ships laden with bullion crossed the Atlantic, fueling European economies but also causing inflation known as the “Price Revolution.”
4.2 Global Trade Routes and Colonial Rivalries
Control of gold mines and trade routes became a key motive for colonization. The Portuguese, Dutch, and British expanded their empires to secure resources. Gold became not just a means of trade but a strategic tool in geopolitical rivalries, funding wars, navies, and the rise of mercantile powers.
5. Gold as a Symbol of Trust and Stability
5.1 Safe Haven Across Crises
In times of war, economic collapse, or inflation, gold retained value when paper money or credit systems failed. For example, during World War I and the Great Depression, individuals and nations turned to gold as the ultimate refuge.
5.2 Bretton Woods and the U.S. Dollar
After World War II, the Bretton Woods system pegged global currencies to the U.S. dollar, which in turn was tied to gold at $35 per ounce. This arrangement made gold the anchor of global trade and financial stability. Even after the U.S. ended dollar-gold convertibility in 1971, central banks continued to hold vast gold reserves as confidence assets.
6. Gold in Modern Global Trade
6.1 The Post-Gold Standard World
Although fiat currencies dominate today, gold still plays a critical role. Central banks across the world maintain gold reserves as part of their foreign exchange holdings. The International Monetary Fund (IMF) also holds significant gold stocks, underscoring its importance in global finance.
6.2 Gold in International Settlements
Even in the modern era, gold is sometimes used in bilateral trade agreements, particularly where currency trust issues arise. Countries facing sanctions or inflation often rely on gold to bypass traditional financial systems. For instance, gold has facilitated trade in energy and commodities among countries excluded from dollar-based systems.
6.3 Commodities and Investment
Gold remains one of the most actively traded commodities worldwide. Futures contracts, exchange-traded funds (ETFs), and bullion markets make it integral to global finance. In addition, gold jewelry and artifacts continue to represent cultural and social wealth in regions like India, the Middle East, and East Asia.
7. Cultural and Symbolic Dimensions of Gold in Trade
7.1 Gold Beyond Economics
Gold’s value is not purely economic—it embodies cultural, religious, and symbolic meanings. From wedding jewelry in India to lunar offerings in China, gold has deep cultural associations that sustain its demand and global trade relevance.
7.2 Festivals and Seasonal Demand
Global gold trade is strongly influenced by cultural events such as Indian weddings, Diwali, and Chinese New Year. Seasonal demand cycles reflect how gold straddles both commerce and tradition, shaping global pricing and trade flows.
8. Geopolitics and the Strategic Role of Gold
8.1 Central Banks and Reserve Power
Central banks worldwide are increasing gold holdings to reduce dependence on the U.S. dollar. Nations like China, Russia, and India have steadily added to their reserves, viewing gold as a hedge against geopolitical risks and currency volatility.
8.2 Gold in Sanctions and Trade Wars
Gold often functions as a sanctions-proof currency. Countries excluded from international banking systems, such as Iran or Venezuela, turn to gold to facilitate trade and preserve economic stability. This role underscores gold’s timeless utility in bypassing political and financial restrictions.
9. Gold in the Digital and Green Economy Era
9.1 Gold and Technology
Gold is not only a financial asset but also a key industrial metal. Its conductivity, malleability, and corrosion resistance make it vital in electronics, medical devices, and aerospace. This growing industrial use links gold directly to modern technological trade.
9.2 Gold-Backed Digital Currencies
With the rise of blockchain and digital finance, gold-backed cryptocurrencies and tokens are emerging as trade instruments. These combine the stability of gold with the efficiency of digital transfer, potentially reshaping global trade settlements.
9.3 Sustainability and Ethical Trade
Modern concerns about environmental impact and human rights in gold mining have reshaped trade policies. Initiatives like “Fairtrade Gold” and traceability systems aim to ensure that global gold trade aligns with sustainable development goals.
10. Conclusion: Gold’s Timeless Role in Global Trade
Gold’s journey through history reflects its dual nature as both a cultural symbol and an economic pillar. From ancient Egyptian temples to Wall Street vaults, from the Roman aureus to blockchain-backed tokens, gold has retained its ability to inspire trust, drive exchange, and preserve wealth.
In global trade, gold has been:
A medium of exchange connecting ancient empires.
A foundation for monetary systems under the gold standard.
A geopolitical tool shaping colonization and wars.
A safe haven asset during crises.
A cultural cornerstone sustaining demand across civilizations.
A modern commodity integral to finance, technology, and industry.
Even in a world dominated by fiat money, digital currencies, and advanced financial systems, gold remains indispensable. Its timeless role lies not just in its physical properties, but in the enduring human belief in its value. As global trade evolves in the 21st century—with digitalization, geopolitics, and sustainability shaping commerce—gold continues to shine as a bridge between tradition and innovation, ensuring its place in the heart of global exchange for centuries to come.
Nifty new ATH coming by OCT- 2025Buy nifty at 25k seems 25550 possible for this expiry & towards to new ATH .. Diwali blast 🤩🎯💥

NIfty should remain supported for bullish tallyNSE:NIFTY Any panic will be a buy, and should continue higher

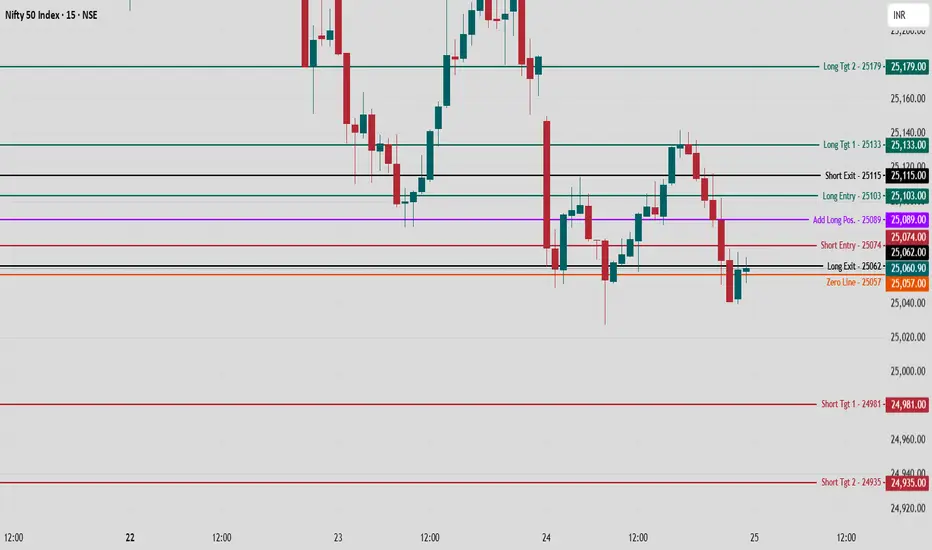
Nifty50 Index - Intraday Technical Analysis - 25 Sept., 2025NSE:NIFTY
Nifty 50 is consolidating near 25,061 after an initial drop, with price struggling to decisively reclaim key support-resistance zones.
Bullish Scenario (Long Logic)
Long Entry (25,103):
Enter above 25,103 as this level marks a breakout above recent supply and reclaims short-term moving averages, suggesting demand is returning after a pullback.
Consider aggressive adds above 25,089, leveraging momentum and tight stops for up-moves if the reversal holds.
Upside Targets:
Target 1: 25,133 – Prior high and supply area where profit-booking or resistance may emerge.
Target 2: 25,179 – Next supply zone, often coinciding with previous session resistance spikes and broader range highs.
Stop Loss:
Maintain stops just below 25,062 to minimize risk on failed breakouts.
Bearish Scenario (Short Logic)
Short Entry (25,074):
Go short below 25,074 as this breaks session support and re-enters bearish territory, with failure to sustain 15-min swing lows.
Downside Targets:
Target 1: 24,981 – Recent demand and bounce area, often where intraday covering may occur.
Target 2: 24,935 – Deeper support representing potential extension if selling accelerates.
Stop Loss:
Exiting shorts if Nifty sustains above 25,103 keeps losses tight if breakdown reverses quickly.
Neutral/Balanced Zone
Zero Line (25,057):
Market bias flips at this level. Above = buyers in control; below = sellers may drive a test of lower targets.
Sideways or low conviction action between 25,074 and 25,062 is high-risk for stop hunts and false moves.
Overall Structure
Monitor for breakout retests or quick reversal signs at mapped levels for best entries.
Both bull and bear strategies are clearly framed to respond to directional momentum or rapid reversals, with disciplined stop-loss positioning.
Intraday bias should adjust quickly at given levels, as Nifty’s tight range suggests a move may come with increased volume or news catalysts on the day.
24/sept/2025last set up was hit .
25330-25280 range.
dear retailers dont getting trapped.
25330 baove for call tgt-25380/25460/
25250 below for put tgt -25200/25100.
25000 is major support
two put setup
25250 elow
25000 elow
so dear retail traders call only above 25330
follow setup
not active than sit back relax

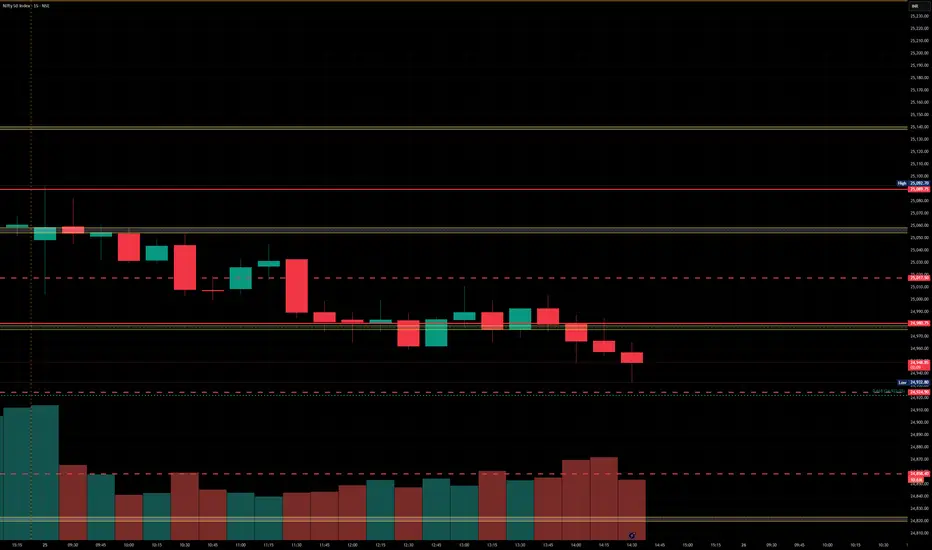
Nifty Analysis EOD – September 24, 2025 – Wednesday🟢 Nifty Analysis EOD – September 24, 2025 – Wednesday 🔴
Bears tighten grip as bulls lose ground near key supports
🗞 Nifty Summary
Nifty opened with a Gap Down of 38 points, extended losses by another 98 points, and broke below the previous day’s low, touching the crucial 25,048.75 level. A recovery attempt lifted the index to 25,115, but renewed selling dragged it back near the day’s lows. Despite a false breakdown attempt at IB Low, the afternoon saw recovery till 25,140, where bulls and bears clashed briefly. Eventually, bears regained control and pushed Nifty below 25,048.75, closing at 25,060.90, just off the day’s low.
The session was a roller-coaster ride, giving intraday traders multiple opportunities. Despite bulls’ mid-session efforts, the day ended decisively in the bears’ favor. Bigger picture: in just 9 sessions, the 400-point rally since 12th Sep has been wiped out, putting the index back at the breakout base of 25,115.
If 25,000–24,990 breaks, the next strong support lies at 24,915–24,890. On the upside, bulls must reclaim 25,115 to regain any meaningful grip.
🛡 5 Min Intraday Chart with Levels
🛡 Intraday Walk
Gap Down of 38 points, extended fall of 98 points → tested 25,048.75.
Sharp recovery to 25,115, but sell-off resumed.
False breakdown attempt below IB Low → recovery toward 25,140.
Bulls failed to push higher → bears dragged back below 25,048.75.
Closed weak at 25,060.90, near day’s low.
📉 Daily Time Frame Chart with Intraday Levels
🕯 Daily Candle Breakdown
Open: 25,109.20
High: 25,150.30
Low: 25,027.90
Close: 25,060.90
Change: −93.80 (−0.37%)
🏗️ Structure Breakdown
Red candle (Close < Open).
Body: ~51.85 points → bearish.
Range: ~122.40 points → moderate volatility.
Upper wick: ~41.10 points → rejection near 25,150.
Lower wick: ~29.45 points → buyers defended 25,030 weakly.
Close near lows → bearish dominance.
📚 Interpretation
Sellers took control early and maintained pressure.
Bulls defended 25,030 briefly but couldn’t sustain higher levels.
Strong rejection from 25,150 supply zone.
🕯Candle Type
Bearish continuation candle → confirms seller strength after prior indecision.
🛡 5 Min Intraday Chart
⚔️ Gladiator Strategy Update
ATR: 160.79
IB Range: 100.40 → Medium
Market Structure: ImBalanced
Trade Highlights:
10:30 Short Trade – Target Achieved (R:R 1:2.26)
12:10 Long Trade – Target Achieved (R:R 1:1.58)
13:45 Short Trade – Target Achieved (R:R 1:2.97)
📌 What’s Next? / Bias Direction
Resistance Zones: 25,085 · 25,115 · 25,140–25,165 · 25,240
Support Zones: 25,045–25,030 · 25,000–24,990 · 24,915–24,890
Bias remains bearish unless bulls reclaim 25,115–25,200. Breach of 25,000 may trigger stronger selling pressure toward 24,915.
📌 Support & Resistance Levels
Resistance Zones:
25085
25115
25140 ~ 25165
25240
Support Zones:
25048 ~ 25030
25000 ~ 24990
24915 ~ 24890
💡 Final Thoughts
Today’s session reminds us: “Markets can erase days of gains in hours – that’s why defense matters as much as offense.”
Respect levels, protect capital, and adapt to the changing momentum.
✏️ Disclaimer
This is just my personal viewpoint. Always consult your financial advisor before taking any action.
