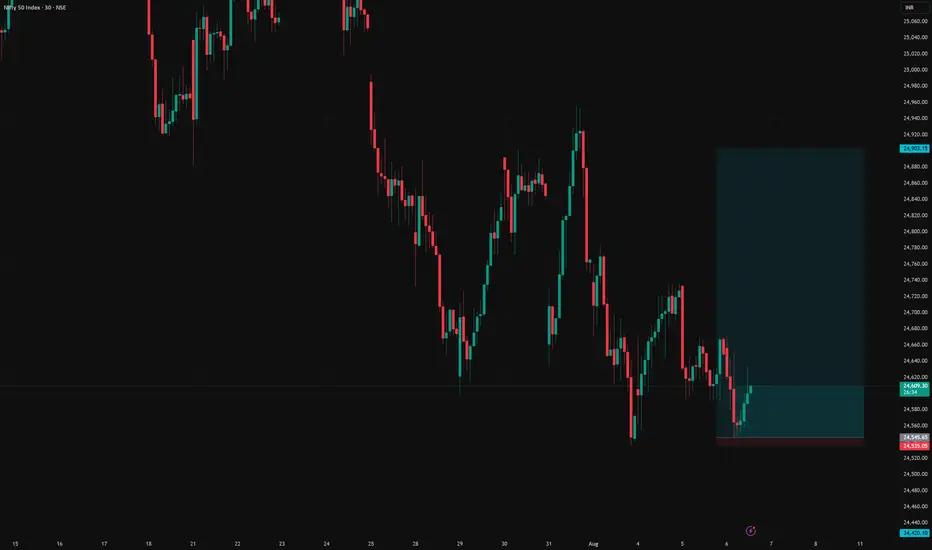
NIFTY spot long setupNifty spot long setup
Entry - 24546
Stop loss - 24535
Target - 24903
Risk Reward - 1:33
Trade ideas
NIFTY WAVE COUNTLast wave in Nifty 50 is on. We are right now in corrective phase. Fourth wave corrections are going on in the fifth primary wave, wait for the corrections to get over. Happy Trading.

$nifty50ok so alts all in position and waiting for dominace to nuke some mroe till then lets see whats up with our Nifty
rsi looks to be bottoming just a little volume and we reclaim above line and rsi curls up
little bit more for up up and away may or may not sweet the 200

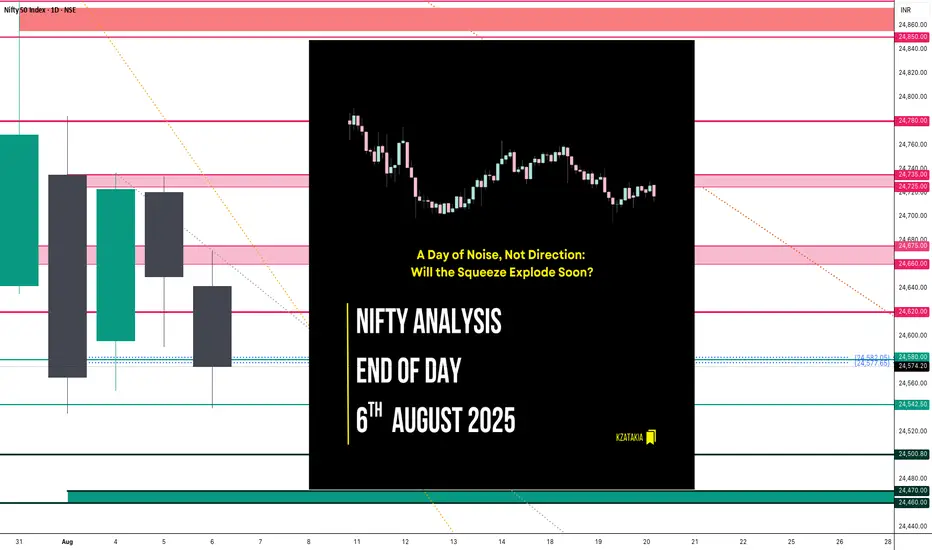
Nifty Analysis EOD – August 6, 2025 – Wednesday 🟢 Nifty Analysis EOD – August 6, 2025 – Wednesday 🔴
A Day of Noise, Not Direction: Will the Squeeze Explode Soon?
Nifty started flat with indecisive vibes, struggling initially around the 24,660 ~ 24,675 zone. After multiple failed attempts to hold, it slipped toward 24,580 — a cluster of PDL + S1 + Key Support — and broke below, forming the IB Low.
A quick bounce followed, but the index was firmly rejected near the VWAP + CPR + Fib zone, pushing it to a new day low at 24,544. Repeated intraday bounces faced selling pressure around 24,620, while 24,540 provided solid support — creating a tight intraday range.
Despite a perfect CPR setup for breakout, the market moved within just 132 points, the narrowest range in the last 4 sessions. A compression phase is building; breakout traders may soon get their moment.
📉 5 Min Time Frame Chart with Intraday Levels
🗣 Voice of the Intraday Option Buyer
Trend direction flipped multiple times — bearish to bullish and vice versa.
PDL + S1 zone experienced repeated fakeouts.
Low conviction moves on both sides frustrated momentum setups.
RBI event also not enough strong or trigger to guide directional bias.
Bank Nifty broke IB Low → IB High, closed strong; Nifty stayed muted.
Weekly expiry ahead — theta decay took control.
Many traders, including myself, anticipated a double inside bar breakout — but the trap continued.
Last 4 sessions (since Aug 1) have been painful for intraday option buyers — but it's all part of the game.
📉 Daily Time Frame Chart with Intraday Levels
🕯️ Daily Candle Breakdown
Open: 24,641.35
High: 24,671.40
Low: 24,539.20
Close: 24,574.20
Change: −75.35 (−0.31%)
Candle Structure:
Real Body: Red candle (67.15 pts)
Upper Wick: 30.05 pts
Lower Wick: 35.00 pts
Interpretation:
Attempted upside early on but couldn’t hold.
Both wicks show intraday tug-of-war; red close confirms sellers still in control.
Repeated rejection from 24,660–24,675 highlights weak bullish attempts.
Candle Type:
Bearish indecision candle — resembles an Inverted Hammer, indicating weakness despite dip buying attempts.
🔍 Nifty Short-Term View – As of August 6, 2025
Last 5 sessions show directional fatigue and failed bullish attempts above 24,700.
Two consecutive inside bars signal tight range and pending breakout.
Lower closes and long lower wicks = sellers dominate, but buyers defend dips.
Break below 24,535 = fresh selling.
Close above 24,660 = potential short-covering rally.
📌 Conclusion:
Nifty is coiling — a strong breakout may soon end this sideways-to-weak grind.
🛡 5 Min Intraday Chart
⚔️ Gladiator Strategy Update
ATR: 195.66
IB Range: 91.70 → Medium
Market Structure: Balanced
Trade Summary:
⏱ 10:35 AM – Short Entry → SL Hit
⏱ 12:15 PM – Long Entry → SL Hit
📏 Today's CPR Setup presenting...
Value Relationship: Inside Value → Breakout-Ready
Avg CPR Width: 37.54
Today’s CPR Width: 8.10 (🟠 21.58%)
CPR Type: Narrow → Perfect setup for big expansion
⚠️ Today’s setup didn’t deliver, but backtests show such narrow CPRs often explode in the following session.
📌 Support & Resistance Levels
🔼 Resistance Zones:
24,620
24,660 ~ 24,675
24,725 ~ 24,735
24,780 ~ 24,795
24,860 ~ 24,880
🔽 Support Zones:
24,542 ~ 24,535
24,500
24,470 ~ 24,460
🧠 Final Thoughts
The market is in consolidation mode with narrowing range. The double inside bar setup points to an imminent move — be prepared for a breakout trade soon. Don’t lose patience; big days often follow tough ones.
🛡 Disclaimer
This analysis is shared for educational purposes only. It is not trading advice. Please consult your financial advisor before making any trading decisions. Always trade with proper risk management.
Nifty levels - Aug 07, 2025Nifty support and resistance levels are valuable tools for making informed trading decisions, specifically when combined with the analysis of 5-minute timeframe candlesticks and VWAP. By closely monitoring these levels and observing the price movements within this timeframe, traders can enhance the accuracy of their entry and exit points. It is important to bear in mind that support and resistance levels are not fixed, and they can change over time as market conditions evolve.
The dashed lines on the chart indicate the reaction levels, serving as additional points of significance to consider. Furthermore, take note of the response at the levels of the High, Low, and Close values from the day prior.
We hope you find this information beneficial in your trading endeavors.
* If you found the idea appealing, kindly tap the Boost icon located below the chart. We encourage you to share your thoughts and comments regarding it.
Wishing you success in your trading activities!

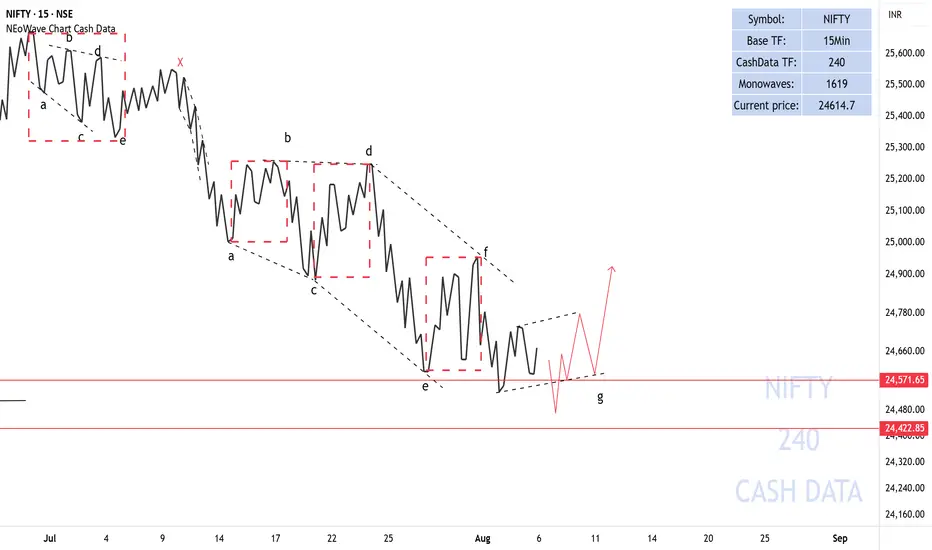
Forecasting the Movement of NIFTY50As previously mentioned, the NIFTY50 index is in the process of completing a diametric pattern. The news of the U.S. imposing tariffs on imports from India has already impacted the chart. Therefore, I believe the g-wave of the diametric will transform into a reverse contracting triangle, and the anticipated bullish correction, which I discussed earlier, will take shape in the NIFTY50.
Note:
If the U.S. imposes significantly heavier tariffs than the market expects, the g-wave may become larger.
Good luck
NEoWave Chart
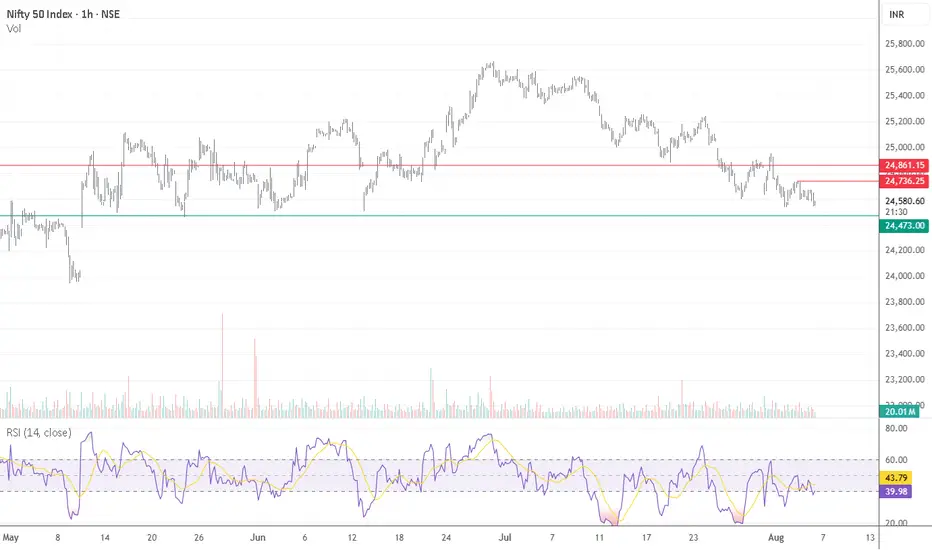
Nifty 50 – Immediate Trend Analysis (Hourly Chart)Nifty 50 – Immediate Trend Analysis (Hourly Chart)
On the hourly chart, Nifty 50 is exhibiting a clear downtrend, forming a pattern of lower highs and lower lows—signaling weakness in the immediate term.
The index has now approached a crucial support zone, which held strong multiple times during May and June, leading to a notable upside reversal in the past. This makes the current level a key inflection point.
If this support level holds, a short-term bounce is likely.
However, a break below this zone could accelerate the decline, potentially taking the index quickly towards the 24,000 level.
Key Takeaway:
Monitor this support zone closely for confirmation of a bounce or a breakdown to position accordingly.
#Nifty50 #NiftyAnalysis #TechnicalAnalysis #StockMarketIndia #NiftySupport #HourlyChart #Downtrend #MarketUpdate #NSE #IndexWatch #TradingStrategy #BreakdownOrBounce #PriceAction #ChartAnalysis #NiftyLevels
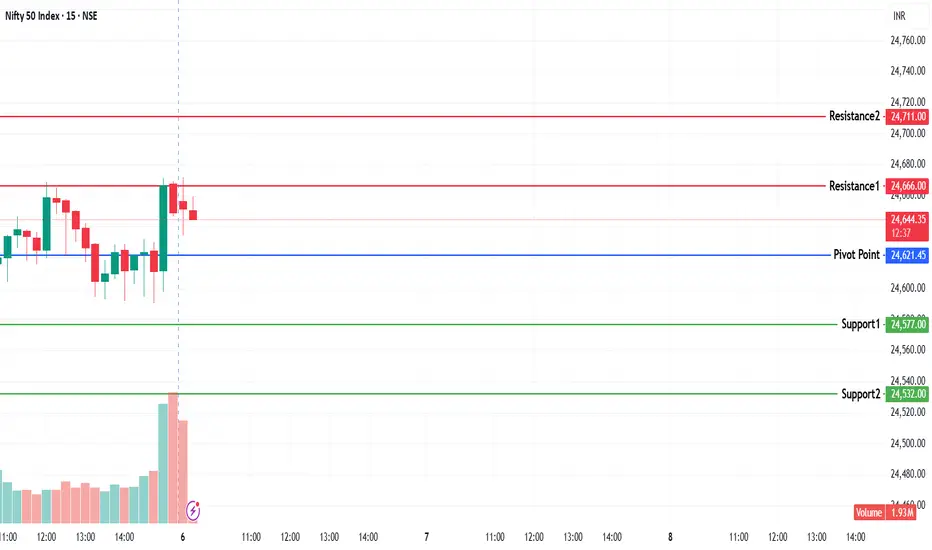
NIFTY KEY LEVELS FOR 06.08.2025NIFTY KEY LEVELS FOR 06.08.2025
If the candle stays above the pivot point, it is considered a bullish bias; if it remains below, it indicates a bearish bias. Price may reverse near Resistance 1 or Support 1. If it moves further, the next potential reversal zone is near Resistance 2 or Support 2. If these levels are also broken, we can expect the trend.
If the range(R2-S2) is narrow, the market may become volatile or trend strongly. If the range is wide, the market is more likely to remain sideways
📢 Disclaimer
I am not a SEBI-registered financial adviser.
The information, views, and ideas shared here are purely for educational and informational purposes only. They are not intended as investment advice or a recommendation to buy, sell, or hold any financial instruments.
Please consult with your SEBI-registered financial advisor before making any trading or investment decisions.
Trading and investing in the stock market involves risk, and you should do your own research and analysis. You are solely responsible for any decisions made based on this research.
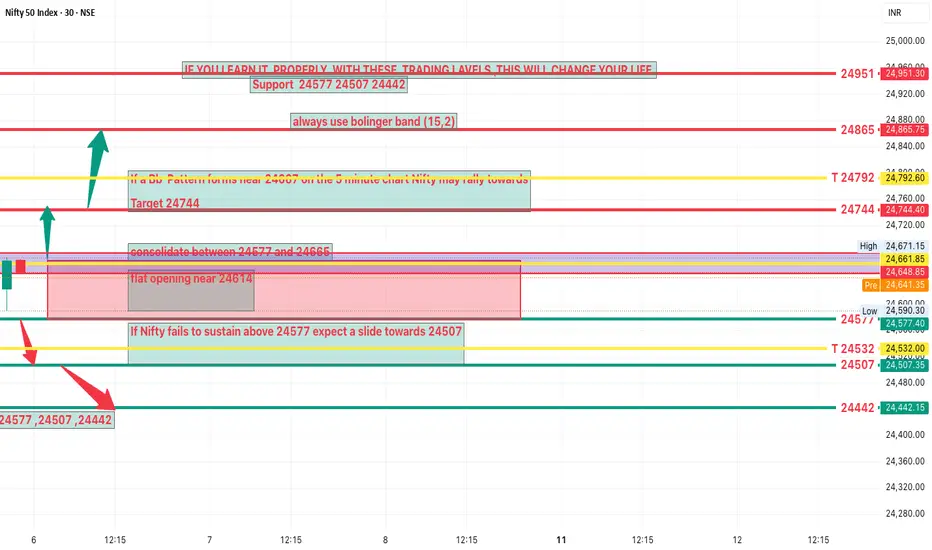
NIFTY Analysis 6 AUGUST, 2025 ,Morning update at 9 amDue to uncertainty in US tariffs on India short covering is unlikely
This global factor could lead to a flat opening near 24614
Expected Intraday Range
Likely to consolidate between 24577 and 24665
Upside Scenario
If a bb Pattern forms near 24666 on the 5 minute chart Nifty may rally towards
Target 24746
Downside Scenario
If Nifty fails to sustain above 24577 expect a slide towards
Support 24507
Targets achieved ni NIFTY 50 THE RESULT
Follow for more Simple And accurate swing analysis on Indices, Currency, Commodities.
Targets Achieved in NIFTY 50 THE RESULT
Follow for more Simple And accurate swing analysis on Indices, Currency, Commodities.

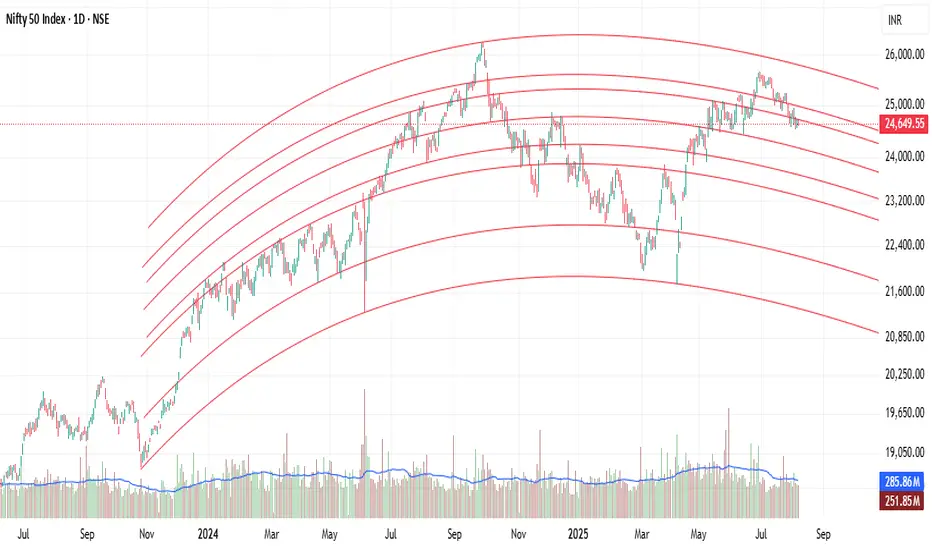
How curved line gives better ideaThe momentum slope of the chart changes constantly over time, so it is not possible to find the next top using simple trend lines.
So it may be a better idea to use curved lines instead of straight lines.
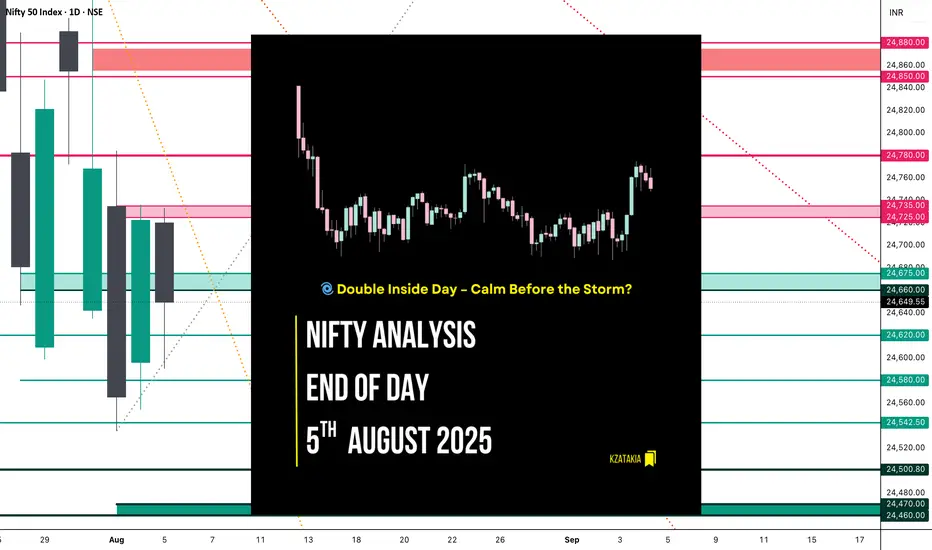
Nifty Analysis EOD – August 5, 2025 – Tuesday 🟢 Nifty Analysis EOD – August 5, 2025 – Tuesday 🔴
🌀 Double Inside Day – Calm Before the Storm?
📊 Nifty Summary
In the wind of negative news, yet Nifty starts neutral at the resistance zone of 24,725 ~ 24,735 but was unable to hold there and fell 140 points within the first 45 minutes.
After this initial sell-off, Nifty found support around 24,590, which coincided with yesterday's Fib 0.786 level, R1, and Previous Week Low (PWL).
These levels were well-defended throughout the session. Near the end, the index recovered ~80 points and closed at 24,649.55, close to yesterday’s Fib 0.5.
Can we consider today's move a retracement or a pullback of yesterday's move?
Same as Monday, today’s action stayed inside the previous session’s range, forming an Inside Bar. Now it appears as a Double Inside Bar on the daily chart.
📉 5 Min Time Frame Chart with Intraday Levels
📉 Daily Time Frame Chart with Intraday Levels
🕯 Daily Candle Breakdown
Open: 24,720.25
High: 24,733.10
Low: 24,590.30
Close: 24,649.55
Change: −73.20 (−0.30%)
Candle Structure Breakdown:
🔴 Red Candle (Close < Open):
24,720.25 − 24,649.55 = 70.70 points
🔼 Upper Wick:
24,733.10 − 24,720.25 = 12.85 points
🔽 Lower Wick:
24,649.55 − 24,590.30 = 59.25 points
Interpretation:
After a flat open, the index tried to move higher but faced resistance near 24,730, then reversed.
Buying interest was seen near the 24,590 zone, but sellers remained in control.
It closed below the open with a decent lower wick, indicating some buying support but overall weakness.
Candle Type:
🕯 A pullback candle with a moderate real body and long lower wick – suggests buyers attempted to support the fall, but sellers dominated.
🛡 5 Min Intraday Chart
⚔️ Gladiator Strategy Update
ATR: 202.71
IB Range: 139.95 → 🟠 Medium
Market Structure: Balanced
Trade Summary:
❌ No entry triggered by system
📌 Support & Resistance Levels
🔼 Resistance Zones:
24,725 ~ 24,735
24,780 ~ 24,795
24,860 ~ 24,880
🔽 Support Zones:
24,675 ~ 24,660
24,620
24,542 ~ 24,535
24,500
24,470 ~ 24,460
🧠 Final Thoughts
Today's double inside bar structure signals contraction and indecision — markets are waiting for a decisive breakout.
“The tighter the coil, the bigger the breakout.”
Keep an eye on these tight ranges. Patience before power!
✏️ Disclaimer
This is just my personal viewpoint. Always consult your financial advisor before taking any action.
Nifty 50 support and resistance for 6th August We have plotted Nifty 50 resistance and support for 6th Aug.

Nifty : Bearish EMA Crossover Loading… Watch Out...The 20 EMA is inching dangerously close to crossing below the 50 EMA on the daily chart — a key technical zone that often signals the start of a short-term downtrend.
📉 What this setup could mean:
Momentum is fading, and bulls are losing grip.
A confirmed crossover may invite fresh selling pressure.
Price structure already showing signs of weakness.
🔍 What to watch:
A clear 20 EMA < 50 EMA crossover with a bearish candle close.
Increased volume on red days could validate the move.
Retest of key support zones if crossover plays out.
⚠️ This is a high-probability setup, but not a confirmation yet. Keep alerts set — the next few candles could decide the trend!
📢📢📢
If my perspective changes or if I gather additional fundamental data that influences my views, I will provide updates accordingly.
Thank you for following along with this journey, and I remain committed to sharing insights and updates as my trading strategy evolves. As always, please feel free to reach out with any questions or comments.
Other posts related to this particular position and scrip, if any, will be attached underneath. Do check those out too.
Disclaimer : The analysis shared here is for informational purposes only and should not be considered as financial advice. Trading in all markets carries inherent risks, and past performance is not indicative of future results. It’s essential to conduct your own research and assess your risk tolerance before making any investment decisions. The views expressed in this analysis are solely mine. It’s important to note that I am not a SEBI registered analyst, so the analysis provided does not constitute formal investment advice under SEBI regulations.

Nifty 50 Present ViewsI am trying to publish my opinion about the BMI which is Nifty 50 based on my current understanding and knowledge of markets.
Assumptions are as follows:
Present running QTR is Jul 25 to Sep 25 and year on year comparison of Jul 24 to Sep 24. And the challange was by Apr 25 to Jun 25.
Considering present available data I have tried to highlight best possible scenarios.
Personal Views: Still expecting a consolidaton

Nifty levels - Aug 06, 2025Nifty support and resistance levels are valuable tools for making informed trading decisions, specifically when combined with the analysis of 5-minute timeframe candlesticks and VWAP. By closely monitoring these levels and observing the price movements within this timeframe, traders can enhance the accuracy of their entry and exit points. It is important to bear in mind that support and resistance levels are not fixed, and they can change over time as market conditions evolve.
The dashed lines on the chart indicate the reaction levels, serving as additional points of significance to consider. Furthermore, take note of the response at the levels of the High, Low, and Close values from the day prior.
We hope you find this information beneficial in your trading endeavors.
* If you found the idea appealing, kindly tap the Boost icon located below the chart. We encourage you to share your thoughts and comments regarding it.
Wishing you success in your trading activities!

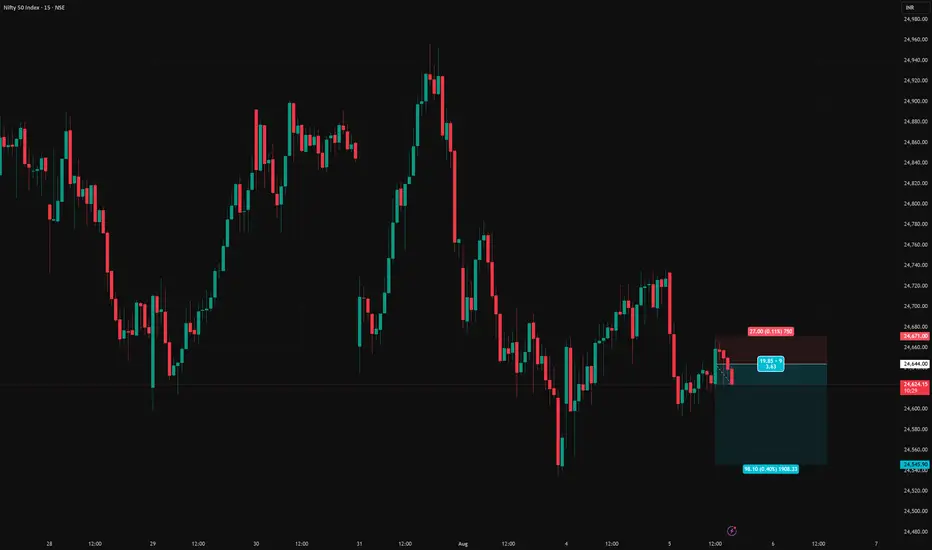
NIFTY short setupNifty short setup
Entry - 24644.00
Stop loss - 24671.00
Target - 24545.90
Risk Reward - 1:3.6
#NIFTY50 View for 5th AugNSE:NIFTY We see Nifty cycle from April low have ended, and currently correcting the rally. The first leg of the rally seem to have ended and currently should bounce in 3 waves higher and should potentially reverse for one more leg lower.And where it can find some potential buyers. We don't recommend Selling.
Some stocks are showing potential reversal signal like NSE:INDIANB Indian bank, NSE:PIDILITIND Pidilite, NSE:TATAPOWER Tata Power, NSE:TATASTEEL Tata steel to suggest the above view.

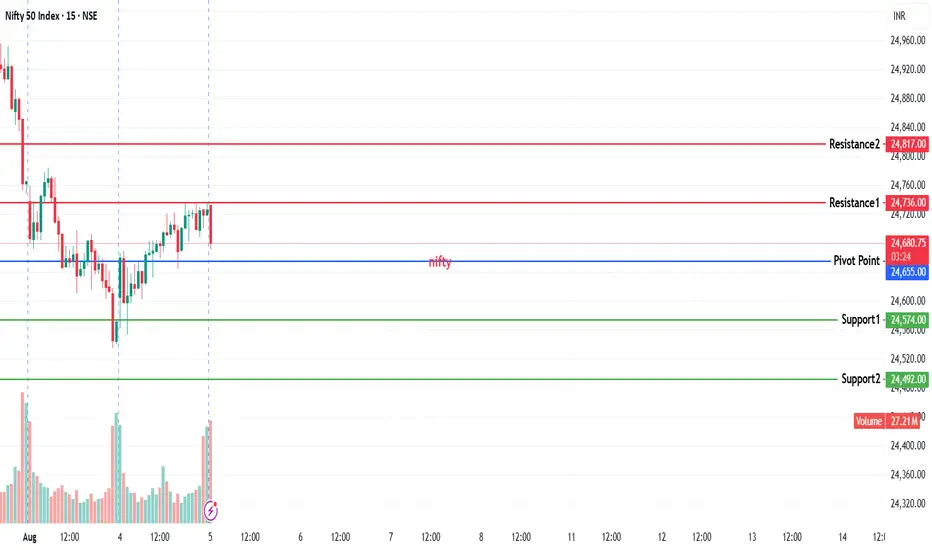
NIFTY KEY LEVELS FOR 05.08.2025NIFTY KEY LEVELS FOR 05.08.2025
If the candle stays above the pivot point, it is considered a bullish bias; if it remains below, it indicates a bearish bias. Price may reverse near Resistance 1 or Support 1. If it moves further, the next potential reversal zone is near Resistance 2 or Support 2. If these levels are also broken, we can expect the trend.
If the range(R2-S2) is narrow, the market may become volatile or trend strongly. If the range is wide, the market is more likely to remain sideways
📢 Disclaimer
I am not a SEBI-registered financial adviser.
The information, views, and ideas shared here are purely for educational and informational purposes only. They are not intended as investment advice or a recommendation to buy, sell, or hold any financial instruments.
Please consult with your SEBI-registered financial advisor before making any trading or investment decisions.
Trading and investing in the stock market involves risk, and you should do your own research and analysis. You are solely responsible for any decisions made based on this research.
Nifty trend directionNifty 24722 is showing inside bar pattern .resistance at 767 and 844. If high goes greater than yesterday high if 736 , wait for candle to reverse and fall below 736 for shorting opportunities with sl around near mentioned resistance.

Intraday Setup for Tuesday 05 August Market Structure Over Sentiment
The market is currently trading in a confusing zone, especially with negative global sentiment in the backdrop. But remember — that sentiment only matters if the Friday hourly low breaks. Until then, stay technical, stay objective
🧭 Market Structure Overview:
Daily Trend: Continues to form lower lows, indicating weakness in the broader trend.
Hourly Timeframe: Trading near key support, forming a triple bottom at 24,500 – an important level to watch for breakdown or bounce.
5-Minute Chart (Intraday): Showing signs of higher highs, suggesting short-term buying interest.
Key Intraday Levels (Nifty):
24,800 – Critical Resistance Zone
➤ Watch Price Action Closely Here
If reversal comes from this level, it may offer a high-probability shorting opportunity.
A breakout above 24,800 is tricky – may trigger false moves, so wait for confirmation.
24,640 – Scalp Short Opportunity
➤ A good level for a quick short, provided the momentum supports it.
Ideal for scalpers looking for small, sharp moves.
Final Note:
Don’t get influenced by noise. Let the structure guide your trades. As long as Friday’s hourly low holds, bulls have a reason to defend. Below that — bears take the lead.

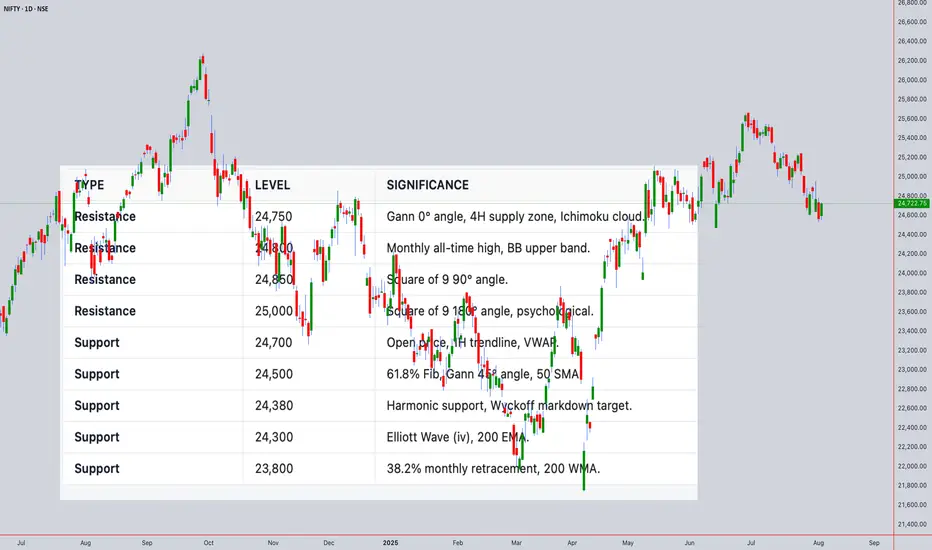
NIFTY50 Closing Price: ₹24,722.75 (4th Aug 2025, 02:00PM UTC+4)Comprehensive Technical Analysis for NIFTY50
world wide web shunya trade
Closing Price: ₹24,722.75 (4th Aug 2025, 02:00PM UTC+4)
Time Frames:
Intraday: 5M, 15M, 30M, 1H, 4H
Swing: 4H, Daily, Weekly, Monthly
1. Japanese Candlestick Analysis
Intraday (5M-4H)
4H: Bearish Engulfing at 24,722.75 signals rejection of highs.
1H: Dark Cloud Cover below 24,750 confirms weakness.
30M/15M: Shooting Stars at 24,720 indicate exhaustion.
5M: Three Black Crows pattern suggests strong bearish momentum.
Outlook: Bearish reversal likely if 24,700 breaks.
Swing (4H-Monthly)
Daily: Gravestone Doji at 24,722.75 warns of trend exhaustion.
Weekly: Bearish Harami after 3-week rally signals distribution.
Monthly: Long-legged Doji at all-time highs (24,800) indicates indecision.
2. Harmonic Patterns
Intraday
4H/1H: Bearish Butterfly completing at 24,722.75 (D-point).
PRZ: 24,700–24,750 (127.2% XA + 161.8% BC).
30M: Bullish Crab forming at 24,600 (secondary setup).
Swing
Daily: Bearish Gartley near 24,750 (78.6% XA retracement).
Weekly: Potential Bullish Bat at 24,500 if correction extends.
3. Elliott Wave Theory
Intraday
4H: Wave 5 of impulse cycle peaked at 24,722.75.
Structure: Completed 5-wave sequence from 24,200 → 24,722.75.
Corrective Phase: ABC pullback targeting 24,500 (Wave A).
1H: Sub-wave (v) ending with RSI divergence.
Swing
Daily: Wave 3 of primary bull cycle nearing completion at 24,750.
Weekly: Wave (iii) of larger impulse, expecting Wave (iv) correction to 24,300.
Monthly: Wave V of multi-year bull run, nearing major resistance at 24,800.
4. Wyckoff Theory
Intraday
Phase: Distribution (after markup from 24,200 → 24,722.75).
Signs: High volume at 24,722.75 (supply), failed upthrust above 24,750.
Schematic: Phase C (markdown) initiating.
Swing
Daily: Late Markup → Distribution at 24,750.
Weekly: Accumulation completed at 23,500; now in Markup but showing signs of exhaustion.
5. W.D. Gann Theory
Time Theory
Intraday: Key reversal windows:
UTC+4: 10:00–12:00 (resistance test), 14:00–16:00 (trend reversal).
Swing:
Daily: 8th Aug (4 days from close) for time squaring.
Weekly: 12th Aug (1 week) for cycle turn.
Square of 9
24,722.75 → Resistance Angles:
0° (24,750), 90° (24,850), 180° (25,000).
Support: 45° (24,500), 315° (24,250).
Angle Theory
4H Chart: 1x1 Gann Angle (45°) from 24,200 low at 24,500. Price overextended.
Daily Chart: 2x1 Angle (63.75°) at 24,722.75 acting as resistance.
Squaring of Price & Time
Price Range: 24,200 → 24,722.75 (522.75 points).
Time Squaring: 522.75 hours from 24,200 low → 24,750 resistance.
Ranges in Harmony
Primary Range: 24,000–25,000 (1,000 points).
50% Retracement: 24,500 (critical support).
61.8% Retracement: 24,380.
Secondary Range: 24,500–24,750 (250 points).
Price & Time Forecasting
Intraday Targets:
Short-Term: 24,500 (61.8% Fib).
Extension: 24,380 (Gann 45° angle).
Swing Targets:
Weekly: 24,300 (Wave (iv) target).
Monthly: 23,800 (38.2% retracement of entire bull run).
6. Ichimoku Kinko Hyo
Intraday (4H)
Cloud (Kumo): Price below Kumo (bearish).
Tenkan-sen: 24,700 (flat, resistance).
Kijun-sen: 24,650 (support).
Chikou Span: Below price (confirms bearish momentum).
Swing (Daily)
Cloud: Thick cloud resistance at 24,750–24,800.
Tenkan/Kijun: Bearish crossover at 24,700.
7. Indicators
Intraday
RSI (14): 68 (4H) → Overbought; divergence at highs.
Bollinger Bands: Price tagging upper band (24,750); contraction signals volatility.
VWAP: 24,680 (acting as dynamic resistance).
Moving Averages:
50 SMA: 24,600 (support).
200 EMA: 24,400 (major support).
Swing
Daily RSI: 72 (overbought, divergence).
Weekly BB: Upper band at 24,800 (resistance).
Monthly VWAP: 23,500 (major support).
200 WMA: 22,800 (long-term bull support).
Synthesized Forecast
Intraday (Next 24H)
Bearish Scenario (High Probability):
Trigger: Break below 24,700 (1H close).
Targets: 24,500 (T1), 24,380 (T2).
Timeline: 8–12 hours (UTC+4 22:00–02:00).
Bullish Scenario (Low Probability):
Trigger: Sustained close above 24,750.
Target: 24,850 (Gann 90° angle).
Swing (1–4 Weeks)
Bearish Scenario:
Targets: 24,300 (Wave (iv)), 23,800 (38.2% retracement).
Timeline: 5–10 trading days.
Bullish Scenario:
Trigger: Close above 24,800.
Target: 25,200 (Gann 180° angle).
For those interested in further developing their trading skills based on these types of analyses, consider exploring the mentoring program offered by Shunya Trade.(world wide web shunya trade)
I welcome your feedback on this analysis, as it will inform and enhance my future work.
Regards,
Shunya.Trade
world wide web shunya trade
⚠️ Disclaimer: This post is educational content and does not constitute investment advice, financial advice, or trading recommendations. The views expressed here are based on technical analysis and are shared solely for informational purposes. The stock market is subject to risks, including capital loss, and readers should exercise due diligence before investing. We do not take responsibility for decisions made based on this content. Consult a certified financial advisor for personalized guidance.