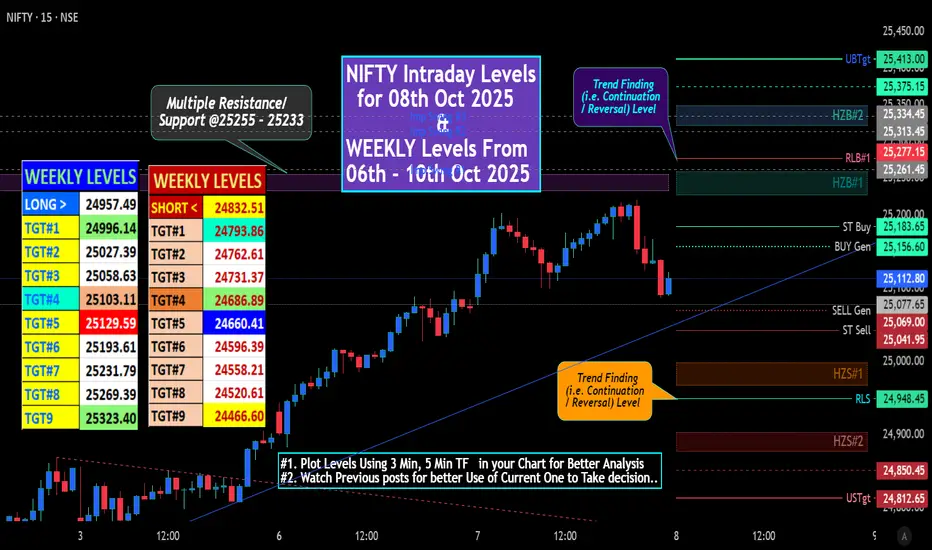
NIFTY Intraday & sWING Levels for 08th Oct 2025NIFTY CLOSES @ 25108 only 5 Points ABOVE Mentioned WEEKY TGT#4 (@ 25103) Level. Can Say Level works.
# "WEEKLY Levels" mentioned in BOX format.
^^^^^^^ Plot Levels Using 3 Min, 5 Min Time frame in your Chart for Better Analysis ^^^^^^^
L#1: If the candle crossed & stays above the “Buy Gen”, it is treated / considered as Bullish bias.
L#2: Possibility / Probability of REVERSAL near RLB#1 & UBTgt
L#3: If the candle stays above “Sell Gen” but below “Buy Gen”, it is treated / considered as Sidewise. Aggressive Traders can take Long position near “Sell Gen” either retesting or crossed from Below & vice-versa i.e. can take Short position near “Buy Gen” either retesting or crossed downward from Above.
L#4: If the candle crossed & stays below the “Sell Gen”, it is treated / considered a Bearish bias.
L#5: Possibility / Probability of REVERSAL near RLS#1 & USTgt
HZB (Buy side) & HZS (Sell side) => Hurdle Zone,
*** Specialty of “HZB#1, HZB#2 HZS#1 & HZS#2” is Sidewise (behaviour in Nature)
Rest Plotted and Mentioned on Chart
Color code Used:
Green =. Positive bias.
Red =. Negative bias.
RED in Between Green means Trend Finder / Momentum Change
/ CYCLE Change and Vice Versa.
Notice One thing: HOW LEVELS are Working.
Use any Momentum Indicator / Oscillator or as you "USED to" to Take entry.
⚠️ DISCLAIMER:
The information, views, and ideas shared here are purely for educational and informational purposes only. They are not intended as investment advice or a recommendation to buy, sell, or hold any financial instruments. I am not a SEBI-registered financial adviser.
Trading and investing in the stock market involves risk, and you should do your own research and analysis. You are solely responsible for any decisions made based on this research.
"As HARD EARNED MONEY IS YOUR's, So DECISION SHOULD HAVE TO BE YOUR's".
Do comment if Helpful .
In depth Analysis will be added later
Trade ideas
Nifty levels - Oct 08, 2025Nifty support and resistance levels are valuable tools for making informed trading decisions, specifically when combined with the analysis of 5-minute timeframe candlesticks and VWAP. By closely monitoring these levels and observing the price movements within this timeframe, traders can enhance the accuracy of their entry and exit points. It is important to bear in mind that support and resistance levels are not fixed, and they can change over time as market conditions evolve.
The dashed lines on the chart indicate the reaction levels, serving as additional points of significance to consider. Furthermore, take note of the response at the levels of the High, Low, and Close values from the day prior.
We hope you find this information beneficial in your trading endeavors.
* If you found the idea appealing, kindly tap the Boost icon located below the chart. We encourage you to share your thoughts and comments regarding it.
Wishing you success in your trading activities!

Nifty : Expecting a short term retraceMarket is kind of over-extended after the bullish move which happened in the past few days. So a retrace is there on the cards anytime soon. Hence I'll be a bit cautious about taking fresh positions until that pullback happens and we have a confirmation for the rally to continue.
📢📢📢
If my perspective changes or if I gather additional fundamental data that influences my views, I will provide updates accordingly.
Thank you for following along with this journey, and I remain committed to sharing insights and updates as my trading strategy evolves. As always, please feel free to reach out with any questions or comments.
Other posts related to this particular position and scrip, if any, will be attached underneath. Do check those out too.
Disclaimer : The analysis shared here is for informational purposes only and should not be considered as financial advice. Trading in all markets carries inherent risks, and past performance is not indicative of future results. It’s essential to conduct your own research and assess your risk tolerance before making any investment decisions. The views expressed in this analysis are solely mine. It’s important to note that I am not a SEBI registered analyst, so the analysis provided does not constitute formal investment advice under SEBI regulations.

Power of ReservesIntroduction: The Invisible Backbone of Global Trade
Behind every strong economy and stable currency lies an invisible force — national reserves. These reserves act as a financial cushion, ensuring stability during crises, boosting investor confidence, and influencing trade decisions worldwide. Whether it’s foreign exchange reserves, gold holdings, or sovereign wealth funds, each component plays a crucial role in determining a nation’s economic resilience and trading strength.
In the dynamic world of global trade, reserves aren’t just numbers sitting in a central bank’s vault. They dictate currency stability, trade competitiveness, and investment flows. Countries with robust reserves — like China, Japan, or Switzerland — often enjoy stronger bargaining power in global markets. On the other hand, nations with weak reserves face currency volatility, trade deficits, and limited import capacity.
This article explores in depth how reserves impact trading — both at the national and global levels, dissecting their role in monetary policy, currency valuation, investor sentiment, and international market behavior.
1. Understanding Reserves: The Foundation of Economic Strength
Reserves are assets held by a country’s central bank or monetary authority to support its currency and meet its international payment obligations. They usually include:
Foreign Currency Assets: USD, Euro, Yen, Pound, and other convertible currencies.
Gold Reserves: Stored as bullion or certificates to hedge against inflation and currency devaluation.
Special Drawing Rights (SDRs): Allocated by the IMF to provide liquidity.
Reserve Position in the IMF: Represents the country's claim on the IMF.
The primary purpose of maintaining reserves is to ensure financial stability, manage exchange rates, and support global trading obligations. For traders, investors, and policymakers, reserve data offers a mirror reflection of a nation’s economic strength and its ability to handle global trade shocks.
2. Reserves and Currency Stability: The Heartbeat of Trading
In global trading, currency stability is vital. A volatile currency disrupts exports, imports, and capital flows. Strong reserves enable central banks to intervene in the foreign exchange market — buying or selling currencies to stabilize exchange rates.
Example:
If a country’s currency is depreciating rapidly, its central bank can sell foreign reserves (like USD) to buy its domestic currency.
This reduces depreciation pressure, boosts confidence, and prevents inflation spikes.
Conversely, if the currency appreciates too much (hurting exports), the bank can buy foreign assets to weaken it. Thus, reserves act as the main defense mechanism against unpredictable market movements.
For traders, stable currencies mean lower hedging costs, predictable returns, and fewer risks. Therefore, countries with high reserves attract more trade deals, foreign investments, and cross-border contracts.
3. Impact on Trade Balance and Import-Export Dynamics
A country’s trade balance — the difference between exports and imports — is directly affected by its reserves.
High Reserves: Allow countries to import essential goods even during economic downturns or geopolitical tensions. It gives importers confidence that the country can pay for foreign goods and services.
Low Reserves: Limit import capacity, create shortages, and increase import costs due to weaker currency value.
Export Competitiveness:
Countries with healthy reserves can manage their currency strategically to maintain export competitiveness. For instance:
China often maintains large reserves to control yuan’s appreciation, keeping exports cheaper and more attractive in global markets.
India, with around $650 billion in reserves, uses them to manage the rupee’s volatility, ensuring exporters remain globally competitive.
Import Stability:
Nations with ample reserves can absorb shocks from rising oil prices, commodity fluctuations, or sanctions. This helps in keeping domestic inflation low, sustaining purchasing power, and ensuring smooth trading operations.
4. Reserves and Investor Confidence in Global Markets
Foreign investors closely monitor a country’s reserve position before committing capital. Strong reserves signal that:
The country can handle external debt payments.
There is low default risk.
The currency is stable, and the economy is resilient to shocks.
As a result, foreign direct investment (FDI) and portfolio inflows increase, strengthening both the capital market and trade.
For example:
Japan and Switzerland are considered safe havens because of their massive reserves and stable currencies.
Conversely, countries like Sri Lanka or Pakistan, with low reserves, face capital flight and currency depreciation, discouraging investors.
Thus, reserves serve as a trust factor — the larger they are, the higher the global confidence in that economy’s trade and investment potential.
5. The Role of Gold Reserves: The Traditional Guardian of Value
Even in today’s digital economy, gold remains a timeless store of value in national reserves. Central banks hold gold because it:
Retains value during inflation or currency crises.
Provides diversification away from fiat currencies.
Acts as a safe asset when geopolitical risks or trade wars escalate.
Gold reserves indirectly influence trading by backing currency credibility. For instance:
In times of global uncertainty, investors flock to gold-backed economies or currencies.
India and China — major gold holders — use gold reserves as insurance against sudden currency outflows.
Thus, while not directly traded in everyday commerce, gold plays a silent yet powerful role in ensuring trade stability and economic security.
6. Reserves and Global Monetary Policy Coordination
Large economies with massive reserves, such as China, the U.S., Japan, and the EU, influence global monetary policy and liquidity. When these nations adjust their reserve holdings, the ripple effects are felt across markets.
Example:
If China decides to diversify its reserves away from USD, it can weaken the dollar and affect global commodities priced in USD.
Similarly, when the U.S. Federal Reserve raises interest rates, countries with smaller reserves face capital outflows, forcing them to use their reserves to defend their currencies.
Reserves also help countries align with global financial standards, such as IMF guidelines, ensuring they can participate smoothly in global trade and monetary cooperation.
7. Crisis Management: Reserves as a Shield Against Shocks
Economic and geopolitical crises can paralyze trade. During such times, reserves become the first line of defense.
Key Functions During Crises:
Liquidity Support: Helps settle international debts and maintain import flows.
Currency Intervention: Prevents currency collapse during capital flight.
Market Confidence: Shows the world that the country can handle uncertainty.
Real-World Example:
During the Asian Financial Crisis (1997), countries like Thailand and Indonesia with low reserves faced severe devaluation.
In contrast, China maintained stability due to its massive reserves, strengthening its trade position in the region.
Similarly, during the COVID-19 pandemic, India’s high reserves enabled it to import medical equipment, oil, and essential goods without currency panic.
Hence, reserves are not just savings — they are insurance policies for trade continuity.
8. Strategic Use of Sovereign Wealth Funds (SWFs)
Some countries, especially oil-rich nations like Saudi Arabia, Norway, and UAE, channel their reserves into sovereign wealth funds. These funds invest globally in:
Infrastructure
Equity markets
Bonds
Real estate
This helps generate long-term returns, diversifies income sources, and supports national trade goals. For example:
Norway’s Government Pension Fund Global uses oil revenue reserves to invest worldwide, ensuring sustainable economic growth even beyond oil dependency.
UAE’s ADIA (Abu Dhabi Investment Authority) invests surplus reserves to stabilize domestic and external trade flows.
These funds not only protect reserves but also enhance global trading relationships through strategic investments.
9. Reserves and Exchange Rate Manipulation Debate
There’s an ongoing global debate about whether large reserves are used for exchange rate manipulation. Some nations allegedly maintain artificially undervalued currencies to boost exports.
For instance:
The U.S. has often accused China of holding vast reserves to control the yuan’s value and maintain trade dominance.
However, such control also helps countries avoid imported inflation and protect export-led growth.
This dual nature makes reserves both a tool of stability and a geopolitical instrument in global trade negotiations.
10. The Indian Perspective: Building a Fortress of Stability
India provides an excellent modern example of how reserves shape a nation’s trading destiny.
Foreign exchange reserves (as of 2025): Over $650 billion
Gold holdings: Over 800 tonnes
These reserves allow India to:
Manage rupee volatility effectively.
Finance essential imports like crude oil and electronics.
Maintain investor confidence despite global uncertainty.
Negotiate trade deals confidently with other nations.
The RBI (Reserve Bank of India) uses these reserves not only to stabilize the currency but also to signal financial strength — crucial for attracting global trade and investment partners.
11. Future Outlook: The Digital Era of Reserve Management
The future of reserves is transforming with the rise of digital currencies, blockchain technology, and tokenized assets. Central banks are exploring digital reserve diversification, such as:
Holding Bitcoin or CBDCs (Central Bank Digital Currencies).
Using blockchain for transparent cross-border settlements.
Diversifying away from the U.S. dollar dominance (a trend tied to de-dollarization).
In the next decade, reserves will evolve beyond traditional forms — becoming digitally liquid, globally diversified, and algorithmically managed, changing the very structure of international trade finance.
12. Challenges and Risks in Managing Reserves
Despite their benefits, reserve management carries significant risks:
Opportunity Cost: Excess reserves may yield low returns compared to productive investments.
Currency Risk: Holding assets in volatile currencies can cause valuation losses.
Geopolitical Sanctions: Reserves held abroad can be frozen during conflicts (as seen in Russia’s 2022 case).
Inflation Erosion: Holding low-yield assets may not offset inflation over time.
Thus, the challenge is maintaining a balance between liquidity, safety, and profitability, ensuring that reserves remain a source of strength, not stagnation.
Conclusion: Reserves – The Silent Engine of Global Trade
In the fast-paced world of international trade, national reserves serve as the hidden engine that keeps economies running smoothly. They stabilize currencies, build confidence, ensure import security, and empower countries to face global crises with resilience.
Whether through gold, forex, or sovereign wealth, reserves represent economic credibility and financial sovereignty. As nations move toward digital globalization, the art of managing reserves will define who leads and who follows in global trade.
In simple terms — reserves are not just savings; they are strategic power.
They determine who controls the currency, who leads trade negotiations, and who thrives during global uncertainty.
The next era of global trading will belong to countries that smartly manage, diversify, and digitalize their reserves — turning them into a true engine of economic growth and global influence.

Nifty 50 Index – Intraday Analysis (7th Oct 2025)NSE:NIFTY
Nifty is consolidating at 25,072.55, trading just below the zero line (25,078), after a strong uptrend and subsequent resistance test. Price is at a key inflection zone where range breakout or reversal may occur soon.
Bullish Scenario
Long Entry (25,014):
Fresh longs are actionable above 25,014 if price sustains—buyers have been supporting every dip above this area in recent sessions.
Consider adding positions at 24,989 on healthy retracements, supported by strong demand at recent higher lows.
Upside Targets:
25,210 (Target 1): First supply and likely profit booking area.
25,292 (Target 2): Extension target if momentum continues.
Stop Loss:
Maintain below 24,964 (short entry zone) or trail stops as price moves up.
Bearish Scenario
Short Entry (24,964):
Shorts are actionable below 24,964, marking breakdown of support and a likely shift in control back to sellers.
Downside Targets:
24,945 (Target 1): Bounce/support area; logical covering/profit booking zone.
24,863 (Target 2): Deeper support mapped for an aggressive move.
Stop Loss:
Cover shorts if price returns above 25,014.
Range/Neutral Logic
Zero Line (25,078):
This pivot level dictates sentiment—holding above confirms buyers may push toward upper targets, while persistent rejection can trigger a deeper pullback.
Avoid fresh trades around zero line until directional clarity emerges.

Today's Bullish Move Looks CautiousAs per the price and volume analysis I did yesterday, NSE:NIFTY was expected to give a dip to the support today and then bounce.
But instead, it moved sharply and closed above a very important resistance level — 25000!
However, I’m not fully confident in this move unless we get a follow-up candle of the same strength tomorrow.
Why?
Because there’s a clear pattern suggesting that Smart Money — or say institutions (and I’m not referring to FII data here; I don’t usually trust that) — sold their positions to retailers. The Retail Index went down even on such a strong up day!
That’s not a good sign for the index in the coming days. I think this will soon reflect as a shakeout in the near term.
Now yes, today’s move was backed by buyers’ data and the trend did turn upward — but the momentum didn’t follow through.
Now let’s check what the data says for tomorrow:
– Pivot has risen to 25018, and PP is still tight
– Support for tomorrow: 25025
– Resistance for tomorrow: 25095
According to the data, the index should stay sideways tomorrow.
However, if any of these levels break, here’s my plan:
1. If 25018 breaks on the downside, I’ll short with targets 24930 / 24850
2. If 25095 breaks on the upside, I’ll go long with a target of 25225
Let’s see how it plays out. I’ll stick to my plan as always — no blind chasing.
NSE:BANKNIFTY has broken above its short-term pivot, so I’ll keep my focus there too. Any dip there would be an opportunity to go long.
FnO stocks backed by buyers’ volume:
1. NSE:KEI
2. NSE:BHARATFORG
Sectors to watch tomorrow – Healthcare and Finance.
That’s all for today. Take care and have a profitable tomorrow!
---
📊 Levels at a glance:
- Pivot: 25018
- Support: 25025
- Resistance: 25095
- Downside targets (if pivot breaks): 24930 / 24850
- Upside target (if resistance breaks): 25225
- Pivot Percentile: Tight (range-bound bias)
- Bias: Sideways, watch for shakeout or follow-up confirmation
- Sectors to watch: Healthcare, Finance
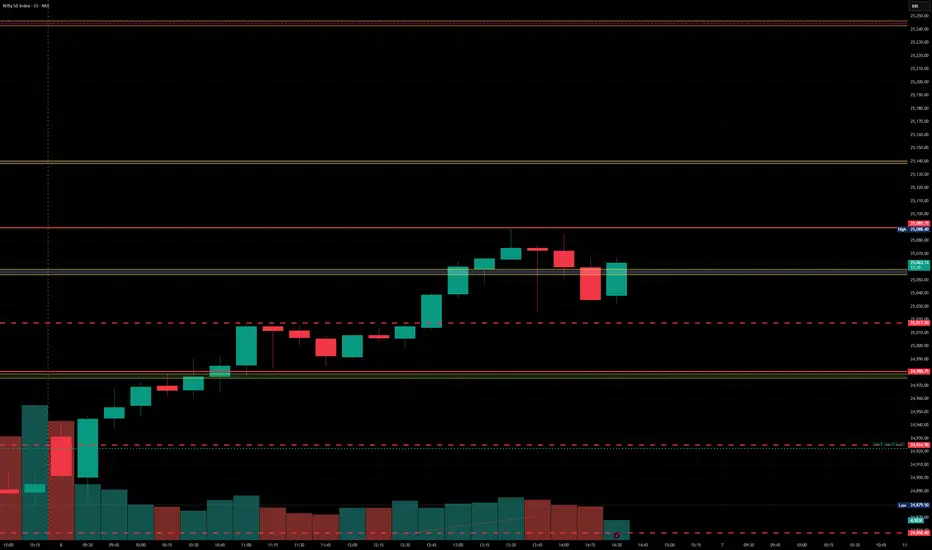
Nifty Analysis EOD – October 6, 2025 – Monday🟢 Nifty Analysis EOD – October 6, 2025 – Monday 🔴
Bulls charge ahead, closing near the highs with firm control
🗞 Nifty Summary
Nifty opened with a 35-point gap up, starting above the Previous Day High (PDH) — a sign of early bullish momentum. The first 15 minutes saw a quick gap-fill, followed by a steady and strong rally throughout the day.
The index paused briefly at the 24,990–25,000 resistance zone, consolidated, and after breaking above 25,020, continued upward to test the next resistance level at 25,085. Despite multiple breakout attempts, this level held strong and acted as the day’s ceiling.
Nifty finally closed at 25,072.55, very near the high of the day, confirming bullish strength and follow-through after the previous week’s recovery.
Overall, today’s session displayed controlled bullish momentum, broad participation, and rising conviction. The day’s range was 214.30 points, exceeding the Gladiator’s Average Range (183.19) — signaling expansion and trend continuation.
Now, the next hurdles for bulls lie at 25,115 and 25,240, both key structural resistance zones.
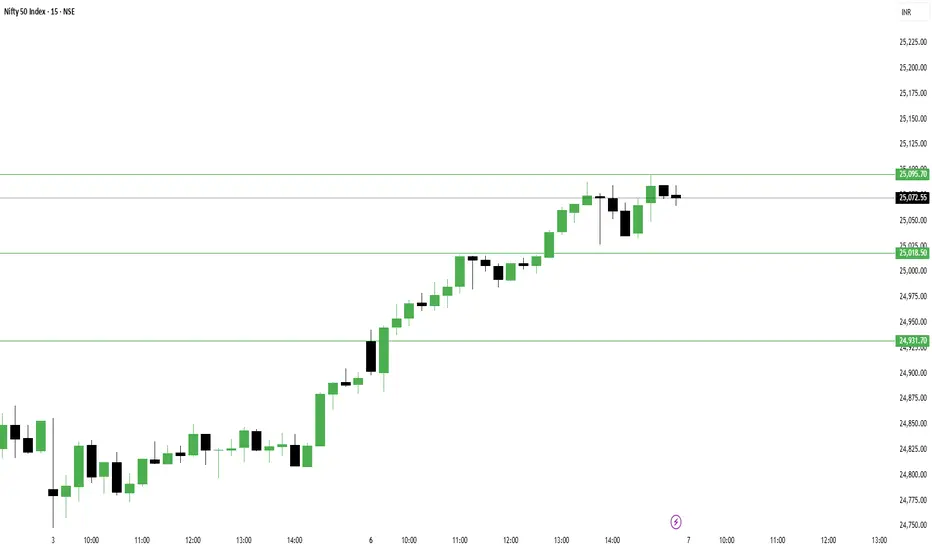
🛡 5 Min Intraday Chart with Levels
🛡 Intraday Walk
Opened Gap-Up by 35 pts above PDH.
Early pullback filled the gap within 15 mins.
From there, steady rally towards 24,990–25,000 resistance.
Breakout above 25,000 led to a sharp push to 25,085.
Multiple failed breakout attempts beyond 25,085.
Closed strong at 25,072.55, near the day high.
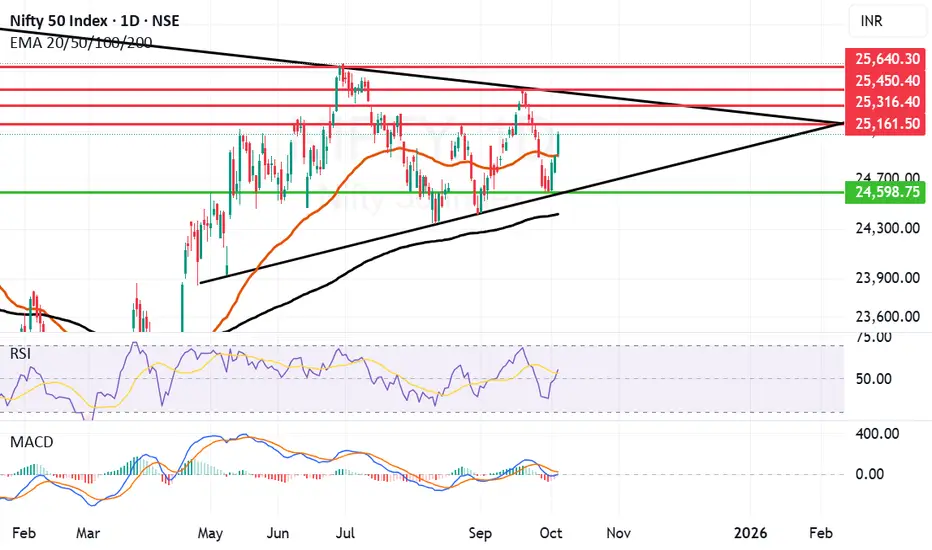
📉 Daily Time Frame Chart with Intraday Levels
🕯 Daily Candle Breakdown
Open: 24,858.25
High: 25,072.55
Low: 24,858.25
Close: 25,072.55
Range: 214.30 pts
Change: +179.55 (+0.72%)
🏗️ Structure Breakdown
Green body with minimal lower wick → strong bullish structure.
Large body (~214 pts) → clear directional day.
Close near high → strong buying conviction.
📚 Interpretation
Market opened strong and sustained momentum throughout.
Buying continued above 25,000, confirming follow-through from Oct 3 session.
The close near the highs suggests a potential move toward 25,115–25,240 next.
🕯Candle Type
Bullish Marubozu-type (open near low, close near high).
Signals decisive buyer dominance and trend continuation.
🛡 5 Min Intraday Chart
⚔️ Gladiator Strategy Update
ATR: 183.19
IB Range: 86.2 → Medium
Market Structure: Imbalanced
Trade Highlights:
09:40 Long Trade – Target Achieved (R:R 1:1.92)
12:45 Long Trade – Target Achieved (R:R 1:3.52)
📌 What’s Next? / Bias Direction
Bias: Bullish
As long as 25,000–25,048 holds, buyers retain control.
A breakout above 25,115 may accelerate momentum toward 25,240 and possibly 25,330.
📌 Support & Resistance Levels
Resistance Zones:
25115
25140 ~ 25165
25240
Support Zones:
25048
25000 ~ 24990
24900 ~ 24915
💡 Final Thoughts
“Momentum is built one breakout at a time — and sustained when structure supports conviction.”
The market tone remains positive as bulls continue defending key levels with strong follow-through.
✏️ Disclaimer
This is just my personal viewpoint. Always consult your financial advisor before taking any action.

Great Closing above Motherline of Daily Chart. Nifty has given a brilliant closing above Mother line of daily chart and key psychological level of 25K at 25077. Supports for Nifty are at Mother line 24899, Trend line support at 24598 and finally Father line support at 24417. Resistances are at 25161, 25316 and 25450 and finally 25640.
Above 25640 there will be a major Bullish breakout which can take us to 26K or even previous All time high or even beyond it. It will be very important for Nifty to hold the levels now and again not go below the Mother or Father line otherwise again all the momentum that has built in favour of the rally will vanish as quickly.
Having said that RSI, MACD and shadow of the candle suggest are oozing with confidence this time let us see what this week and month holds for us, things look good as of now.
Disclaimer: The above information is provided for educational purpose, analysis and paper trading only. Please don't treat this as a buy or sell recommendation for the stock or index. The Techno-Funda analysis is based on data that is more than 3 months old. Supports and Resistances are determined by historic past peaks and Valley in the chart. Many other indicators and patterns like EMA, RSI, MACD, Volumes, Fibonacci, parallel channel etc. use historic data which is 3 months or older cyclical points. There is no guarantee they will work in future as markets are highly volatile and swings in prices are also due to macro and micro factors based on actions taken by the company as well as region and global events. Equity investment is subject to risks. I or my clients or family members might have positions in the stocks that we mention in our educational posts. We will not be responsible for any Profit or loss that may occur due to any financial decision taken based on any data provided in this message. Do consult your investment advisor before taking any financial decisions. Stop losses should be an important part of any investment in equity.
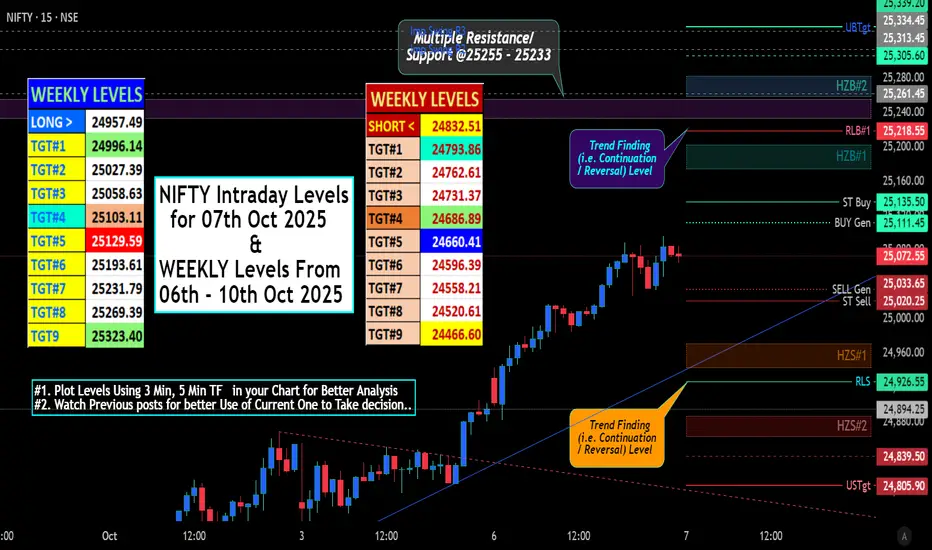
NIFTY Intraday & Swing Levels for 07th Oct 2025# "WEEKLY Levels" mentioned in BOX format.
^^^^^^^ Plot Levels Using 3 Min, 5 Min Time frame in your Chart for Better Analysis ^^^^^^^
L#1: If the candle crossed & stays above the “Buy Gen”, it is treated / considered as Bullish bias.
L#2: Possibility / Probability of REVERSAL near RLB#1 & UBTgt
L#3: If the candle stays above “Sell Gen” but below “Buy Gen”, it is treated / considered as Sidewise. Aggressive Traders can take Long position near “Sell Gen” either retesting or crossed from Below & vice-versa i.e. can take Short position near “Buy Gen” either retesting or crossed downward from Above.
L#4: If the candle crossed & stays below the “Sell Gen”, it is treated / considered a Bearish bias.
L#5: Possibility / Probability of REVERSAL near RLS#1 & USTgt
HZB (Buy side) & HZS (Sell side) => Hurdle Zone,
*** Specialty of “HZB#1, HZB#2 HZS#1 & HZS#2” is Sidewise (behaviour in Nature)
Rest Plotted and Mentioned on Chart
Color code Used:
Green =. Positive bias.
Red =. Negative bias.
RED in Between Green means Trend Finder / Momentum Change
/ CYCLE Change and Vice Versa.
Notice One thing: HOW LEVELS are Working.
Use any Momentum Indicator / Oscillator or as you "USED to" to Take entry.
⚠️ DISCLAIMER:
The information, views, and ideas shared here are purely for educational and informational purposes only. They are not intended as investment advice or a recommendation to buy, sell, or hold any financial instruments. I am not a SEBI-registered financial adviser.
Trading and investing in the stock market involves risk, and you should do your own research and analysis. You are solely responsible for any decisions made based on this research.
"As HARD EARNED MONEY IS YOUR's, So DECISION SHOULD HAVE TO BE YOUR's".
Do comment if Helpful .
In depth Analysis will be added later
Nifty levels - Oct 07, 2025Nifty support and resistance levels are valuable tools for making informed trading decisions, specifically when combined with the analysis of 5-minute timeframe candlesticks and VWAP. By closely monitoring these levels and observing the price movements within this timeframe, traders can enhance the accuracy of their entry and exit points. It is important to bear in mind that support and resistance levels are not fixed, and they can change over time as market conditions evolve.
The dashed lines on the chart indicate the reaction levels, serving as additional points of significance to consider. Furthermore, take note of the response at the levels of the High, Low, and Close values from the day prior.
We hope you find this information beneficial in your trading endeavors.
* If you found the idea appealing, kindly tap the Boost icon located below the chart. We encourage you to share your thoughts and comments regarding it.
Wishing you success in your trading activities!
Nifty Next Move toward 21500Nifty to moves towards 21500 to max target at 21200
Then we might see a technical bounce for 1000 points.

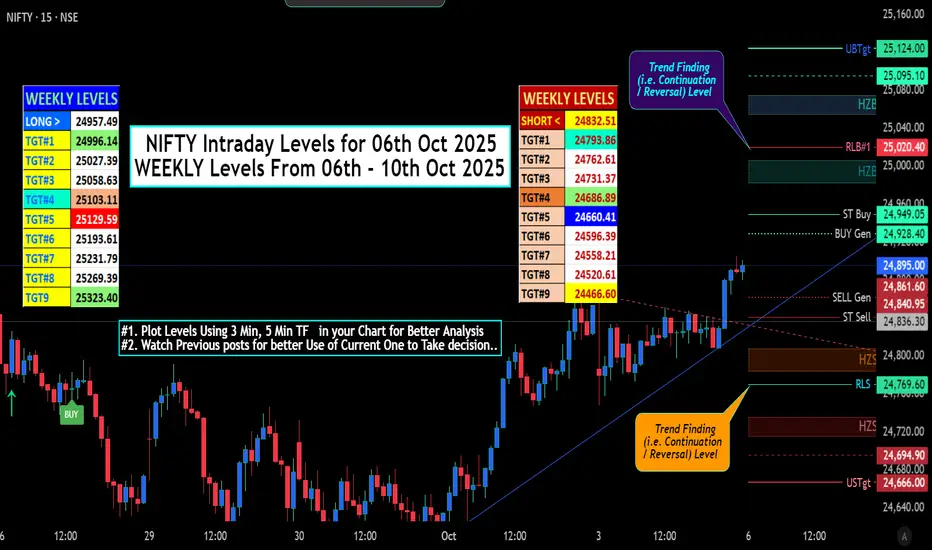
NIFTY Intraday Levels for 06th Oct 2025# "WEEKLY Levels" mentioned in BOX format.
^^^^^^^ Plot Levels Using 3 Min, 5 Min Time frame in your Chart for Better Analysis ^^^^^^^
L#1: If the candle crossed & stays above the “Buy Gen”, it is treated / considered as Bullish bias.
L#2: Possibility / Probability of REVERSAL near RLB#1 & UBTgt
L#3: If the candle stays above “Sell Gen” but below “Buy Gen”, it is treated / considered as Sidewise. Aggressive Traders can take Long position near “Sell Gen” either retesting or crossed from Below & vice-versa i.e. can take Short position near “Buy Gen” either retesting or crossed downward from Above.
L#4: If the candle crossed & stays below the “Sell Gen”, it is treated / considered a Bearish bias.
L#5: Possibility / Probability of REVERSAL near RLS#1 & USTgt
HZB (Buy side) & HZS (Sell side) => Hurdle Zone,
*** Specialty of “HZB#1, HZB#2 HZS#1 & HZS#2” is Sidewise (behaviour in Nature)
Rest Plotted and Mentioned on Chart
Color code Used:
Green =. Positive bias.
Red =. Negative bias.
RED in Between Green means Trend Finder / Momentum Change
/ CYCLE Change and Vice Versa.
Notice One thing: HOW LEVELS are Working.
Use any Momentum Indicator / Oscillator or as you "USED to" to Take entry.
⚠️ DISCLAIMER:
The information, views, and ideas shared here are purely for educational and informational purposes only. They are not intended as investment advice or a recommendation to buy, sell, or hold any financial instruments. I am not a SEBI-registered financial adviser.
Trading and investing in the stock market involves risk, and you should do your own research and analysis. You are solely responsible for any decisions made based on this research.
"As HARD EARNED MONEY IS YOUR's, So DECISION SHOULD HAVE TO BE YOUR's".
Do comment if Helpful .
Ib depth Analysis will be added later
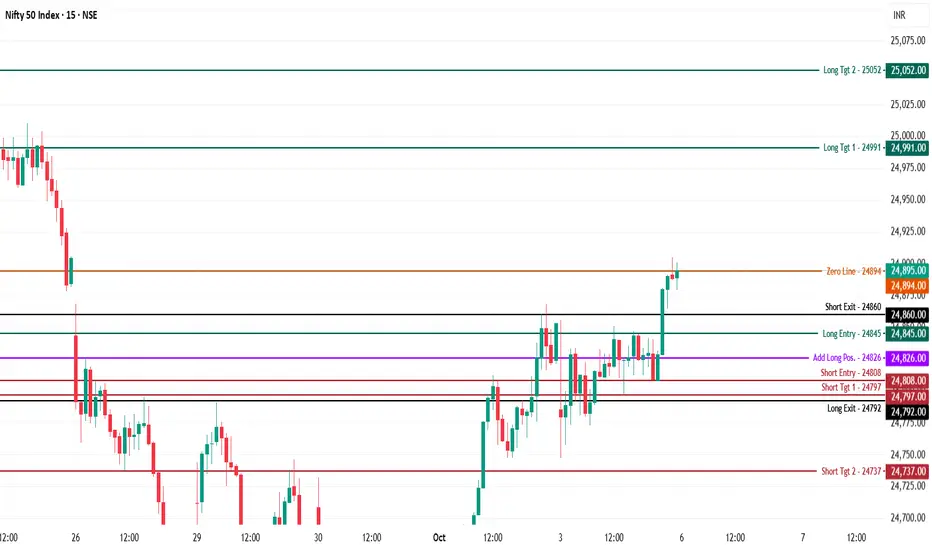
Nifty 50 Index – Intraday Analysis - 6th of Oct., 2025NSE:NIFTY
Nifty is trading at 24,895, and has just tested the zero line after a strong upward momentum surge, consolidating near key resistance after a breakout move.
Bullish (Long) Setup
Long Entry (24,845):
Fresh longs can be initiated above 24,845 as bullish momentum takes charge after reclaiming previous resistance.
Consider pyramiding/additional buys near 24,826 if minor dips hold and buyers defend this band, marking sustained accumulation.
Upside Targets:
24,991 (Target 1): First intraday supply and recent high, logical area for profit booking if trend continues.
25,052 (Target 2): Extended bullish target and upper channel resistance.
Stop Loss:
Maintain tight stops below 24,808 (short entry band) or trail as price approaches target for risk management.
Bearish (Short) Setup
Short Entry (24,808):
Shorts only activate below 24,808 on breakdown of support, giving control to bears and signaling failed recovery.
Downside Targets:
24,797 (Target 1): Immediate support and prior bounce area.
24,737 (Target 2): Deeper extension, mapping further weakness if selling accelerates.
Stop Loss:
Cover shorts if price sustains above 24,845 to minimize drawdown on failed breakdowns.
Range/Neutral Logic
Zero Line (24,895):
Price at zero line indicates pivot zone; sustained action above encourages bullish bias toward mapped targets, while slips below may revert to consolidation or minor pullback.
Weekly Market Wrap: Nifty, BankNifty & S&P 500 OutlookNifty closed the week at 24894, gaining 240 points from the previous week. The index made a high of 24904 and a low of 24587, once again respecting the range I mentioned last week — 25050–24250.
From the week’s low of 24587, we’ve seen a sharp bounce back toward 24900, exactly as projected.
Nifty Outlook for Next Week
For the coming week, I expect Nifty to trade between 25300–24500.
A breakout or breakdown beyond this range could bring some real fireworks
Bullish Scenario:
If Nifty sustains above 24900/24950 on Monday, we could see a rally toward 25300, supported by strength in Banking, Financials, and Metal sectors.
Bearish Scenario:
Below 24750, bears might get an opening to drag Nifty toward 24500 — though, as of now, that looks less likely unless global sentiment weakens.
⚠️ Caution:
While short-term momentum looks positive, the monthly and weekly charts of Nifty still lack strong bullish confirmation. Those waiting to capture a big 800–1000-point breakout move should be patient until we see a clear bullish crossover on higher timeframes.
Sector Spotlight: Metals
As mentioned last week, Metals continued to shine, with the Metal Index up 4% this week!
It also gave an all-time high weekly close above 10220, a key breakout level.
If it sustains above 10220 next week, the index can rally another 4% toward the next major resistance at 10709.
👉 Keep your eyes on metal stocks hitting new all-time highs (ATHs) — momentum could stay strong here.
BankNifty Update
BankNifty is forming a W pattern on the weekly timeframe — a strong bullish reversal formation.
Stay alert for potential breakouts in leading banking stocks, as they might fuel the next leg of the rally.
Global Cues – S&P 500
The S&P 500 gave an all-time high close at 6715, up 72 points from last week.
If it sustains above 6700, expect a move toward 6780.
For investors already long — move your trailing SL to 6560 to protect profits.
For those waiting to enter — 6568/6570 offers a better risk–reward entry zone.
Key Takeaways
✅ Nifty range for next week: 25300–24500
✅ Bulls need 24950+ for continuation; bears only active below 24750
✅ Metals remain the sector leader
✅ BankNifty W pattern could fuel the next upmove
✅ S&P 500 remains in a strong uptrend — global sentiment supportive

NIFTY50.....Sideways trading range!Hello Traders,
the NIFTY50 rose 239 points or 0.97% for the week.
It opened with a gap to the upside, but closed it immediately! Overall, the N50 is trading within a sideways range, from 25449 to 242587.
Chart analysis:
If the N50 extends its short-term gains, the target range is around 25449 and above, to the pink rectangle, from 25523-25654 area.
Extending this further, the next pink rectangle comes into focus in the 26K-26250 area.
To the downside, there is potential to drop to 24478-24295! More bearish potential exist.
As long as the green wave (ii) low is not touched, the labels are still valid in my view If so, the targets to look for are much lower. But one step at a time.
On the upside, there is a chance to rise, after the 25448 has overcome, to 26312-27438 in extension.
This could be a wave (iii), in green, with more bullish potential to the upside.
Well, friends, that's it for today.
Have a great week....
Ruebennase
Please ask or comment as appropriate.
Trade on this analysis at your own risk.

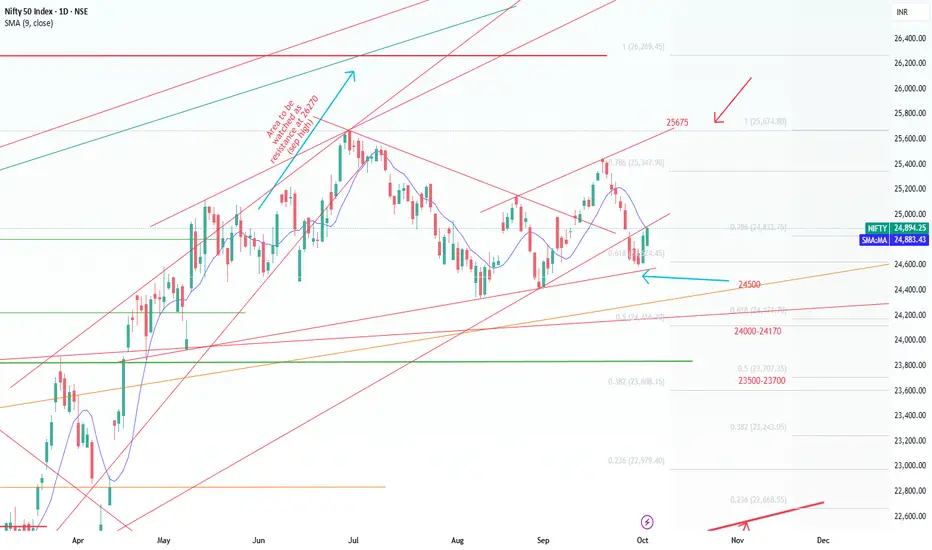
Nifty Short & Medium Term Support&Resistance_5-Oct to 10-Oct-25Nifty Short & Medium Term Support&Resistance_5-Oct to 10-Oct-25
Nifty very well hold the 24500 Support and currently near to the trend line support (as drawn) as mentioned last week.
Repo rate reduction by RBI boosted the market as there will be more liquidity in the market and it will aid more loan disbursal. But there is a small concern is FD rate reduction and inflation may go little higher.
Last two days trade reflected it and market moved up, one more positive decisive break can take to short term resistance.
Quarterly result and Tariffs deal will decide the future path of the Nifty. Since it is a Volatile situation SIP route or buy in multiple parcel route with a goal of 3-5 years will workout.
Since FD rate reduction, people may have to choose Debt/Commodity/Equity as alternate in order to beat the inflation.
Apart from that Low Cost ULIPs (2.5 L Limit per person) as one of the option to save the tax- ICICI & HDFC ULIPs are doing well, ULIPs are simplified and charges are lesser compared to MFs in terms of long term, Various fund option including passive funds are introduced.
Market was on decline/ Consolidation mode recently because of new Tariff's imposed by Trump mainly on Pharma and IT - H1 B Visa and Tax for Outsourcing IT and the recent pharma tarrifs imposition.
GST 2.0 is a reform which can aid in Auto/ FMCG / Home Appliances sales will get a boost due to the festival season.
Since market is volatile, use the dips (Opportunity) and buy through SIP or through multiple parcel in these uncertain times with a goal of 3-5 years.
Nifty Short Term Supports:
1. 24500 (Trend Line as shown)
2. 24000-24170 (Fibonacci Retracements Supports- Two Supports in this zone 24116 & 24171 as shown)
Medium Term Support:
3. 23500-23700 (Fibonacci Retracements Supports- Two Supports in this zone 23608 & 23707 as shown)
4. 23000
Resistance ( Multiple Resistances are there between 25000-25650):
1. 25000
2. 25200 ( 25154 Aug 2025 high)
3.25350 ( Fibonacci resistance shown )
3. 25500 ( 25441 Sep 18th 2025 High )
Medium Term:
1.25670 ( Jun 2025 High) Should cross this resistance in short term decisively inorder to move up.
2.26269 ( Sep 2024 High)
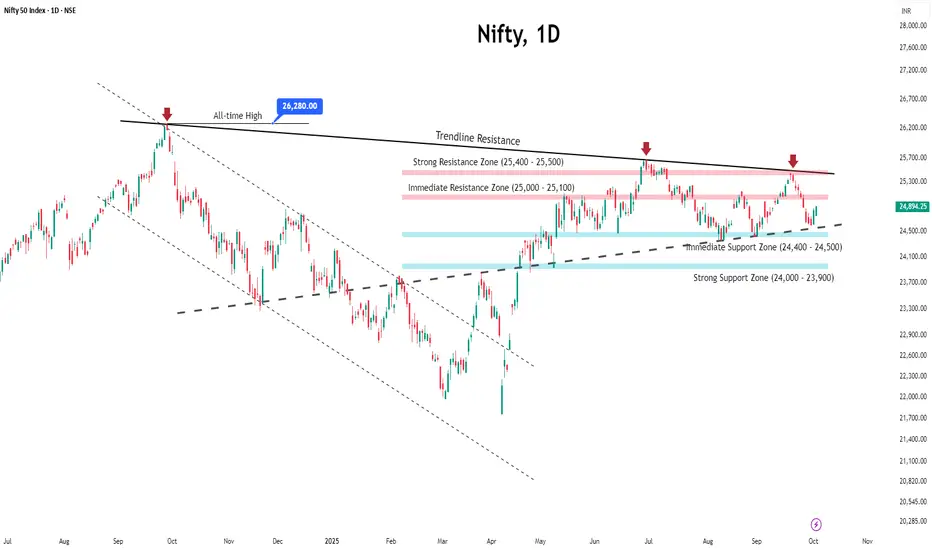
Positive Sentiment Drives Nifty Higher, Resistance in SightThe Nifty 50 closed the week on a positive note, rising nearly 1%, supported by strong macro cues and sectoral gains.
RBI Policy Boost:
The Reserve Bank of India kept the repo rate unchanged at 5.50% for the second straight meeting while raising FY26 GDP growth to 6.8% and lowering the inflation forecast — a move that lifted overall market sentiment.
Sector Highlights:
Banking stocks led the rally, with Bank Nifty up over 2% as private lenders like Kotak Mahindra Bank and Axis Bank posted solid gains.
Metals also shined, with Nifty Metal up 1.85%, driven by optimism over potential Fed rate cuts and a weaker dollar.
Key Levels to Watch:
Resistance: 25,000–25,100 remains a tough barrier. A breakout above 25,100 could spark a rally toward 25,400.
Support: 24,400–24,500 is the key zone to hold. A dip below this may trigger renewed selling pressure
Outlook:
The market is expected to consolidate within the current range, with sector rotation likely to drive short-term moves. Overall sentiment remains constructive as long as Nifty holds above key support levels.
Nifty Levels for Monday October 6th 2025Nifty levels to trade are 25000 to 24900 if you find any rejection short here to targets below 24800,24750,24650,24600 and 24500.
Look for price sustaining above 25k for 1st hour after market open if price sustains above 25k long for the targets of 25100,25200,25250,25300 and 25400 above.
Market structure is sell on rise and bearish for intraday trades.
Do your analysis before taking entries based on this view this is only for educational purpose.
Happy Trading !!!!

Nifty supply demand 6th OctoberNifty supply demand 6th October
Check the third dated trading plan that uses supply and demand zones drawn from the chart before yesterday

Nifty supply demand 3rd OctoberNifty supply demand 3rd October
Check the third dated trading plan that uses supply and demand zones drawn from the chart before yesterday

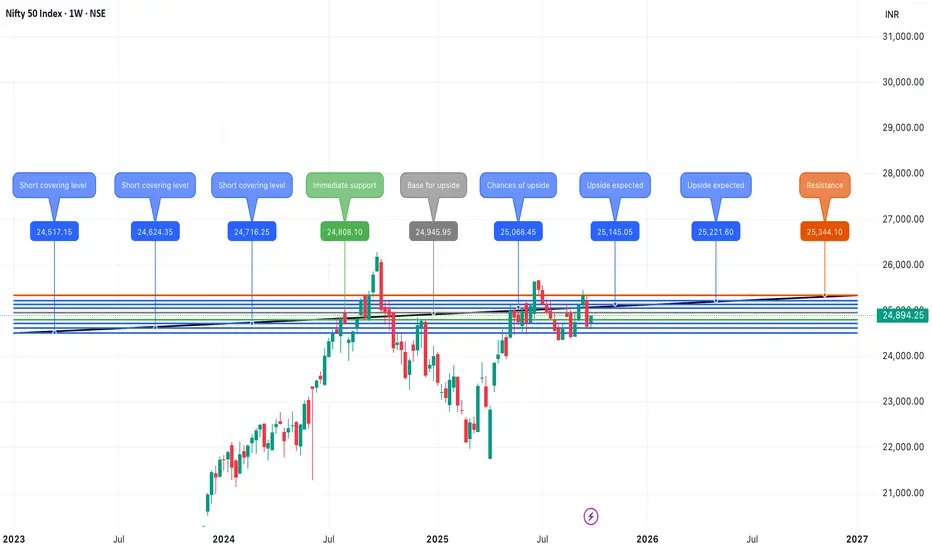
Nifty October 1st Week ViewNifty is looking positive for the upcoming week. The base for upside momentum is around 24945. If Nifty is able to sustain above 24945, then we can expect upside momentum up to 25300+ . On the downside, if Nifty breaches the important support of 24800, then we can expect a retracement up to 24550.
All levels are marked in the chart posted.
Bulls are Back if...."As per the chart, some fair value gaps remain unfilled, and the market needs to liquidate itself to rally further upside after the long sell-off. The market needs to test 24,700 again to reach a new high in the October series."
Fresh Long Position as per chart is 24812 level break , hope Bulls are back

Nifty retraced from Trendline supportNifty retraced from Trendline support. If US markets will close positive next week then same we can expect from Indian markets
